Welcome to the January
Edition of the 2021 M&R
 Seminar Series
←
→
Page content transcription
If your browser does not render page correctly, please read the page content below

Welcome to the January Edition of the 2021 M&R Seminar Series
NOTES FOR SEMINAR ATTENDEES

• All attendees’ audio lines have been muted to minimize background noise.

• A question and answer session will follow the presentation.

• Please use the Chat feature to ask a question via text to All Panelists.

• The presentation slides will be posted on the MWRD website after the
 seminar.

• ISPE has approved this seminar for one PDH. Certificates will only be
 issued to participants who attend the entire presentation.
Dr. Alexandria Boehm
Professor, Department of Civil and Environmental Engineering
 Stanford University, Stanford, California
 Dr. Alexandria Boehm is a professor at Stanford University, Department of
 Civil and Environmental Engineering. She received her bachelor of
 science from the California Institute of Technology in engineering and
 applied science, and her master’s degree and doctorate in environmental
 engineering from the University of California Irvine. Her research focuses
 on pathogens in the environment including their sources, fate, and
 transport in natural and engineered systems. She is also interested
 broadly in coastal water quality where her work addresses the sources,
 transformation, transport, and ecology of biocolloids - specifically fecal
 indicator organisms, DNA, pathogens, and phytoplankton - as well as
 sources and fate of nitrogen. She presently serves on the State of
 California Ocean Acidification and Hypoxia science task force and is an
 associate editor at Environmental Science & Technology and
 Environmental Science & Technology Letters. She received the American
 Society of Civil Engineers Huber Prize in 2016 and a National Science
 Foundation CAREER award in 2007.
SCAN:
 Sewer Coronavirus Alert
 Network
 Alexandria Boehm

 Krista Wiggington

Team members: Katy Graham, Stephanie Loeb, Marlene Wolfe, Nasa
Sinnott-Armstrong, Suzy Kim, Lorelay Mendoza, Laura Roldan-
Hernandez, Kevan Yamahara, Lauren Sassoubre, David Catoe
 4
How did we
get here?!!

 5
Outline
1. Background on wastewater-based epidemiology (WBE) and SARS-CoV-2
 in feces
2. Sample acquisition and method development
3. Application to retrospective samples
4. Real time surveillance
5. Model to compare measurements across plants

 6
1. Background on wastewater-
based epidemiology (WBE) and
SARS-CoV-2 in feces

 7
Wastewater Based Epidemiology

• Wastewater is a composite biological sample
• Everyone contributes
• Previous applications for polio, narcotics

 Bivens et al. 2020

 8
COVID-19 Surveillance
Clinical Testing
• Lack of test-seeking - asymptomatic and mild
 cases
• Diagnostic test shortages/delays
• Lag times for reporting

Wastewater Testing
• SARS-CoV-2 RNA shed in feces
• No behavior change required
• Potential as an early indicator
 9
~50% of patients have fecal samples that tested positive for
SARS-CoV-2 RNA and shedding of RNA persists for up to
several weeks

 ?

 10
Wastewater vs Clinical Data Timeline
 Clinical Results (to patient) Clinical Results (to county)

 Tests Reported
 4 days (range 1-10)
 Test Turnaround
 2 days (range 1-5)
Clinical
 Symptomatic
 1-21 days
 Incubation
 5 days (range 1-14)

 Days

 0 1 2 3 4 5 6 7 8 9 10 11 12 13 14 15 16 17 18 19 20 21 data from Wölfel paper
 on fecal shedding
 Latent
 5 days (range 1-14)

 Fecal Shedding
Wastewater
 1-? days
 Test Turnaround
 1 day
 Wastewater Results 11
2. Sample acquisition and
method development

 12
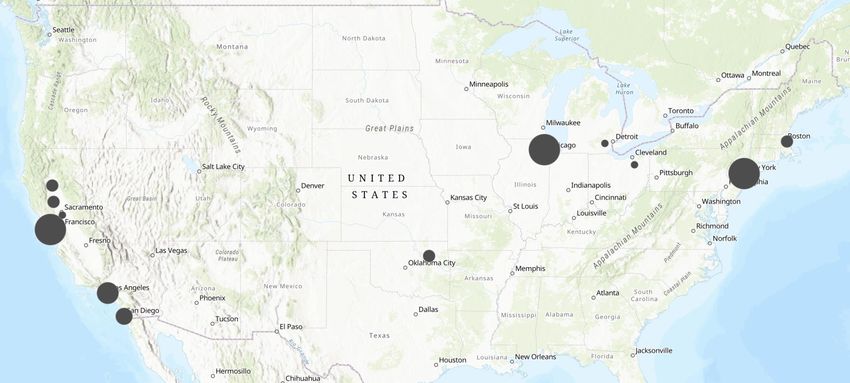
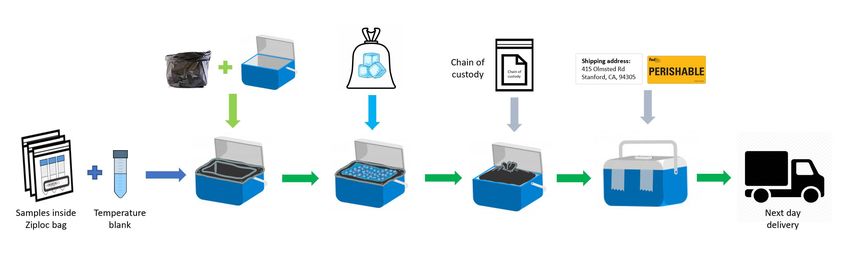
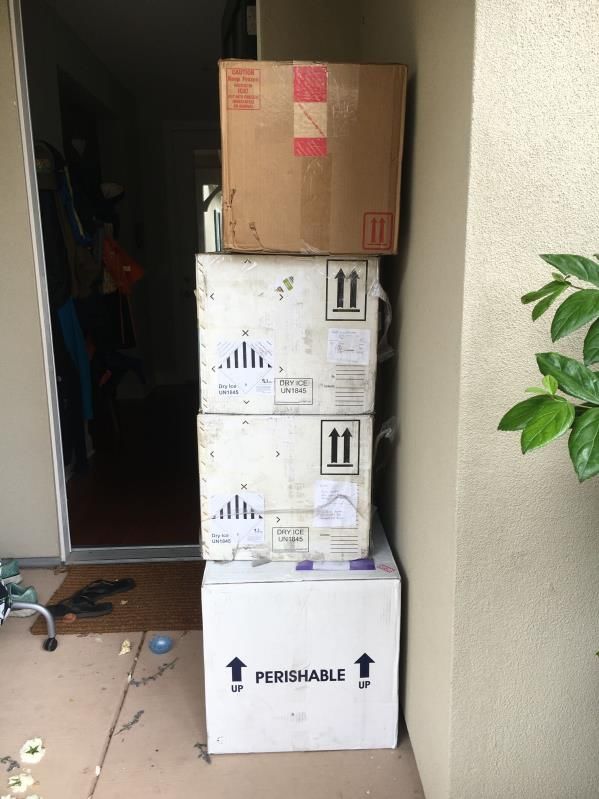
Sampling

Regular sampling of wastewater took place at a total of 50 WWTPS nationwide
 Influent and primary settled solids
 13
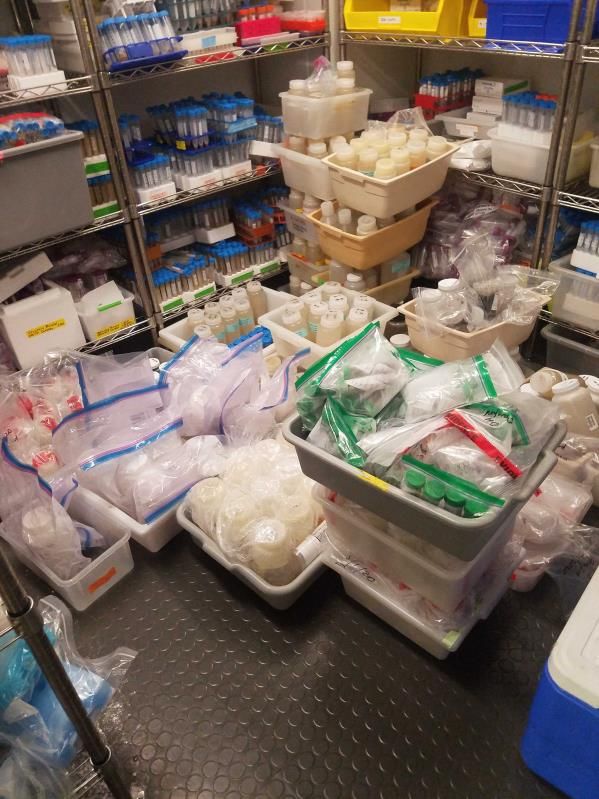
Sample aquisition
• We spent a significant amount of time
 in Feb and March 2020 organizing
 sample collection, shipping, pick-up
 and storage
• Influent? Solids? How to store?
• We collected ~ 1500 samples

 14
Method optimization and testing

Previous work out of the Wigginton group showed enveloped viruses like SARS-CoV-2
have an affinity for wastewater solids, so we wanted to sample settle solids in
addition to influent.

 15
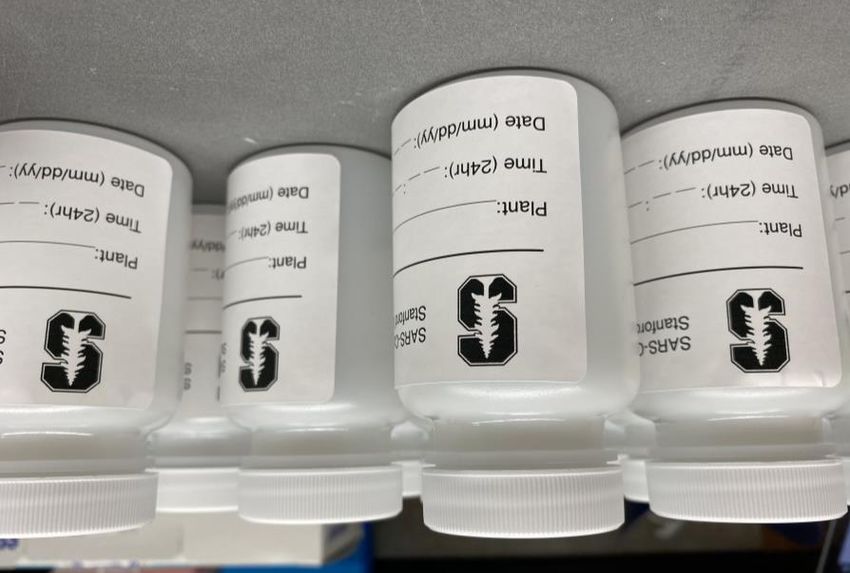
Method testing study design

• Compare SARS-CoV-2 RNA levels in
 influent and solids at 2 wastewater plants Santa Clara County
 on 5-7 days
• Compare results from QPCR analyses to
 ddPCR analyses
• Measure viral RNA recovery (BCoV)
• Measure “fecal strength” of waste stream
 using pepper mild mottle virus (PMMoV),
 also serves as a recovery control

 PMMoV is a rod shaped,
 Samples labeled by date
 non-enveloped, RNA virus

 16
Pre-analytical & analytical workflow for influent

 17
Pre-analytical & analytical workflow for solids

 18
Two-step RT-QPCR vs one-step digital PCR for solid sample

 digital droplet RT-PCR
 15000
 RT-QPCR 15000

 10000 10000

 N1
N1

 5000 5000

 19
Influent
Solids outperform influent

- Limited variation among
 replicates Solids, PF
- Inhibition an issue for some
 samples
- Concentrations of N1 and N2
 1000 x higher in solids than Solids,
 influent on a per mass basis RNeasy

 20
Example BCoV recoveries
and PMMoV for
Powerfecal extraction kit

 • Recoveries varied
 between 0 and 25%.
 • PMMoV was fairly
 constant (except one
 day)
 • No correlation between
 recovery and PMMoV,
 N1, and N2
 concentration

 21
Method evaluation conclusion

 • Higher rate of detection in solids
 • SARS-CoV-2 genes 1000x higher in solids (per
 mass)
 • Limited variation among replicates
 • Move forward with N1 and N2 in settled solids for
 SARS-CoV-2 surveillance at wastewater treatment
 plants
 • Protocols available at protocols.io

 22
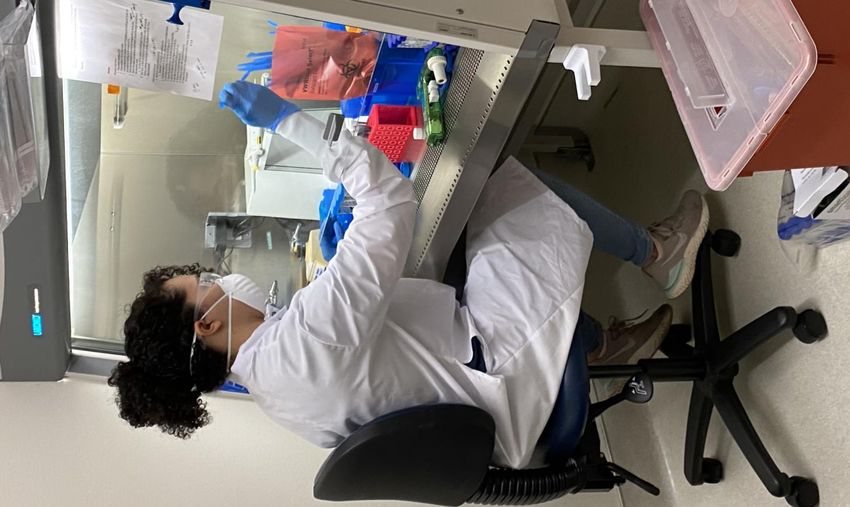
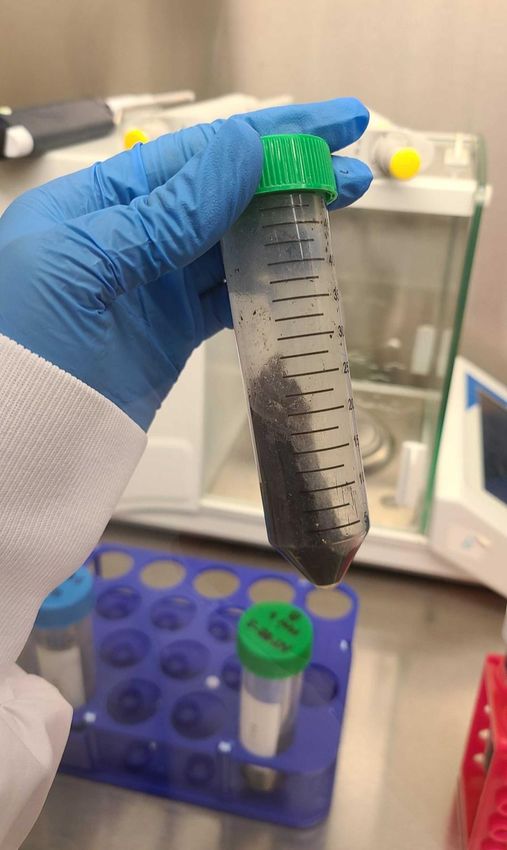
Laboratory Methods
• Direct RNA extraction from dewatered solids
• Droplet digital PCR for SARS-CoV-2 genes and analytical controls
• Controls:
 • Pepper Mild Mottle Virus as an endogenous control and measure of fecal strength
 • Bovine coronavirus (BCoV) as a process control, to estimate recovery
 Droplet digital PCR

 RNA
 Extraction

 Raw Sample in Centrifuge Remove TSS
 50mL Tube supernatant SARS-CoV-2 Controls:
 • BCoV
 Spike BCoV • PMMoV
 23
3. Application to retrospective
samples

 24
Longitudinal data from San
Jose WWTP
• Serves 1.5 million people in Silicon Valley
• Add FeCl2 as pre-treatment step
• Daily to 3 times per week, 24 h composite
 samples
• Followed solids protocol with Rneasy
 extraction kit
• Measured N1 and N2 SARS-CoV-2 gene
 targets
• Measured PMMoV and BCoV recovery
• Confirmed clinical cases in sewershed from
 county epidemiologist
 25
Association between N1 and N2 and case data?
• Positive correlation (first difference approach used to account
 for autocorrelation)
• Downsampling analysis → sampling less than 2 X per week –
 correlation not significant
• Normalizing by PMMoV – correlation still strong

How could these data have been used retrospectively?
• In early June during apparent rise in new cases, POTW data
 could have confirmed not a testing artifact
• Could have been used to confirm disappearance of cases
 during late April / early May

How can results be used to learn about infectious prevalence?
• First peak actually much higher than reflected in case data
 (owing to limitation in testing).
• Can these data provide insight into time course of fecal
 shedding or infection prevalence?

 26
27
Longitudinal data from
Stickney, Chicago
• Serves 2.5 million people
• Weekly data, 24 h composite samples
• Followed solids protocol with Rneasy
 extraction kit
• Measured N1 and N2 SARS-CoV-2 gene
 targets
• Measured PMMoV and BCoV recovery

 28
Longitudinal data from New York
 • Serves 848,328 people
 • Weekly data, grab samples
 • Followed solids protocol with Rneasy
 extraction kit
 • Measured N1 and N2 SARS-CoV-2 gene
 targets
 • Measured PMMoV and BCoV recovery
 • Sewer-shed level clinical data

 29
4. Real time surveillance

 30
Real time monitoring Pilot
 • 8 plants with daily samples
 • Process solids with 10 replicates
 • Measure:
 • SARS-CoV-2: N Gene, S Gene, ORF1a
 • Controls: BCoV, PMMoV
 • Posted to dashboard in 24 hours
 • Daily communication and weekly meeting with plants
 and health officers and CDC
 • Partner with an industrial lab with robotics

 wbe.stanford.edu
 31
Communicating with stakeholders via dashboard

 32
33
34
35
36
Challenges with using wastewater data
• Sources of variability are foreign
 to public health professionals
• How to best interpret and display
 data requires ongoing dialogue
 with stakeholders
• Case data for specific sewersheds
 is difficult to obtain
• Comparison of measurements
 across plants must be done
 thoughtfully (with the goal of
 comparing covid-19 case load)

 37
5. Model to compare
measurements across plants

 38
Solids measurement
 SARS RNA/g
 PMMoV RNA / g
 Travel time t
 Decay rate constant k

Fraction population infected
Fraction population shedding SARS RNA
SARS RNA/g TSS measurement
Fecal solids (g)

 Primary clarifier
 Solids retention time t
 Decay rate constants k, kp

Some assumptions
- Decay SARs and PMMoV RNA is minimal in the system
- A fraction of TSS is fecal solids
- Conceptually, SARS RNA is delivered to the system along with fecal solids
- Once in the waste stream, SARS RNA and SARS in solids and liquid reach equilibrium
 - Kd = Conc in solids/Conc in liquids [ml/g] = Cs/Cw = 1000 ml/g
 39
 1 +
 =
 _ ℎ

 • wastewater specific Not expected to
 measurements vary by sewershed May vary by
 • if TSS and Kd are the same sewershed and
 among plants, then time
 Cs/CPMMoV can be directly
 compared between plants
 • KdTSS = 10-4*TSS = 0.1 – 1.0

Plotting LHS vs New cases/Psewershed should give a straight line with slope = A*Cfeces/CPMMoV_feces

 40
Application of model to 3 plants

 • Suggestive that y-axis can be used
 to assess COVID-19 prevalence
 • Further work is needed to
 determine if Cs/CPMMoV would be
 sufficient for cross plant
 comparisons

 41
Next Steps
• Refining data visualization to aid in interpretation
 • Very different sources of uncertainty and variability
 compare to clinical data
 • Add clinical data to dashboard

• Application of model to:
 • Allows for between-plant comparisons
 • Estimate of community transmission

• Expansion of testing
 • Potentially adding additional plants to real-time
 monitoring
 • Adding assays for new variants of concern
 • Sequencing SARS-CoV-2 in sewage

• Continued outreach and networking
 42
Thank you!
• POTW staff including MWRD for sample collection and sharing
• Sam Dorevitch, Cook County Dept of Public Health, and Chicago Dept
 of Public Health for sewershed level case data in Stickney sewershed
• Linlin Li and Michael Balliet at Santa Clara County Public Health

aboehm@stanford.edu

 43
You can also read