BUSINESS CASE HYDROGEN INFRASTRUCTURE - JUSER
←
→
Page content transcription
If your browser does not render page correctly, please read the page content below
Business Case Hydrogen Infrastructure
C. Stiller, J. Michalski, U. Bünger

This document appeared in
Detlef Stolten, Thomas Grube (Eds.):
18th World Hydrogen Energy Conference 2010 - WHEC 2010
Parallel Sessions Book 1: Fuel Cell Basics / Fuel Infrastructures
Proceedings of the WHEC, May 16.-21. 2010, Essen
Schriften des Forschungszentrums Jülich / Energy & Environment, Vol. 78-1
Institute of Energy Research - Fuel Cells (IEF-3)
Forschungszentrum Jülich GmbH, Zentralbibliothek, Verlag, 2010
ISBN: 978-3-89336-651-4
Proceedings WHEC2010 405
Business Case Hydrogen Infrastructure
Christoph Stiller, Jan Michalski, Ulrich Bünger, Ludwig-Bölkow-Systemtechnik
GmbH, Germany
1 Introduction, Scope and Methodology
A hydrogen refuelling infrastructure is more complex than other fuel infrastructures due to the
number of technology options, the site- and volume-dependent cost structure, the varying
CO2 emissions burden depending on hydrogen source and the risks and conflict of interests
of the players involved. Market economics alone cannot lead to a successful breakthrough of
this technology; a coordinated and concerted approach is needed for the early introduction.
A case study has been conducted to realistically simulate the build-up of hydrogen use in
transportation and refuelling infrastructure in the Greater Oslo Area in Norway. The
H2INVEST model was used to simulate the hydrogen infrastructure and to perform business
analyses for the region. The model creates sets of refuelling sites allowing for maximum user
convenience, estimates the hydrogen demand at these locations over time, and creates cost-
optimum spatially and timely discrete production and distribution infrastructure to supply the
hydrogen to the sites, respecting potential policy measures. 1
Then, these results were utilized for a detailed business analysis, focussing on the five
stations with highest and lowest demand, respectively.
The paper highlights key results of the case study in terms of refuelling station build-up,
hydrogen supply infrastructure and subsidy models. Conclusions will be drawn on the
requirement of subsidies and levelling mechanisms between high- and low-demand stations.
2 Hydrogen Demand and Refueling Station Rollout
The case study is based on modelling the spatial distribution of the infrastructure and its
development over time. In 2008, the Greater Oslo Area (GOA) had about 980,000
inhabitants. It is assumed that the users of the cars live in the GOA, while they may drive to
places outside; i.e. hydrogen refuelling stations can also be located outside GOA which also
holds for hydrogen production locations. The analysis timespan covers 2010 to 2025 in one-
year steps.
We have assumed that mass roll-out of hydrogen fuel cell vehicles commences in 2016-18
and that by 2025, about 60,000 hydrogen vehicles will be registered in the area, beside
private cars also comprising about 100 public city buses and fair numbers of multi-purpose
vehicles and delivery vans. A total hydrogen demand of app. 6,000 tons/year was projected
for these vehicles by 2025. The vehicles were distributed over the municipalities of GOA
following deployment logics at regional scale (i.e. a municipality which is connected later will
1
For a detailed description of the methodology used to calculate demand, locate refuelling stations
and optimise the hydrogen supply infrastructure in the H2INVEST model, refer to
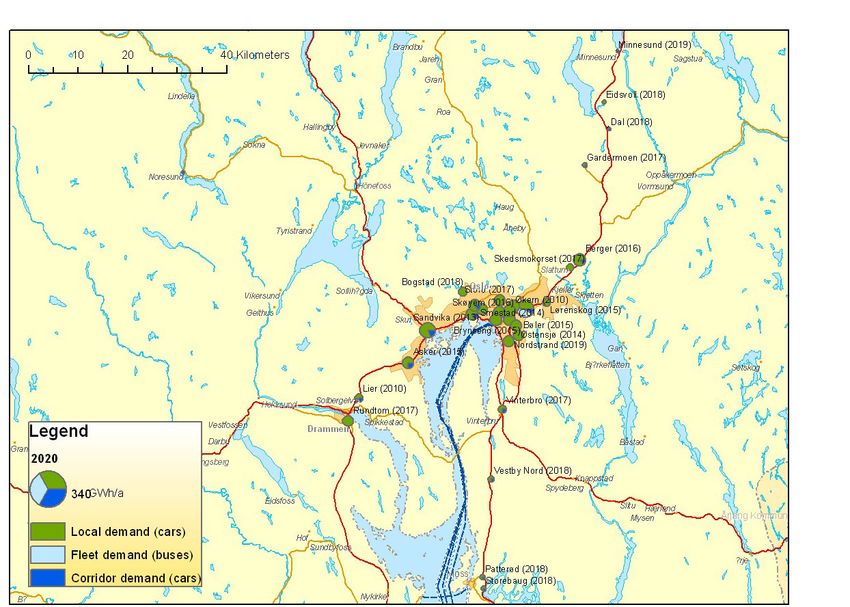
www.H2INVEST.com406 Proceedings WHEC2010 gradually catch up in penetration with municipalities connected earlier). The number of refuelling stations in the area was assumed to reach a level of 20-30 by the year 2020 and then remain constant until 2025 (with the average hydrogen turnover per station continuously growing). The stations were assigned to the municipalities respecting the area and the local vehicle population. Then, to place the hydrogen stations within each municipality, a subset of conventional refuelling sites was chosen. It was distinguished between hydrogen demand for local, highway and public fleet driving. Conventional refuelling sites along high traffic roads were preferred in general while at the same time a widespread distribution of HRSs across the analysis region should be achieved. With a set of 30 stations, an average travel distance to the next refuelling station of 3.4 km is achieved (assuming vehicles and HRS to be equally distributed over the municipalities). By reducing the number of HRS to 20, this distance increases to 4.1 km. Finally, the hydrogen demand at the stations was estimated by means of a simple distance-related traffic model and scaled by the traffic passing by each station. Figure 1: Selected hydrogen refuelling locations and calculated hydrogen demand 2020. Figure 1 shows the selected hydrogen refuelling station locations and the estimated hydrogen demand at each station by 2020 (30 stations). Stations in the centre encounter the highest demand due to high traffic density than in remote locations. Four standard station equipment types were defined with capacities of 25, 300, 1,000, and 3,000 kg/day. Once the demand at a station would exceed the current capacity, the current equipment would be removed (to be installed at a new site, either within the same area or in other areas), and the next larger equipment type would be installed.
Proceedings WHEC2010                                                                                                                                          407

                    30                                                                           30
                           2000 kg/day                                                                  2000 kg/day
                    25                                                                           25
                           1000 kg/day                                                                  1000 kg/day
    Number of HRS

                                                                                 Number of HRS
                    20     300 kg/day                                                            20     300 kg/day
                           25 kg/day                                                                    25 kg/day
                    15                                                                           15

                    10                                                                           10

                    5                                                                            5

                    0                                                                            0
                    2010    2012       2014   2016   2018   2020   2022   2024                   2010    2012       2014   2016   2018   2020   2022   2024

Figure 2:                     Split of HRS types over time (left: 20 stations; right: 30 stations).

Figure 2 depicts how the HRS type split changes over time for scenarios with 20 and 30
stations. It can be seen that 1/2 (20 HRS) and 2/3 (30 HRS) of the lowest capacity station
equipment is required between 2016-18 when the hydrogen turnover is low in order to create
customer convenience. For economic reasons this is unfavourable for the retailers since
such stations require high investments and yield low revenues. The initial investment in small
HRS is not lost as it is assumed that the equipment will be used at more remote locations
later (outside the analysis region) afterwards. Yet, in order to avoid early investments in a
large number of specifically costly small HRS an option is to install higher capacity
equipment earlier though initially heavily underutilized. Although this would result in higher
initial costs they are likely to be overcompensated by savings for avoided new installation
costs after a few years.

3                   Hydrogen Supply Infrastructure Build-up
With the H2INVEST model [2], cost optimized production and transport infrastructure
scenarios were calculated to supply the above set of refuelling stations with the hydrogen
demand estimated. Relevant hydrogen production options defined were electrolysis (central
& onsite), central steam reforming of NG and biogas, and biomass gasification, and a set of
industrial locations for the placement of these production plants were specified.
As hydrogen delivery options truck-based distribution of vessel bundles, tube and liquid
trailers or pipeline distribution were chosen. Also, short pipelines between adjacent stations
to jointly utilize onsite generation equipment were foreseen to form local clusters. The
techno-economic data of the production and transport equipment were mainly taken from [3]
and [4]. Data on electrolyser and refuelling equipment came from Statoil. The energy prices
assumed can be seen in Figure 3. Natural gas and conventional fuel prices rely on a
constraint fossil resources scenario [1].
408 Proceedings WHEC2010
0.12
0.10
Energy costs €/KWh
0.08 NG central
Biomass (Straw )
0.06 Grid electricity central
0.04 Grid electricity at FS
Biogas central
0.02
0.00
2010
2011
2012
2013
2014
2015
2016
2017
2018
2019
2020
2021
2022
2023
2024
2025
Figure 3: Energy prices assumed for scenarios.
Out of these options, the H2INVEST model calculated integrated supply infrastructure
scenarios, choosing hydrogen production locations and production equipment as well as the
distribution mode to the set of pre-defined hydrogen refuelling stations. The optimization
objective for each time step is to supply the entire hydrogen demand at minimum annual
costs. Figure 4 shows the resulting hydrogen production and distribution infrastructure by
2024.
Aggregated results of the hydrogen production and distribution in GOA for the scenario with
30 stations can be seen in Figure 5. For 2010 to 2015 the model suggests to supply most
HRSs with by-product hydrogen from a nearby chlorine-alkali-electrolysis plant by tube
bundle trailers, which, due to the low total demand, turns out to be the cheapest option
during this phase. Only the HRS for buses has a higher hydrogen throughput and is supplied
by tube trailer, representing about 80-90% of the overall hydrogen demand in that period.
By 2017, a biogas based SMR is installed, and all hydrogen is supplied from there by truck.
By 2020, more biogas reformers are added, and due to the increasing hydrogen turnover, the
majority of the HRS is supplied by tube trailers. By 2022, a further demand increase causes
a radical shift in the infrastructure, since the limited regional biogas potential available for
hydrogen is exceeded. Electrolysis is added to the production portfolio, and most central
HRS locations switch to pipeline supply (see also Figure 4). Two onsite electrolysers are
built.Proceedings WHEC2010 409
Legend
HRS
Production facilities
Byproduct hydrogen
Biogas / SMR
Natural gas / SMR
Electrolysis
Biomass / gasification
Distribution
Tube bundle route
Tube trailer route
LH2 route
Pipeline route
Figure 4: Production and distribution infrastructure for Oslo (30 stations; 2024).
After 2022 the infrastructure does not change further radically. The increased demand is
mostly supplied by new electrolysis capacity, and the pipeline grid is expanded by a few
branches towards HRS locations at the city border to replace shorter truck routes.
NG-based SMR and biomass gasification were not chosen due to the high feedstock price
assumed for NG, and the low efficiency and high electricity consumption assumed for the
biomass gasification plant. Likewise, LH2 distribution is not used in any of the scenarios,
since it is typically beneficial for larger distances. LH2 had most likely become a preferred
option if a larger supply region had been analysed.
Hydrogen production Hydrogen distribution
100% 15,000 100% 15,000
80% 12,000 80% 12,000
tons hydrogen/a
tons Hydrogen/a
60% 9,000 60% 9,000
%
%
40% 6,000 40% 6,000
20% 3,000 20% 3,000
0% 0
0% 0
2010
2011
2012
2013
2014
2015
2016
2017
2018
2019
2020
2021
2022
2023
2024
2025
20 0
20 1
20 2
20 3
14
20 5
20 6
20 7
18
20 9
20 0
20 1
22
20 3
20 4
25
1
1
1
1
1
1
1
1
2
2
2
2
20
20
20
20
Onsite Grid Electrolysis Onsite NG-SMR Central Grid Electrolysis Onsite Pipeline CGH2 tube trailer
Central Biogas SMR Central NG-SMR Byproduct hydrogen LH2 trailer CGH2 bundle trailer Turnover (tons/a)
Biomass gasification LH2 existing liquefier Turnover (tons/a)
Figure 5: Aggregated hydrogen production and distribution (30 stations).
In the scenario with only 20 stations, the resulting infrastructure roll-out is very similar.
However, electrolysis and pipelines are chosen about 2 years earlier than for the 30 station
option (Figure 5) which results from the higher turnover per station, a major decision criterion
for the hydrogen distribution type.
As a consequence from the use of biogas and electricity (which in Norway is practically
greenhouse gas neutral due to the large percentage of hydropower in the electricity mix), the
resulting well-to-wheel GHG emissions for fuel cell cars are very low from 2017 and onwards,410 Proceedings WHEC2010
reaching a CO2 equivalent level of below 20 g/km. The introduction of hydrogen mobility in
Oslo as specified here can cumulatively save about 300,000 tons CO2 equivalent until 2025.
4 Business Case Analysis
The simulation results from above were used for a detailed economic evaluation of the
refuelling stations and the hydrogen infrastructure. In particular, the H2INVEST business tool
allows for clustering single infrastructure elements into business divisions and specifying
transfer prices for hydrogen between divisions and players defined. With these inputs, major
economic parameters such as operating income, cash flow from investments and capital
structure are calculated for each division. The clustering process can be structured by the
position within the value chain (production-conditioning-distribution-refuelling), being either
technology- or location-specific. Financial results can be generated for each business
division.
For this study, we assumed two major types of investors. One investor (one independent
business division) is responsible for the entire production and transportation of hydrogen to
the HRS, regardless of the technology. Furthermore, every HRS is one business division,
assuming the HRSs to be economically independent from each other. The transfer price for
hydrogen deliveries between the production division and HRSs is site-specific and includes
both operating costs (i.e. variable and fixed operating and maintenance costs as well as
energy costs) and capital costs (i.e. debt interest and cost of equity). The consumer price at
the HRS, however, is calculated as gasoline equivalent and is exempt from fuel taxation until
2020. From 2021 to 2025, we assumed taxation to ramp up to per-km parity with
conventional fuel, reducing the net price received by the refuelling station. In addition we
assumed the following:
Working capital requirement for each technology is 5% of the initial investment.
Declining balance depreciation is used for every infrastructure element.
Debt ratio is 20% with 9.5% interest on average and 12% costs of equity for all
investors.
Division tax is 30%.
No extra overhead for infrastructure planning and no inflation.
The profitability of the HRS was assessed based on site-specific net present values (NPV) as
a sum of the corresponding discounted free cash flows. The final free cash flow at the end of
the analysis timeframe contains the remaining book value of the corresponding equipment in
order to account for the terminal value of each station in a conservative way. Figure 6 (left)
shows the NPV results for the five HRSs with highest demand (in central, heavily travelled on
areas) and five HRSs for lowest demand (in rural areas, which are required for customer
convenience), respectively. It can be seen that while for the high-turnover HRSs, the NPV
increases from 2020 to 2025 and two stations yield a positive result by 2025, for the low-
turnover HRS the NPV decreases even further during this period. This is because the latter
have higher specific hydrogen costs and through the beginning fuel taxation, the net retail
price is strongly reduced.
We also calculated a case with a one-time investment subsidy upon erection of a new
refuelling station of 1.5 million € for HRSs erected by 2010, reduced by 10% eachProceedings WHEC2010 411
subsequent year (see Figure 6 right) in order to ensure adequate profitability for all stations.
With this subsidy, the 2020 NPV is levelled out to a positive value for all HRSs. However, by
2025 the high-turnover HRSs have a high NPV, while for the low-turnover HRSs, the NPVs
have decreased to a value near zero. This is also due to the specific hydrogen costs.
Moreover, because the high-turnover HRSs are generally erected earlier than the low-
turnover HRSs, the high-turnover HRSs receive more subsidies, and the NPV difference in
2025 is higher than without subsidies. A fair subsidising scheme must therefore not only
consider the year of erection but also the site particularities (such as traffic and population
density). Yet, the delay of the late stations must be taken into account; assuming a further
increase in turnover, some years later also the low-turnover stations would probably yield
positive NPVs.
1.0 1.0
NPV (no subsidies) NPV w ith investm ent subsidies
0.8 0.8
(1.5 m ill. € for HRS built in 2010; -10%/year)
2020 2025
0.6 0.6
2020 2025
Net present value (mill. €)
0.4 0.4
0.2 0.2
0.0 0.0
1 2 3 4 5 26 27 28 29 30 1 2 3 4 5 26 27 28 29 30
-0.2 -0.2
-0.4 -0.4
-0.6 -0.6
-0.8 -0.8
5 HRS with highest turnover 5 HRS with lowest turnover 5 HRS with highest turnover 5 HRS with lowest turnover
-1.0 -1.0
Figure 6: NPV of 5 HRS with highest and lowest turnover; w/o and w/ subsidies.
5 Conclusions
A detailed study for the hydrogen refuelling infrastructure for the Greater Oslo Area was
conducted, assuming 20-30 hydrogen refuelling stations by 2025. The results suggest that
over time and with increasing demand, hydrogen sources will switch from hydrogen by-
product to biogas and later to electrolytic hydrogen. Hydrogen delivery is initially
accomplished using vessel bundles and tube trailer trucks; later a pipeline infrastructure
gradually develops to supply the most central locations. A CO2 equivalent level of below 20
g/km is reached (well-to-wheels). A business analysis of the refuelling stations results in
negative net present values by 2020 for all stations; by 2025, stations with high turnover
partially achieve positive NPV. Applying subsidies, these values can be varied, but a
degressive investment subsidy alone is not able to level out financial differences between
stations with high and low turnover.412 Proceedings WHEC2010
References
[1] GermanHy – a study addressing the question: “Where Will the Hydrogen in Germany
Come from by 2050?”. Financed by the German Federal Ministry of Transport,
Building and Urban Affairs in collaboration with the German National Organization
Hydrogen and Fuel Cell Technology. 2008. Final report, August 2009, available at
www.germanhy.de.
[2] Ludwig-Bölkow-Systemtechnik GmbH: H2INVEST, the hydrogen infrastructure
venture support tool, www.h2invest.com
[3] HyWays – an integrated project to develop the European Hydrogen Energy
Roadmap, European Commission, 6th Framework Programme (contract N° 502596),
Deliverable 1.4: technology fact sheets. Ottobrunn, Germany: Ludwig-Bölkow-
Systemtechnik GmbH, 2007. http://www.hyways.de
[4] The Research Council of Norway. NorWays—providing decision support for
introduction of hydrogen into the Norwegian energy system, project 173045/S30.
Trondheim, Norway: SINTEF. Report D8, “Description of / Results from Infrastructure
Analysis Model”, February 2009, available at www.ntnu.no/NorWays.You can also read