The Relationship between Blue-Girdled Angelfish - Macrothink Institute
←
→
Page content transcription
If your browser does not render page correctly, please read the page content below
Journal of Agricultural Studies
ISSN 2166-0379
2017, Vol. 5, No. 1
The Relationship between Blue-Girdled Angelfish
(Pomacanthus Navarchus) Exploitation and Availability
for a Sustainable Fishery in South Sulawesi
Mauli Kasmi, Asriany, Karma
Agribusiness Department of Fisheries, Agriculture Polytechnic State Pangkep
South Sulawesi
Received: October 8, 2016 Accepted: December 17, 2016 Published: December 27, 2016
doi:10.5296/jas.v5i1.10511 URL: http://dx.doi.org/10.5296/jas.v5i1.10511
Abstract
Blue-girdled angelfish, Pomacanthus navarchus is marine, expensive ornamental fish and is
gaining popularity to be traded globally from which the social welfare increases. The study
aims to (1) analyze exploitation status of fish regarding fish stock sustainability in South
Sulawesi water, and (2) find out fish availability and demand in terms of exploitation level.
Making the estimation of exploitation level, it applies optimum effort (Eopt) using FOX
model; and making the prediction of fish demand and supply, it applies least square method.
The findings indicate the exploitation status of fish in South Sulawesi water has been, in
general, far above the total allowable catch (TAC), while the backward bending curve of fish
availability indicates decreasing supply yet increasing fish price.
Keywords: Exploitation, supply, sustainability, business, ornamental fish, blue-girdled
angelfish
1. Introduction
Blue-girdled angelfish (Pomacanthus navarchus) is the most high-priced ornamental fish in
trade sector because of its shape and eye-catching color. It is gaining popularity among
saltwater aquarium collectors and is one of export commodity in fishing industry.
Blue-girdled angelfish from family Pomancanthidae (Angelfish), has an attractive shape,
every species has their own special characteristics that makes this ornamental fish, in the
aquarium trade, priced high compared to other fish families. All angelfish species stay
among coral reef in tropical water, live solitary or in pairs that can be found between 1 to 50
m deep (Kasmi et al., 2011).
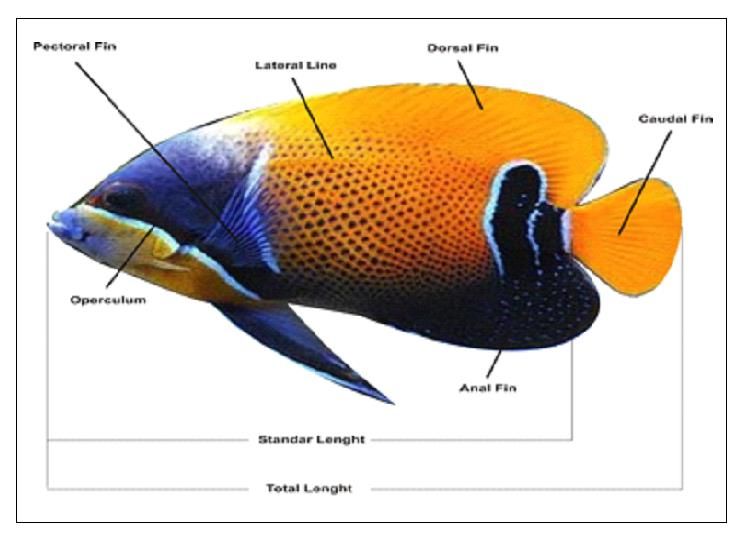
Blue-girdled angelfish grows to a size of 40 cm in length taking on black coloration on the
15 http://jas.macrothink.orgJournal of Agricultural Studies
ISSN 2166-0379
2017, Vol. 5, No. 1
pectoral fin, and yellow coloration on the dorsal and caudal fin. It has soft dorsal fin with
black and yellow stripes along its body, rounded or lunate tail fins with blue edge. It has
white, blue edge ventral and anal fins. The dorsal fins have 13-14 strong fins and 16-18 soft
fins, and the anal fins consist of 3 strong fins and 16-18 soft fins. (The Agency for Marine
and Fisheries Research, 2006)(Figure 1).
Figure 1. Morphology of Angelfish (Pomachantus navarchus)
South Sulawesi water is fairly potential as the fishing area of blue-girdled angelfish
(Pomacanthus navarchus). It is observable based on the fisherman numbers intensively
catching this species to meet a high demand, especially from the developing and developed
countries (Indra, 2007, Kasmi and Sulkifli, 2013). If it remains uncontrolled, it evokes
concern that the fish population will drop fast. This fish production depends on the
wild-caught behavior because the breeding effort does not work yet.
In context of sustainable fishery resource management, it requires information on recent
ornamental fish exploitation status including production level, stock availability, and
reproductive system. Fishery resource management is an effort made to escalate fishery
resource exploitation by conserving its sustainability. In general, fishery resource
management is not organism-based management, but it focuses on an effort to manage
fishing activity and to conserve the environment (FAO, 1995; Charles, 2001).
The study aims to find out the exploitation status of fish regarding fish stock sustainability in
South Sulawesi water, and to find out fish availability and demand in terms of the
exploitation level.
Research findings, hopefully, will be useful as scientific information outlining exploitation
status, market supply and demand of the angelfish in South Sulawesi water.
16 http://jas.macrothink.orgJournal of Agricultural Studies
ISSN 2166-0379
2017, Vol. 5, No. 1
2. Research Methodology
The study is organized from March to May, 2015 in export-oriented ornamental fish small
and medium-sized enterprise (SME) across South Sulawesi Province.
2.1 Angelfish Exploitation Status
Observation of the angelfish exploitation status uses 2 data: Primary Data which is collected
directly from the field by observation and interview with respondent, such as business unit;
and Secondary Data which is collected from office or company as well from ornamental
fish-oriented business units, they are Asosiasi Koral, Kerang, dan Ikan Hias Indonesia
(AKKII/the Indonesia Coral, Shell and Ornamental Fish Association) and Asosiasi Koral dan
Ikan Hias Sulawesi (AKIS/the Sulawesi Coral and Ornamental Fish Association) to complete
the primary data, such as the data of production and fish price during the last ten years.
2.2 Angelfish Supply and Demand as Export Commodity
Research methodologies used in this study are descriptive and explanatory method. Types of
data used in the study based on the dimensions of time are time series data and cross section
data collected from ornamental fish exporter. Time-series data, including fish production,
price and size which are collected from business unit and ornamental fish association during
the last ten years, are used to analyze trend prediction for export-oriented fish.
2.3 Data Analysis
2.3.1 Exploitation Status
Catch per unit effort (C/f) constitutes relative density index. Fish density is predictable based
on the catch record and the effort of a catch series. This method is applied to predict fish
population in order to find an exact number of individual in one area unit (Kasmiet al., 2012).
Optimum effort (Eopt) is calculated by FOX model. The necessary equation for this model
(Kasmi et al., 2012) is:
Relationship between CPUE and catch effort (E):
Ln CPUE = a + bE (1)
(2)
2.3.2 Trends Predictions Offer
Prediction of the supply and demand of angel fish is done using the Least Squares Method
(Yudiaroso, 2009), In general, the linear equation of time series analysis is : Y = a + b X.
Description: Y: variable sought trends
X: variable time (years)
To find the value of the constants a and b parameters obtained by the formula:
17 http://jas.macrothink.orgJournal of Agricultural Studies
ISSN 2166-0379
2017, Vol. 5, No. 1
(3)
(4)
3. Research Findings and Discussion
3.1 Exploitation Status
The production of blue-girdled angelfish in South Sulawesi water is reducing over the years.
According to the data from AKKIS (2015), the caught fish in 2014 is dropping by 66% from
past year, 2006 (Figure 2). Production depends on how hard the utilization effort made on the
target production. The higher target production, the harder effort shall be made and
intensified. In fishing industry, it does not always run well because of many influencing
factors, in particular, such as the location where the fish lives, fishing fleet capability and
oceanographic condition.
Figure 2. Time-based Trends of Fish Catch
Relationship between CPUE and catch effort (average number of fishermen per fishing boat
is 15 people) (Figure 3) makes coefficient of determination (R2) 0.0132. Interaction between
CPUE and catch effort posses weak relationship (under 0.7). . Correlation between CPUE
and catch effort (f) indicates negative relationship based on the equation below: CPUE =
42,116-0.0793 f. It indicates that the more frequent catch effort (f), the weaker fishing gear
productivity will be. Every catch effort addition by f unit will reduce CPUE by multiplying
0.0793 fishes and f unit. Based on this calculation, it reflects the needs of controlled catch
effort for the sake of sustainable fishery resource. It confirms Kasmi findings in 2012 that the
value of relationship is regarded as high if the coefficient of correlation between CPUE and
catch effort ranges from 0.7 to 0.9.
18 http://jas.macrothink.orgJournal of Agricultural Studies
ISSN 2166-0379
2017, Vol. 5, No. 1
Figure 3. CPUE relates to the catch effort
Figure 4 points out a fact that even if the catch effort is increased, the amount of caught fish
keeps decreasing. Apparently, it relates to a condition where the target catch area is selected.
This blue-girgled angelfish catch status carried out during the catch period seems far above
optimum level or above MSY, the increasing number of fishermant.. does not adds up the
production, and conversely, the catch remains drop. This situation, thereby, is at the position
as illustrated by MSY curve below. It supports what Fauzi (2006) had said that if there is no
fishing activity (catch effort = 0), production will be zero. If the effort remains to be elevated
to point E MSY, maximum production will be attained. Production level at this stage is called
Maximum Sustainable Yield. Because of the quadratic curve of Yield-Effort, continuous effort
exceeding point EMSY will not synchronized with production scale-up. At this condition,
overfishing occurs.
Figure 4. Total catch and fishing effort 2006-2014
19 http://jas.macrothink.orgJournal of Agricultural Studies
ISSN 2166-0379
2017, Vol. 5, No. 1
The value of blue-girdled angelfish maximum sustainable yield (MSY) is 5,076 fish where
the optimum effort (fopt.) = 12 fishing boats (Figure 5).
Figure 5. Fox yield-effort curve model
3.2 Blue-girdled Angelfish Demand and Supply
Blue-girdled angelfish demand collected from the field is unconfirmed. There is a report
abroad in South Sulawesi that at any fish caught by the fisherman, this angelfish will be
completely sold out. According to Kasmi et al. (2010), Kasmi (2012, 2013), Kasmi & Sulkifli
(2013), the most appealing ornamental fish in global market is blue-girdled angelfish among
others. At any fish caught, it is sold out without delay, so does the other ornamental fishes on
which the exporters are focusing their attention. These fishes, however, are only found in
particular fishing area that they are rarely available in ornamental fish breeding station.
When the price of blue-girdled angelfish tends to increase (Figure 6), according to the law of
demand, this angelfish demand should be turning down. Since this ornamental fish falls under
unique commodity, the law of demand does not apply. The exception on the law of demand
occurs when a low supply provided in the marketplace causes a high demand from the
consumer and price tends to increase.
Based on the law of supply, the higher price of goods and service, the greater supply of goods
and service offered by the producer will be. In reality, however, such law of supply does not
apply to ornamental fish export rate and price. Price of fish goes up, while the supply tends to
goes down (Figure 6). It confirms statement of Fauzi (2006) that in principle, this Copes
model reflects a balance between demand side and supply side in fishery commodity.
This demand depends on backward bending supply curve of fish on the fishery production
rate at optimum level. Sometimes, there is a supply curve that is negatively inclined. It
20 http://jas.macrothink.orgJournal of Agricultural Studies
ISSN 2166-0379
2017, Vol. 5, No. 1
frequently occurs when the supply curve of fishery commodity bends backward because the
population of wild fish is decreasing (Kasmi, 2012; 2013). It refers to the supply curve of fish
based on Copes model from which this condition begins when the production of blue-girdled
angelfish was initially raising and then dropping over and over as the impact of high
exploitation, even if there was conservation act. The graphic indicates that the supply
moves anticlockwise )or in other word the sharpening inclination of curve is caused by
decreasing fish stock.
According to the historical data (Figure 6), it indicates that the supply and production of fish
in Pangkajene Islands and Taka Bonerate Islands keeps descending, while the price keeps
moving higher. In 2006, the supply of fish is 8,880 fishes and is IDR150,000 per fish. This
supply drops to 3,166 fishes in 2010, but it is more expensive to IDR 210,000 (AKKII &
AKIS, 2014).
The phenomenon of the angelfish supply confirms the findings of Kasmi (2012) stating that
equilibrium supply function is very simple from one fish stock where the access is open and
comes after the fish stock provided by nature and the catch, i.e. growth equals with catch.
Moreover, supply function will go up to Maximum Sustainable Yield and go down to zero
point if the price keeps going higher. Therefore, supply function will finally makes supply
dropped (Chopes, 1970, Kasmi, 2012).It is confirmed by Clark study (1990) that the curve in
regulated open-access and regulated limited access following backward-bending supply
function for small-sized fishing company and supply function is against demand function for
one fish product as conventional commodity.
Figure 6. Angelfish supply curve in Indonesia, 2007-2014
Resource: AKKII and AKIS 2015 (unpublished, modified)
Based on blue-girdled angelfish sales data in Indonesia in 2007-2014 (Figure 6), it indicates
that blue-girdled angelfish supply or catch traded in marketplace have reached 15,891 fishes,
to 23,248 fishes, and fallen down to 17,795 fishes and in 2014, the sales data recorded only
12,487 fishes. This count reduction is collected from AKKII and AKIS year 2014. It is not
21 http://jas.macrothink.orgJournal of Agricultural Studies
ISSN 2166-0379
2017, Vol. 5, No. 1
caused by declining demand of consumer, but a downsizing of angelfish number in wild life.
The biggest demand of blue-girdled angelfish comes from European Union whose the
capability of purchasing up to 50% of Indonesian total export of angelfish. Angelfish demand
also comes from US by 40% and 10% of the demand comes Asian countries (Japan, Hong
Kong and Korea).
Based on the data, it indicates that angelfish supply or production in Indonesia water, in
general, keeps reducing and the price goes up significantly.
Figure 7. Negative-backward bending supply curve of angelfish in Indonesia 2007-2014
Resource: AKKII and AKIS 2015 (unpublished, modified)
Angelfish excess demand as well as its high price compared to the other ornamental fish may
encourage the increase of fisherman activity to continually go fishing for blue-girdled
angelfish. High interest to this ornamental fish is also proved when it is made as bargaining
power when a new supplier wants to get involved in ornamental fish sale and purchase
(Kasmi, 2012, 2013; Kasmi & Sulkifli, 2013). Eventually, it will have impact on the angelfish
population decline because of high exploitation. It causes negative slope on the supply curve
(Figure 7). There was, initially, an increase of supply, but then decrease of supply occurs over
and over.
This analysis is used to make a supply prediction of blue-girdled angelfish for five years
ahead. By using historical data of supply from 2015 to ?, the supply prediction of
blue-girdled angelfish for five years ahead will be predictable (Table 2).
Table 2. Supply prediction of Angelfish 2015-2019
Years Supply (Individu )
2015 3.756
2016 3.166
2017 3.035
2018 1.844
2019 662
22 http://jas.macrothink.orgJournal of Agricultural Studies
ISSN 2166-0379
2017, Vol. 5, No. 1
In 2015, blue-girdled angelfish supply was 3,756 fishes and would be 662 fishes only in 2016.
The supply prediction of angelfish will continually drop on the assumption that all variables
that influence the blue-girdled angelfish for five years ahead are going to be same as the
previous years.
4. Conclusion And Suggestion
The study indicates that the exploitation status of blue-girdled angelfish in South Sulawesi
water is far above the maximum sustainable yield (MSY). Therefore, the more catch effort
will reduce the productivity of fishing gear. It indicates that angelfish faces overfishing.
Moreover, the backward bending supply curve indicates that the supply is going down, even
if the price goes up as the impact of decreasing fish stock.
Assistance
This study activity is a part of Fundamental study entitled “Sustainable Management Strategy
for Blue-girdled Angelfish (Pomacanthus navarthus) in South Sulawesi Water”funded by
DIKTI budget year 2015. This study success is inseparable from the support of various
parties. Our gratitude for the Sulawesi Coral and Ornamental Fish Association (AKIS), the
Indonesia Coral, Shell and Ornamental Fish Association (AKKII) and all institutions in
associated and the whole research team for the success of study.
References
AKKII dan AKIS. (2014). Laporan Realisasi Produksi Ikan Hias di Perairan Sulawesi Selatan,
Jakarta.
Balai Riset Perikanan Laut. (2006). Ikan Hias Laut Indonesia. Penebar Swadaya, Jakarta.
Charles, A. T. (2001). Toward Sustainability. The Fishery Experience Ecological Economics,
11, 201 - 211. https://doi.org/10.1016/0921-8009(94)90201-1
Clark, C. (1990). Mathematical bioeconomics, the optimal management of renewable
resources. 2nd ed. New York: Wiley.
Copes, P. (1970). The backward-bending supply curve of the fishing industry. Scottish
Journal of Political Economy, 17, 69–77.
https://doi.org/10.1111/j.1467-9485.1970.tb00487.x
FAO. (1995). Introduksi Pengkajian Stok Ikan Tropis. Kerjasama dengan Organisasi Pangan
dan Pertanian Perserikatan Bangsa-Bangsa, Pusat Penelitian dan Pengembangan Perikanan,
Badan Penelitian dan Pengembangan Pertanian, Jakarta.
Fauzi, A. (2006). Ekonomi Sumberdaya Alam dan Lingkungan, Teori dan aplikasi. Gramedia
Pustaka Utama, Jakarta.
Indra. (2007). Model Bio-Ekonomi Opsi Rehabilitasi Sumberdaya Perikanan di Provinsi
Nangroe Aceh Darussalam. Disertasi. IPB, Bogor.
Kasmi, M., Netsa Natsir., Jompa. J dan Budimawan. (2014). Struktur Ukuran, Pertumbuhan
dan Rasio Seksual Ikan Hias Injel Napoleon (Pomachantus xanthometopon) di Perairan
Sulawesi Selatan. Jurnal Oseanologi dan Limnologi di Indonesia (OLDI), 40(3): 283 – 294.
23 http://jas.macrothink.orgJournal of Agricultural Studies
ISSN 2166-0379
2017, Vol. 5, No. 1
Kasmi, M dan Sulkifli., (2013). Hubungan Karakteristik Habitat dengan Kelimpahan Ikan
Hias Injel Napoleon (Pomacanthus xanthometopon) di Perairan Kabupaten Pangkep,
Sulawesi Selatan. Jurnal Karya Ilmiah Agrokompleks (Galung Tropika), 2(3), 123 – 128.
Kasmi, M. (2013). Faktor-Faktor yang Mempengaruhi Permintaan dan Penawaran Ekspor
Ikan Hias Injel Napoleon Pomacanthus xanthometopon di Sulawesi Selatan. Jurnal Ilmiah
Agrokompleks (Galung Tropika), 2(3).
Kasmi, M dan Sulkifli., (2013). Analisis Ekspor Ikan Hias Injel Napoleon (Pomacanthus
xanthometopon) di Sulawesi Selatan. Jurnal Karya Ilmiah Bumi Kita (Lingkungan Hidup dan
Pengelolaan Sumberdaya Alam), 2(11), 79 – 94.
Kasmi, M. (2012). Bio-ekologi dan Status Pemanfaatan Ikan Hias Injel Napoleon
(Pomacanthus xanthometopon) di Perairan Sulawesi Selatan. Disertasi. UNHAS, Makassar.
126 hlm.
Kasmi, M., Nessa Natsir., Jompa. J dan Budimawan. (2011). Hubungan Kondisi Habitat
dengan Kelimpahan Ikan Hias Injel Napoleon (Pomacanthus xanthometopon) di Perairan
Sulawesi Selatan. Jurnal Sosial Ekonomi Kelautan dan Perikanan (Ponggawa), 6(2), 67-78.
Kasmi, M., Netsa Natsir., Jompa. J dan Budimawan. (2011). Studi Pendahuluan Tentang
Kelimpahan Ikan Hias Injel Napoleon (Pomacanthus xanthometopon) di Perairan Kabupaten
Pangkep, Sulawesi Selatan. Dalam: Nugraheni, S. P., Istiqomah, I dan Ghozali, N.F (Eds).
Prosiding Seminar Nasional Tahunan VIII Hasil Penelitian Perikanan dan Kaelautan Tahun
2011 Jilid II: Manajemen Sumberdaya Perikanan, Jurusan Perikanan dan Kelautan Fakultas
Pertanian, Universitas Gajah Mada, 16 Juli 2011, Yogyakarta:KL-04(1-5).
Kasmi, M., Yanuarita, D., Jompa, J., Nessa, N. M., Budimawan., Buhari, N, & Husain, A. A.
(2010). Trends and Mangement Challenges of Ornamental Reef Fishes Trading in South
Sulawesi. Presented at International Symposium on Small Islands and Coral Reef in Ambon,
August 4-5, 2010.
Yudiarosa, I. (2009). Analisis Ekspor Ikan Tuna Indonesia. Magister Ilmu Ekonomi Pertanian.
PPSUB. Jurnal WACANA Vol. 12 No. 1 Januari 2009. ISSN. 1411 0199
Copyright Disclaimer
Copyright for this article is retained by the author(s), with first publication rights granted to
the journal.
This is an open-access article distributed under the terms and conditions of the Creative
Commons Attribution license (http://creativecommons.org/licenses/by/4.0/).
24 http://jas.macrothink.orgYou can also read