City gas distribution and fertiliser sector to drive gas demand - Government push for cleaner fuel to fuel the demand - Crisil

Page created by Janice Mendez
 
CONTINUE READING
City gas distribution and fertiliser sector to drive gas demand - Government push for cleaner fuel to fuel the demand - Crisil
City gas distribution and
fertiliser sector to drive
gas demand
Government push for cleaner fuel to fuel the demand
February 2019
Screenshots
Gas demand driven by CGD and refineries                                                                     1
                                                                                                                Gas demand to continue to rise                                                      2
in past two years                                                                                                                                                                                   1

      200                                                                                                            (MMSCMD)
                                                                                                   164              250
                     159                                                           162
                                                                          155                                                       0.34% CAGR                           3.5-3.8% CAGR
      160                    144             143           147
                      32                                                            35             35               200
                                                           28             34
                              29             32
      120
                      14                                                                           20
                              14                           14             15        19                              150
                      21                     13
      80                      20                           19             20        23             25
                                             19
                      45      31             28            32             32        33             34               100                                                                       191-193
      40                                                                                                                      159                    162           164
                      40      44             42            44             42        40             40                50
          0
               FY2013 FY2014 FY2015 FY2016 FY2017 FY2018 FY2019
                                                           E                                                          0
                                                                                                                             FY13                   FY18       FY19E                          FY23F
          Fertilisers        Power           CGD         Refinery          Petrochemicals           Misc.             Source: MoPNG, PPAC, CRISIL Research

Gas demand to outpace production                                                                                Dependence on LNG to remain
                                                                                                            3                                                                                       4

 (MMSCMD)                                                                                                            (MMSCMD)                                                                    (%)
 150                           -7.6%                                                                                180                                                                 51%       60%
                                                                                2.8-3.0% CAGR                                                    50%         50%
                130            CAGR
                                                                                                                    160
                                                                                                                                                                                                  50%
 120             16                                                                                                 140
                                                                                                   103-105                                                                               88
                                                                                                                    120                                                                           40%
                                             88            90              90                                                 47 34%                72        74
                 43                                                                                 10-12           100
  90                                                                                                  2                                                                                           30%
                                             10            11              12                         9
                                                            6               4                                        80
                                             9              8               8
                     7                       8                                                                       60                                                                           20%
  60
                                                                                                                              94                                                         83
                                                                                                                     40                             71        74
                                                                                                    80-82                                                                                         10%
                                                           65              66                                        20
  30             64                          61
                                                                                                                         0                                                                        0%
                                                                                                                             FY13                FY18        FY19E                  FY23F
      0                                                                                                                                 LNG
               FY12                     FY17             FY18         FY19 F                       FY23F                                Domestic sales (Net of production & losses)
                                                                                                                                        Share of LNG
                     ONGC               OIL                   RIL KG D6                  Others
Utilisation rates of terminals to nosedive                                                                  5
                                                                                                                Domestic gas and LNG prices to be range                                                 6
                                                                                                                -bound
 (MTPA)                                                                                                  (%)         ($/MMBTU)

 60                                                                                                      90%        16
                                   74%             77%            77%                                                        13.7
                                                                                                         80%        14
 50
                                                                                                         70%        12                  10.9
              53%                                                                                                                                                             9.8-10.3
 40                                                                                                      60%                                                                                  9.2-9.7
                                                                                         48-50%
                                                                                                                    10       11.3                                  7.9
                                                                                                         50%                                         7.0
 30                                                                                                                  8                                                        9.3-9.8
                                                                                      48-51              40%                                                                                  8.5-9.0
                                                                                                                     6                     7.4                     8.0
 20                                                                                                      30%
                                                                                                                                                     6.6
          25                       27              27            27                        23-25 20%                 4
 10                                      20              20           20                                                     4.6
                 13                                                                              10%                 2                  4.2
                                                                                                                                                                              3.0-3.3         3.2-3.5
                                                                                                                                                     2.8           2.7
  0                                                                                                      0%          0
              FY15

                                      FY17

                                                    FY18

                                                                  FY19E

                                                                                           FY23F

                                                                                                                             FY15      FY16         FY17        FY18          FY19E           FY20F

                                                                                                                               Domestic gas price                    Contracted LNG Price
                     Regas capacity                     Imports                 Utilization rate                               Spot LNG Price

                                                                                                                2
Fertiliser and CGD sectors to drive gas demand
Gas demand is expected to grow at ~3.5% CAGR between fiscals 2018 and 2023 to 191-193 MMSCMD. The main
push for incremental demand is expected to come from the fertiliser and city gas distribution (CGD) sectors.

The conversion of naphtha-based urea plants, commissioning of new capacities under the New Urea Investment
Policy, and the revival of urea plants are projected to drive gas demand from the fertiliser sector.

Moreover, regulatory push for CGD, including priority allocation of domestic gas for the compressed natural gas
and domestic piped natural gas (PNG) segments, connecting more cities and districts to the gas pipeline
infrastructure, along with a ban of polluting fuels such as fuel oil (FO) and petcoke in Haryana, Rajasthan and Uttar
Pradesh will push demand upward. The industrial PNG segment is expected to see a shift from alternative fuels as
well, because of better competitiveness in comparison with liquefied petroleum gas and the ban of FO in the northern
region. It is expected that the ban on polluting fuels would be extended to other states to combat environmental-
related issues and growing awareness towards it.

On the other hand, demand from the power generation sector is expected to be subdued or only marginally
improve, owing to accessibility and affordability challenges. Poor competitiveness of gas vis-à-vis
coal and renewable sources, along with weak finances of power distribution companies, is expected to limit the
usage of gas by power generators.

CRISIL Research believes reintroduction of regulatory reforms, along with improved domestic gas supply, is
necessary to revive gas demand from the power sector. It is noteworthy that although gas demand by the
power sector increased 3.5% on-year to 32.9 MMSCMD in fiscal 2018, from 31.8 MMSCMD in fiscal
2017 (despite the absence of any government policy support for the sector), this was most likely because of lower
spot prices of LNG.

In a recent development, there has been a push to restart the LNG subsidy scheme to supply gas to stranded gas-
based power plants. Along with the subsidy proposal, gas supply from newly commissioned fields of ONGC
(Vashistha+S1, Daman fields, etc.) would positively impact the sector from fiscal 2020.

Overall gas demand trend
  (MMSCMD)
 250
                              0.34% CAGR                                    3.5-3.8% CAGR
 200

 150

 100                                                                                                   191-193
                159                               162                164

  50

   0
               FY13                              FY18              FY19E                                FY23F

E: Estimated; F: Forecast
Source: PPAC, MoPNG, CRISIL Research

                                                         3
Government initiatives to support domestic gas output
In a bid to increase falling domestic gas output, the government has allowed ‘premium price’ for new gas discoveries
in challenging areas such as high-pressure, high-temperature, deepwater and ultra-deepwater concessions.
However, to ensure end-user affordability, the Centre has put a price ceiling based on alternative fuels. We expect
the introduction of this policy to incentivise exploration and production of gas from challenging areas, which are more
expensive to tap vis-à-vis conventional gas.

The government has also introduced a new hydrocarbon exploration and licensing policy (HELP) for oil and gas
exploration. A key alteration involves a shift to a revenue-sharing model from the current cost-recovery model. It also
provides marketing and pricing freedom for natural gas. This policy is expected to expedite the process of gas
production by simplifying the terms of the product-sharing contract between the producer and the government.

The government has already announced successful bidders for the first round of HELP, which started in May 2018, in
which 55 exploration blocks were offered for auction. As many as 41 blocks were awarded to Vedanta Ltd, nine to
Oil India Ltd, two blocks to Oil and Natural Gas Corporation Ltd (ONGC), and one each to Bharat Petro Resources
Ltd, Gail (India) Ltd and Hindustan Oil Exploration Company Ltd. OALP round- II bidding process has already initiated
in January, 2019. The previous auction round was eight years ago under the New Exploration and Licensing Policy
regime. Moreover, the government had conducted bidding of small and marginal fields under Discovered Small
Fields Round 2016.

Natural gas production to witness a modest improvement from fiscal 2020
CRISIL Research believes domestic natural gas production has bottomed out and will increase at 2.8-3.0% CAGR
between fiscals 2018 and 2023 to 103-105 million metric standard cubic meter per day (MMSCMD).

ONGC is expected to account for a major share of the incremental output, with production set to commence from
several new fields from fiscal 2019 in phased manner. These include marginal fields in the eastern offshore
regions, such as S2AB and G-1, as well as new development projects in the western offshore areas, such as the
Daman (production already started in 2018) and South Bassein fields. In addition, the anticipated commissioning
of fields in Krishna Godavari (KG) D5 block in fiscal 2021 is expected to further support natural gas production.

Reliance Industries Ltd and BP Plc recently announced incremental investment in the KG Basin assets to shore up
domestic natural gas output. However, given the subdued domestic gas prices, progress in these projects
remains a key monitorable.

                                                          4
Domestic gas production trend
  (MMSCMD)
                                     -7.6% CAGR                                              2.8-3.0% CAGR
 150.0
                        130

 120.0                  16
                                                                                                                                          103-105
                                                             88                 90                    90                                   10-12
  90.0                  43                                                                                                                   2
                                                             10                 11                    12                                     9
                                                              9                 6                     4
                         7                                                      8                     8
  60.0                                                        8

                                                                                                                                           80-82
  30.0                  64                                   61                 65                    66

      0.0
                   FY12                                     FY17               FY18           FY19 F                                      FY23F
                              ONGC                          OIL                       RIL KG D6                       Others
F: Forecast
Source: Ministry of Petroleum and Natural Gas (MoPNG), CRISIL Research

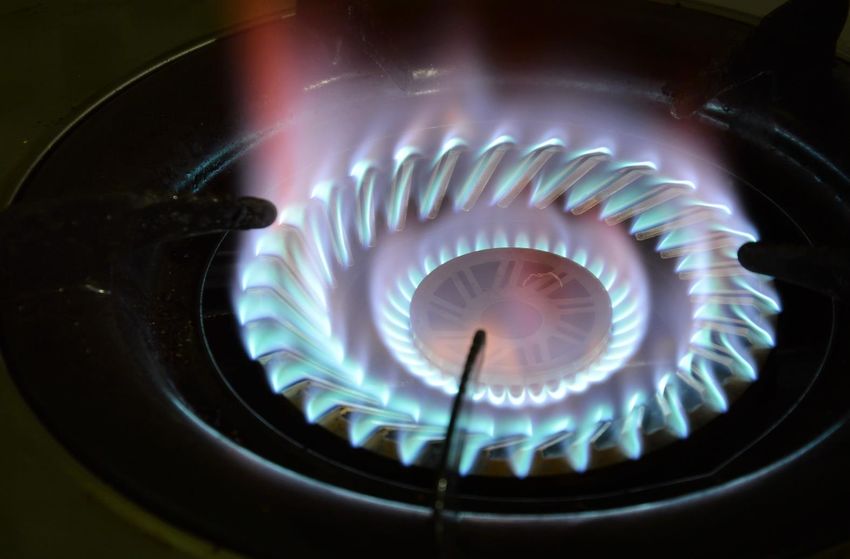
Utilisation of terminals to remain ~50% in the medium term despite rising LNG usage
Given the sustained domestic gas deficit, CRISIL Research expects LNG demand to increase at 4.0-4.3% CAGR
from fiscal 2018 to 2023, to 24.4- 24.7 million tonnes per annum (MTPA). Over the period, installed re-gasification
capacity is forecast to increase to ~50 MTPA from 26.7 MTPA (considering operational terminals only).
Consequently, average utilisation of LNG terminals is set to fall to ~50% in fiscal 2023 from ~77% in fiscal 2018, and
~71% over the previous five year period.

While terminals such as Dahej, which have long-term off-take contracts, will continue to operate at utilisation levels
of ~100%, the utilisation of new greenfield projects is likely to be low, impacting their returns.

Utilisation trend of re-gasification terminals

  (MTPA)                                                                                                                                   (%)
 60                                                                 77%                                                                            90%
                                                 74%                                      77%
                                                                                                                                                   80%
 50
                                                                                                                                                   70%
 40
             53%                                                                                                                                   60%
                                                                                                                              48-50%
                                                                                                                                                   50%
 30
                                                                                                                          48-51                    40%
 20                                                                                                                                                30%
            25                                  27                 27                   27                                            23-25        20%
 10                                                         20                 20                    20
                        13                                                                                                                         10%
  0                                                                                                                                                0%
                 FY15

                                                     FY17

                                                                        FY18

                                                                                             FY19E

                                                                                                                                  FY23F

                               Regas capacity                           Imports                            Utilization rate
E: Estimated; F: Forecast

Source: CRISIL Research

                                                                         5
Domestic gas price to hover at $3.2-3.5 per MMBTU up to fiscal 2020

The price of domestic gas in India is determined as per a pricing formula that takes into consideration the prevailing
natural gas price in international hubs.

From $3.06 per million metric British thermal unit (MMBTU) on gross calorific value basis between April and
September 2018, the government increased the gas price to $3.36 per MMBTU in the latest half-yearly price revision,
i.e. for October 2018 to March 2019, tracking the increase in prices at various global benchmark hubs due to increase
in demand and increase in alternate fuel prices.

In the medium term, gas prices are expected to range from $3.2 to $3.5 per MMBTU as a result of increase in
demand.

Domestic gas price trend
  ($/MMBTU)

 5

              4.6
 4
                                   4.2

 3                                                                                                       3.2-3.5
                                                                                      3.0-3.3
                                                        2.8                   2.7
 2

 1

 0
             FY15                FY16                  FY17                   FY18    FY19E              FY20F

                                                         Domestic gas price

E: Estimated; F: Forecast
Source: Petroleum Planning & Analysis Cell (PPAC), CRISIL Research

Spot LNG prices are projected to increase as well, rising from ~$8 per MMBTU to $8.5-9.0 per MMBTU over the
next two years with increasing LNG demand. Prices would remain at ~$8 per MMBTU in the shoulder months (March-
September) and increase to $10-11 per MMBTU during the peak season (October to February). A further rise will be
truncated because of subdued alternate fuel prices along with demand-supply dynamics. So far, gas demand in
Europe has marginally increased because of increasing penetration of solar and wind energy, and the availability of
cheaper coal.

However, in the medium term, gas demand is expected to increase as developed European nations plans to move
away from coal and nuclear sources.

On the other hand, contracted LNG prices in India are expected to be range bound owing to steady crude oil prices,
which is the key determinant of contracted LNG pricing. Crude oil prices have been under pressure since the mid-
2014 highs. After breaching $86 per barrel in October, 2018, prices have stabilised at ~$60 per barrel. Though there

                                                                     6
are supply-related disruption risks owing to US sanctions on Iran and Venezuela, and unrest in Libya and Nigeria,
we expect crude oil prices to remain range bound with subdued demand growth as a result of slower economic
growth. In 2019, we expect crude oil prices to range $63-68 per barrel.

LNG price trend
  ($/MMBTU)

 16
              13.7
 14

 12                              10.9
                                                                                            9.8-10.3
                                                                                                              9.2-9.7
 10           11.3
                                                                        7.9
                                                       7.0                                  9.3-9.8
  8
                                                                                                              8.5-9.0
                                  7.4                                   8.0
  6
                                                       6.6
  4

  2

  0
              FY15              FY16                FY17               FY18                 FY19E              FY20F
                             Contracted LNG Price                             Spot LNG Price

E: Estimated; F: Forecast
Source: CRISIL Research

Analytical contacts
Rahul Prithiani                          Mayur Patil
Director, Industry Research-Analytical   Associate Director, Industry Research-Analytical
rahul.prithiani@crisil.com               mayur.patil@crisil.com

Media contacts
Saman Khan                               Hiral Jani Vasani                         Parmeshwari Bhumkar
Media Relations                          Media Relations                           Media Relations
CRISIL Limited                           CRISIL Limited                            CRISIL Limited
D: +91 22 3342 3895                      D: +91 22 3342 5916                       D: +91 22 3342 1812
M: +91 95940 60612                       M: +91 982003 9681                        M: +91 841184 3388
B: +91 22 3342 3000                      B: +91 22 3342 3000                       B: +91 22 3342 3000
saman.khan@crisil.com                    hiral.vasani@crisil.com                   parmeshwari.bhumkar@ext-crisil.com

                                                               7
About CRISIL Limited
     CRISIL is a leading, agile and innovative global analytics company driven by its mission of making markets function better.
     It is India’s foremost provider of ratings, data, research, analytics and solutions, with a strong track record of growth, culture of
     innovation and global footprint.
     It has delivered independent opinions, actionable insights, and efficient solutions to over 100,000 customers.
     It is majority owned by S&P Global Inc, a leading provider of transparent and independent ratings, benchmarks, analytics and
     data to the capital and commodity markets worldwide.

     About CRISIL Research
     CRISIL Research is India's largest independent integrated research house. We provide insights, opinion and analysis on the
     Indian economy, industry, capital markets and companies. We also conduct training programs to financial sector professionals on
     a wide array of technical issues. We are India's most credible provider of economy and industry research. Our industry research
     covers 86 sectors and is known for its rich insights and perspectives. Our analysis is supported by inputs from our large network
     sources, including industry experts, industry associations and trade channels. We play a key role in India's fixed income markets.
     We are the largest provider of valuation of fixed income securities to the mutual fund, insurance and banking industries in the
     country. We are also the sole provider of debt and hybrid indices to India's mutual fund and life insurance industries. We pioneered
     independent equity research in India, and are today the country's largest independent equity research house. Our defining trait is
     the ability to convert information and data into expert judgments and forecasts with complete objectivity. We leverage our deep
     understanding of the macro-economy and our extensive sector coverage to provide unique insights on micro-macro and cross-
     sectoral linkages. Our talent pool comprises economists, sector experts, company analysts and information management
     specialists.

     CRISIL Privacy
     CRISIL respects your privacy. We may use your contact information, such as your name, address, and email id to fulfil your request and service
     your account and to provide you with additional information from CRISIL. For further information on CRISIL's privacy policy please visit
     www.crisil.com.

     Disclaimer
     CRISIL Research, a division of CRISIL Limited (CRISIL) has taken due care and caution in preparing this Report based on the information obtained
     by CRISIL from sources which it considers reliable (Data). However, CRISIL does not guarantee the accuracy, adequacy or completeness of the
     Data / Report and is not responsible for any errors or omissions or for the results obtained from the use of Data / Report. This Report is not a
     recommendation to invest / disinvest in any company covered in the Report. CRISIL especially states that it has no financial liability whatsoever
     to the subscribers/ users/ transmitters/ distributors of this Report. CRISIL Research operates independently of, and does not have access to
     information obtained by CRISIL’s Ratings Division / CRISIL Risk and Infrastructure Solutions Limited (CRIS), which may, in their regular
     operations, obtain information of a confidential nature. The views expressed in this Report are that of CRISIL Research and not of CRISIL’s
     Ratings Division / CRIS. No part of this Report may be published / reproduced in any form without CRISIL’s prior written approval

Argentina | China | Hong Kong | India | Poland | Singapore | UK | USA | UAE
CRISIL Limited: CRISIL House, Central Avenue, Hiranandani Business Park, Powai, Mumbai – 400076. India
Phone: + 91 22 3342 3000 | Fax: + 91 22 3342 3001 | www.crisil.com
You can also read