Creche Demand and Needs Assessment - Roselawn Strategic Housing ...
←
→
Page content transcription
If your browser does not render page correctly, please read the page content below
Creche Demand and Needs Assessment
Proposed residential development

At: Granville Hall, Stillorgan Road, Foxrock, DUBLIN 18

(eg. site location)

On behalf of: Granville Hall Partnership

                                                                             March 2019

                                                                                      DATE --------------

Future Analytics Consulting 2_0543_Creche Demand Assessment_Granville Hall
Contents
CONTENTS ....................................................................................................................................................... 2
1. INTRODUCTION ........................................................................................................................................ 3
2. PLANNING POLICY .................................................................................................................................... 4
2.1 CHILDCARE FACILITIES GUIDELINES FOR PLANNING AUTHORITIES 2001 .................................................................. 4
2.2 SUSTAINABLE URBAN HOUSING: DESIGN STANDARDS FOR NEW APARTMENTS GUIDELINES FOR PLANNING AUTHORITIES
(2018) ................................................................................................................................................................ 4
2.3 DUN LAOGHAIRE-RATHDOWN DEVELOPMENT PLAN 2016-2022 ........................................................................... 4
3. APPROACH ............................................................................................................................................... 5
4. DEVELOPMENT NEED ............................................................................................................................... 5
4.1 CATCHMENT AREA........................................................................................................................................ 5
4.2 DEMOGRAPHIC PROFILE ................................................................................................................................. 5
5. EXISTING CHILDCARE PROVISION ............................................................................................................. 6
6. ASSESSMENT OF CHILDCARE INFRASTRUCTURE PROVISION .................................................................... 8
6.1 CURRENT AND POTENTIAL FUTURE PROVISION .................................................................................................. 8
6.2 SUMMARY OF THE WIDER NEEDS OF THE CATCHMENT ........................................................................................ 8
7 CONCLUSION ............................................................................................................................................ 9
APPENDIX 1: DEMOGRAPHIC TRENDS IN CATCHMENT .................................................................................. 11
APPENDIX 2: WIDER HOUSING TRENDS IN DLR .............................................................................................. 14
Future Analytics Consulting 2_0543_Creche Demand Assessment_Granville Hall1. Introduction
The following report has been prepared by Future Analytics Consulting (FAC) in support of the proposal for a
residential unit development comprising 142 units at Granville Hall, Stillorgan Road prepared by Henry J Lyons
architects on behalf of Granville Hall Partnership.
We understand the proposal is for a Built to Rent Scheme (BTR) and includes the following unit mix;
• 73 x 1 bedroom units (51%)
• 68 x 2 bedroom units (48%)
• 1 x 3 bedroom unit (1%)
The following report considers the need for a childcare centre based on the;
• Demographics of the area,
• Characteristics of the population who are likely to rent a home within the scheme, and
• Requirements of the relevant planning policy.
FAC have reviewed the available census data for the Dun Laoghaire-Rathdown Council (DLR) Area and the wider
Dublin area, provided by the Central Statistics Office (CSO). FAC have also considered existing planning approvals
for childcare facilities in the area and the following planning policy in our review of the proposal;
• Section 28 Ministerial Guidelines
• Childcare Facilities Guidelines for Planning Authorities 2001 (the Guidelines)
• Sustainable Urban Housing: Design Standards for New Apartments Guidelines for Planning Authorities
(apartment guidelines)
• Dun Laoghaire-Rathdown Development Plan 2016-2022
The following provides an evidence-based opinion on the development need for a childcare centre within the subject
proposal.
Future Analytics Consulting 2_0543_Creche Demand Assessment_Granville Hall2. Planning Policy
2.1 Childcare Facilities Guidelines for Planning Authorities 2001
The Childcare Facilities Guidelines for Planning Authorities 2001 (the Guidelines) state that one childcare facility
should be provided for new large-scale housing developments unless there are significant reasons to the contrary
for example, development consisting of one bed apartments or where there are adequate childcare facilities in
the area. The Guidelines recommend that for new housing areas, an average of one childcare facility per seventy-
five dwellings would be appropriate. The threshold for provision should be established having regard to the
existing geographical distribution of childcare facilities and the emerging demographic profile of areas.
2.2 Sustainable Urban Housing: Design Standards for New
Apartments Guidelines for Planning Authorities (2018)
The recently revised Sustainable Urban Housing: Design Standards for New Apartments Guidelines for Planning
Authorities (2018) also requires that childcare facilities be provided in accordance with the demographic profile
of the area and the existing capacity of childcare centres. The guidelines also specifically state;
‘One-bedroom or studio type units should not generally be considered to contribute to a requirement for
any childcare provision and subject to location, this may also apply in part or whole, to units with two
or more bedrooms’ (our emphasis)
73 of the proposed units (51%) will comprise one bedroom apartments. These units, in accordance with the
guidelines, will not generate the need for a childcare facility.
Accordingly, 68 two bedroom units and 1 three bedroom unit (which we note is below the 75 unit threshold
which triggers a childcare facility) are to be provided and considered in the context of generated requirements
for an additional childcare facility, including local area characteristics.
2.3 Dun Laoghaire-Rathdown Development Plan 2016 -2022
Dun Laoghaire-Rathdown Development Plan 2016-2022 (the Plan) provides the overarching planning policy that
applies to the area. Policy SIC11 of the Plan requires the provision of childcare facilities in new large scale
residential developments as appropriate. The indicative standard is one childcare facility accommodating twenty
children, for each 75 dwellings. This standard may be modified in any particular case where there are significant
reasons for doing so.
Section 8.2.12.1 of the Plan further clarifies that this standard may be enforced depending on local circumstances
but that the Planning Authority will consult with the Dún Laoghaire-Rathdown County Childcare Committee in
this regard.
In accordance with the requirements of DLR Council, a childcare facility audit and assessment has been
undertaken to ascertain the need and demand for a crèche facility in conjunction with the provision of 142 units
on the subject site. (Noting that 51% (73) of these units are one bed and therefore excluded in the parameters
of the guidance).
Future Analytics Consulting 2_0543_Creche Demand Assessment_Granville Hall3. Approach
Having due regard to the planning policy above, we must also consider the legacy of the economic crash which
illustrates that a defined need should be established and critical mass before a childcare facility can be successful.
Purpose-built crèche facilities provided in accordance with the policy requirements, can remain vacant and
unoccupied when space is not taken up by a childcare provider. This can be attributed to several factors
including; the adequacy and profile of existing childcare facilities within the immediate area, or simply
inadequate demand as a result of the development needs. The resultant effect can manifest into unused
commercial property or floor space within a residential development which over time and without maintenance,
can physically deteriorate reducing the visual amenity of the development for the residents and result in an
uneconomic use of land.
Therefore, this childcare assessment has been undertaken in accordance with the following three steps;
1. Determining the need arising from the development proposal;
2. Determining the extent and provision of existing childcare facilities within the neighbourhood; and
3. Analysing the characteristics of the demographics of the population who currently rent in the area.
4. Development Need
4.1 Catchment Area
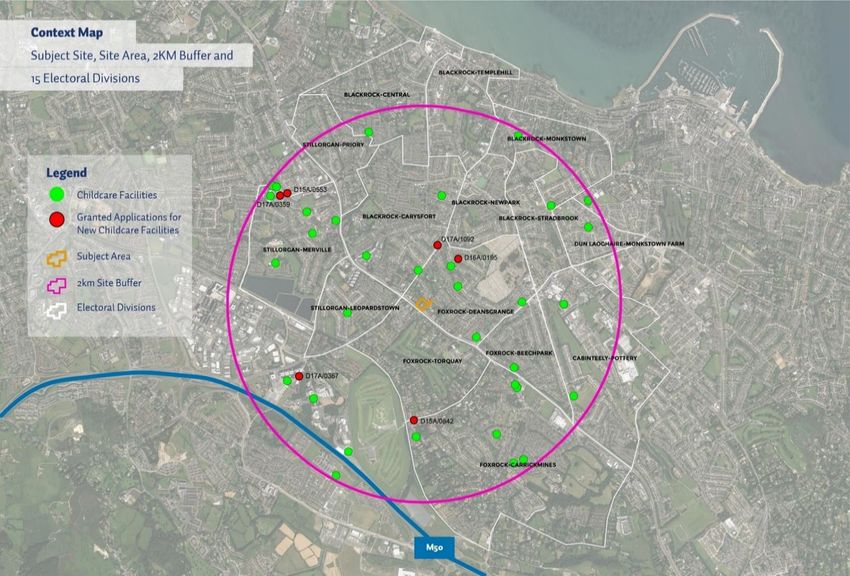
The catchment area for the study is defined as the area within 2km of the subject site boundary (see Figure 1 –
Context Map). Precise population figures from the Central Statistics Office called Small Area Population Statistics
(SAPS) data have been used for both 2011 and 2016. Specifically, the assessment uses Electoral Divisions data
for a more disaggregated view of local populations. The 2km buffer of the site boundary intersects 15 different
Electoral Division areas (ED) (note that certain ED areas were removed, where less than 30% of the ED area was
within the 2km buffer area – see Figure 1). The total population for this catchment area is 47,598 in 2016 up
3.1% from 2011 or 1,430 persons.
4.2 Demographic Profile
In accordance with census data for the area, 60% of all privately rented properties in DLR Council have no
children (See Appendix 2). Applying this to the proposal, 41 out of the 69 two and three bedroom dwellings will
not accommodate children. This leaves 28 two bedroom and 1 three bedroom dwelling where children are likely
to be accommodated.
Further analysing this figure, Census 2016 data shows that 35.5% of privately rented households are by single
persons and a further 24.5% of renters are married or a cohabiting couple with no children. The proposed scheme
is solely a BTR development and therefore it is reasonable to assume that these figures will apply to the proposal.
We also note that, 25% of the population who are renting in the area are under 29 years of age and less likely to
have children according to recent census data. This demonstrates that the characteristics of the population who
are most likely to rent accommodation in the proposed scheme will not have children.
The proposed development comprises 142 units with 73 of those units being one bedroom only. Accordingly, 69
units are considered in relation to the requirements for an additional childcare facility.
Utilising an average household size of 2.73 persons per unit, in accordance with standardised Census of
Population data for DLR Council, 69 houses will yield a population of 188 persons. Through further analysis of
2016 Census data, it has been determined that, in the catchment, the average household contains 1.64 1 children
(persons aged 19 and under) of which 24% are children aged between 0-4 years old. In accordance with current
1
Calculated weighted average of households by number children born for the 15 catchment EDs using Census 2016 SAPS.
Future Analytics Consulting 2_0543_Creche Demand Assessment_Granville Hallrates of population, the proposed development would yield 113 children (69 units x 1.64) of which 27 would be
between 0 and 4 years of age, that is within the crèche requirement age.
The Quarterly National Household Survey, Childcare, Quarter 3 2016’ reports 2 that only 25% of pre-school
children in Dublin attend a childcare facility. This figure is entirely relevant to the subject proposal. When this
ratio is applied, to the development, only 7 childcare spaces would be required.
Variables Value
Potential Children in Development 113
Children Aged 0-4 24%
Max Need 27
QNHS Assumed Take-up Rate 25%
Min Need 7
For the purpose of this exercise it is intended to assume a worst-case scenario and assume that all children within
crèche going age group would require childcare. As a precaution, we have therefore also reviewed the existing
TUSLA listings for the area.
5. Existing Childcare Provision
In addition to the above analysis, it was deemed appropriate to audit existing childcare provision within a 2km
catchment of the subject site, equitable to a 22-minute walk time. There are additional childcare facilities beyond
the 2km catchment but these have not been included in this assessment. The 2km study catchment is considered
to reflect, a typical 22-minute walk time based on an average walking speed within an urban environment. The
spatial extent of this study area is clearly illustrated in the map overleaf.
TUSLA provides independent data on childcare facilities generated from their inspections of childcare facilities.
The inspections are undertaken yearly and updated accordingly. The subject figures are taken from the 2017 –
2018 reports. These inspections are undertaken by TUSLA to ensure that the childcare facilities are compliant
with legislative requirements. From a planning perspective, this information provides standardised and
comparative data inclusive of;
• Childcare capacity,
• Number of children registered, and,
• Childcare take up (on day of inspection).
A table of childcare facilities located within the 15 EDs in the study area alongside the attendance figures can be
found below:
Table 1 Existing Tulsa Registered Childcare Facilities
Tusla Ref. Facility Name Attendance
TU2015DR089 Cocco's Creche & Montessori 34
TU2015DR061 St. Brigid's Parish Playschool 25
TU2015DR066 Wee Care Ltd. 143
TU2017DR500 The Playroom Stillorgan 3
TU2015DR049 Stepping Stones Playschool 12
TU2015DR163 Lycee Fracais D'Irelande No Data
TU2015DR060 Guardian Angels Montessori School 14
TU2015DR129 Mountainside Montessori 22
TU2016DR023 The Children's House Montessori Primary School 40
2
https://www.cso.ie/en/releasesandpublications/er/q-chi/qnhschildcarequarter32016/
Future Analytics Consulting 2_0543_Creche Demand Assessment_Granville HallTU2015DR082 Monkstown Day Nursery Community Playgroup Ltd. 17
TU2015DR116 FitZone Montessori and Creche Leopardstown 23
TU2016DR020 Wendy Kelly -Childminder No Data
TU2015DR034 Glenalbyn Montessori School 18
TU2016DR015 Lily Montessori 16
TU2016DR013 Foxrock Montessori School 26
TU2015DR080 Giraffe Childcare Leopardstown 60
TU2015DR025 Greenfields Montessori 19
TU2015DR154 Giraffe Childcare Central Park 55
TU2015DR070 Constructive Pre-Preschool 13
TU2015DR104 Beechwood Childcare 55
TU2016DR024 Childminding by Agata Siejko No Data
TU2017DR501 Cocobee Childcare 15
TU2016DR005 Miss Judi's IMEB Montessori No Data
TU2015DR047 Simbas Playgroup & Montessori 35
TU2015DR064 Hollypark Montessori 24
TU2016DR022 Libby McGuire Montessori School 19
TU2015DR158 Little Gems Montessori & Childcare 7
TU2015DR138 Raglan Child Care Centre 10
TU2015DR039 Leopardstown Montessori School 29
TU2015DR122 Star Tots Creche 89
TU2016DR009 Wise Little Owls Montessori 16
Total 839
Future Analytics Consulting 2_0543_Creche Demand Assessment_Granville Hall6 Assessment of Childcare Infrastructure Provision
6.1 Current and Potential Future Provision
A total of 32 (TUSLA registered) childcare facilities currently operate within a 22-minute walking distance of the
site (listed in Table 1) offering a minimum of 839 places. A further 6 crèche facilities with a potential capacity for
1623 children have been granted planning permission within the catchment area. The locations of each of these
has been provided on the map above and itemised in Table 2 below. The applications relate to extensions to
existing creches and proposals for new creches and are not associated with other large-scale housing
developments.
Table 2 Planned Future Childcare Provision
Planning Ref Description Status Decision Date
D17A/0367 Extension to Creche Commenced 12/06/2017
D17A/0359 Change of Use to Creche Commenced 12/06/2017
D15A/0553 Change of Use - Childcare Facility Plans Granted 20/01/2016
D17A/1092 Change of Use to Creche Plans Granted 12/02/2018
D15A/0842 Change of Use to Childcare Facility Plans Granted 23/02/2016
D16A/0195 Extension to Creche Plans Granted 17/05/2016
6.2 Summary of the W ider Needs of the Catchment
Existing Demand: Using the recommended 25% of a resident population aged 0-4 taking-up childcare, there is a
demand for 688 places in the study area. Our review of the TUSLA listings in Table 1 demonstrates that there are
839 spaces available in the area. Therefore, there is sufficient current capacity for the resident population within
the catchment. The 7 spaces which will be generated by the subject proposal can be absorbed by the existing
childcare facilities.
2016
Population Aged 0-4 2,750
QNHS Take-up Rate 25%
Minimum Need 688
3
Although not specifically stated in the planning applications, the additional capacity of these developments would likely be in the region
of 162 places. This quantum of spaces is derived by taking the average enrolments across the 31 current facilities in the catchment (of 31
enrolments per facility) and assumes a similar capacity for new offerings.
Future Analytics Consulting 2_0543_Creche Demand Assessment_Granville Hall7 Conclusion
FAC have conducted a creche demand analysis and assessed the likely demand generated for a childcare facility
(creche) as a result of the proposed Build-to-Rent (BTR) scheme. The scheme comprises 142 units including;
• 73 x 1 bedroom units,
• 68 x 2 bedroom units, and
• 1 x 3 bedroom units.
The development need for a creche has been considered in the context of;
• The composition of the proposed development including unit mix and form,
• The demographics of the surrounding area, and
• The existing childcare capacity of the area.
Our review has concluded that the proposal does not generate a need for a childcare facility as follows;
1. Unit Mix
• 68 two bedroom units and 1 three bedroom unit are proposed which does not meet the threshold
criteria of the guidelines (75 units) which require construction of a childcare facility. The guidelines state
that; ‘one-bedroom or studio type units should not generally be considered to contribute to a
requirement for any childcare provision’.
2. Demographics
Notwithstanding the above, the demographics of the area and the characteristics of current renters in the area
demonstrate that the future occupants of the BTR scheme will not warrant the construction of a purpose-built
childcare facility as follows;
• Census data (2011 and 2016) show that 60% of privately rented households within DLR Council area do not
have children. Applying this to the proposed development, this would mean that 41 of the 69 two and three
bedroom dwellings would not include children,
• 24.5% of current renters within DLR Council are married or cohabiting couple with no children. 35.5% of
privately rented households are by single persons. These figures indicate that the future occupants of the
proposed BTR scheme are not likely to include children.
• The Quarterly National Household Survey, Childcare, Quarter 3 2016’ reports that only 25% of pre-school
children in Dublin attend a childcare facility. When applied to the subject development, only 7 childcare
spaces would be required. This does not warrant the construction of a purpose-built facility.
3. Planning Review
Our review of planning approvals in the area has also demonstrated that capacity is emerging in the sector as
follows;
• Planning permission has been approved in the area for four additional childcare facilities and two extensions
to existing childcare facilities. These approvals are not associated with large-scale housing developments
and will provide additional spaces in the area on completion.
On this basis, it is considered that there will be sufficient childcare capacity and availability within the local
catchment area to accommodate the likely childcare going age generated by the proposed development, being
Future Analytics Consulting 2_0543_Creche Demand Assessment_Granville Hallonly 7 children. It is not feasible or practical to provide a purpose built childcare facility for this number of children onsite. Therefore, in our opinion, due to the proposed unit mix and the proximity and availability of existing childcare facilities to the proposed development, there is no need or requirement for the provision of additional childcare spaces as part of this development proposal. Future Analytics Consulting 2_0543_Creche Demand Assessment_Granville Hall
Appendix 1: Demographic trends in Catchment
The catchment area for the study is defined as the area within 2km of the Subject Site boundary. Precise
population figures from the Central Statistics Office called Small Area Population Statistics (SAPS) data have been
used for both 2011 and 2016. Specifically, the assessment uses Electoral Divisions data for a more disaggregated
view of local populations. The 2km buffer of the site boundary intersects 15 different Electoral Division areas
(ED) (note that certain ED areas we removed where less than 30% of its area was included with the buffer area).
The total population for this catchment area is 47,598 in 2016 up 3.1% from 2011 or 1,430 persons.

The subject site is located in the Foxrock-Deans Grange ED (CSO Area Code ED: 05055), which has a population
of 2,448 people in the Census 2016. The ED has experienced population growth of 0.6% over the past 5 years
since 2011. Just 6 of the ED in the study area grew at a rate over 1% per annum, while 4 EDs actually experienced
a decline in population over the period. Stillorgan-Leopardstown and Stillorgan-Merville were the 2 EDs which
experienced the strongest growth at 11.7% and 17.2% respectively.

The catchment is in a low-density suburb and with very little greenfield sites for future residential development.
As a result, the capacity of the catchment to expand in population is not as strong as in other locations around
Dublin.

Table 3 –Population Change for Catchment ED’s

    ED Name                        2011         2016          Change          Percentage
                                                              2011-16         change
    Blackrock-Carysfort              6,160        6,318                158             2.6%
    Blackrock-Central                3,841        3,733               -108            -2.8%
    Blackrock-Monkstown              3,073        3,239                166             5.4%
    Blackrock-Newpark                2,164        2,316                152             7.0%
    Blackrock-Stradbrook             2,299        2,462                163             7.1%
    Blackrock-Templehill             2,687        2,658                 -29           -1.1%
    Cabinteely-Pottery               4,833        4,997                164             3.4%
    Dún          Laoghaire-
                                                                       130             6.2%
    Monkstown Farm                   2,095        2,225
    Foxrock-Beechpark                1,653        1,680                 27             1.6%
    Foxrock-Carrickmines             6,088        5,951               -137            -2.3%
    Foxrock-Deans Grange             2,434        2,448                 14             0.6%
    Foxrock-Torquay                  1,439        1,445                   6            0.4%
    Stillorgan-Leopardstown          2,429        2,714                285            11.7%
    Stillorgan-Merville              2,744        3,217                473            17.2%
    Stillorgan-Priory                2,229        2,195                 -34           -1.5%
    Total                            46,168       47,598             1,430             3.1%

Discounting the population gain from future residential development within the catchment, this study focuses
on the existing population and the natural increases that will occur over the next 10-year horizon within the 15
catchment EDs. The catchment population is expected to rise by at least 7,536 persons over the next decade
(+15.8%). Comparing this growth to the national projected average growth from the CSO 4 (which is estimated to
be just under 12% over the same period (2016-2026)).

4
    www.cso.ie/en/media/csoie/releasespublications/documents/population/2013/poplabfor2016_2046.pdf

Future Analytics Consulting     2_0543_Creche Demand Assessment_Granville Hall
Table 4 – Population Projection for Catchment ED’s
ED Name 2016 2026 Change Percentage
2016-26 change
Blackrock-Carysfort 6,318 7,436 1,118 17.7%
Blackrock-Central 3,733 4,451 718 19.2%
Blackrock-Monkstown 3,239 3,730 491 15.2%
Blackrock-Newpark 2,316 2,498 182 7.9%
Blackrock-Stradbrook 2,462 2,795 333 13.5%
Blackrock-Templehill 2,658 3,172 514 19.3%
Cabinteely-Pottery 4,997 5,715 718 14.4%
Dún Laoghaire-Monkstown
2,225 2,602 377 16.9%
Farm
Foxrock-Beechpark 1,680 1,808 128 7.6%
Foxrock-Carrickmines 5,951 6,857 906 15.2%
Foxrock-Deans Grange 2,448 2,725 277 11.3%
Foxrock-Torquay 1,445 1,685 240 16.6%
Stillorgan-Leopardstown 2,714 3,264 550 20.3%
Stillorgan-Merville 3,217 3,789 572 17.8%
Stillorgan-Priory 2,195 2,606 411 18.7%
Total 47,598 55,134 7,536 15.8%
Age Profile
The second demographic factor relevant to childcare infrastructure provision is age profile. Ensuring that there
is an adequate provision of the right type of community infrastructure based on need should be a direct
determinant of what infrastructure is required and where. The current age profile for 2016 (below) shows
relatively lower concentrations of younger age cohorts with just 17.8% of the current population under the age
of 15 compared with 21.1% Nationally.
Table 5 – Population by Age in 2016 for Catchment ED’s
Age Group Population 2016 % of Total
0-4 2,750 5.8%
5- 9 2,945 6.2%
10-14 2,788 5.9%
15-19 2,978 6.3%
20-24 3,337 7.0%
25-29 2,823 5.9%
30-34 2,939 6.2%
35-39 3,233 6.8%
40-44 3,150 6.6%
45-49 3,265 6.9%
50-54 3,412 7.2%
55-59 3,094 6.5%
60-64 2,582 5.4%
65+ 8,302 17.4%
Total 47,598
Future Analytics Consulting 2_0543_Creche Demand Assessment_Granville HallThis population breakdown will shift over the next 10 years but is likely to maintain sizable concentrations of
young persons under the age of 5. Similarly, we are seeing larger numbers of persons entering the age brackets
65+ with a net increase of further 1,300 persons over the next decade.
Table 4 – Population Projection by Age in 2026 for Catchment ED’s
Age Group Population 2026 % of Total
0-4 3,402 6.2%
5- 9 2,935 5.3%
10-14 2,881 5.2%
15-19 3,117 5.7%
20-24 3,655 6.6%
25-29 4,617 8.4%
30-34 4,655 8.4%
35-39 3,579 6.5%
40-44 3,355 6.1%
45-49 3,434 6.2%
50-54 3,234 5.9%
55-59 3,279 5.9%
60-64 3,353 6.1%
65+ 9,639 17.5%
Total 55,134
Modelling this change using the Demographic Component Model methodology from the Central Statistics office 5
highlights a number of key points:
• The population of the catchment area is set to grow by just under 16% over the period 2016 - 2026.
Given the area’s existing high population, this will result in a sizable cohort of 3,402 people aged 0-4
years old. This represents a 23.7% increase in population aged 0-4 over the period.
• The dependency ratio in the catchment is set to rise only marginally over the next 10 years.
• There is a continued need to provide suitable childcare facilities, and infrastructure for young people
where 16.7% of the population is under the age of 15.
The projection does not account for the zoned land and development capacity for new residential developments
that in the area.
5
FAC’s projection of population is underpinned by the application of the demographic cohort component methodology (CCM); the same
methodology as used by the Central Statistics Office in preparing the national projections. CCM is widely used internationally as a best-in-
class methodology. It provides a flexible and powerful approach to population projection by using varying comparative scenarios, each
tailored around the application of qualified assumptions in mortality, fertility and migration (as aligned with the Central Statistics Office’s
assessments).
Future Analytics Consulting 2_0543_Creche Demand Assessment_Granville HallAppendix 2: Wider Housing Trends in DLR
Summary Findings:
• 78,601 Private Households in DLRCOCO
• 15,907 households in DLRCOCO privately rent
• 20.2% of all households in DLRCOCO are renting privately
• 35.5% of Privately Rented Households are by Single Persons
• A further 24.5% of renters are married or cohabiting couple with no children
• 60% of all privately rented properties in DLRCOCO have no children
All types of Rented from % Rented from
Dún Laoghaire-Rathdown
occupancy private landlord private landlord
All private households 78,601 15,907 20.2%
All persons in private households 213,468 43,592 20.4%
One person 17,576 2,512 14.3%
Married couple 13,082 1,395 10.7%
Cohabiting couple 3,618 2,081 57.5%
Married couple with children 24,867 3,898 15.7%
Cohabiting couple with children 1,997 723 36.2%
One parent mother with children 5,716 934 16.3%
One parent father with children 933 158 16.9%
Married couple with other persons 674 143 21.2%
Cohabiting couple with other persons 425 274 64.5%
Married couple with children and other
1,468 313 21.3%
persons
Cohabiting couple with children and other
178 59 33.1%
persons
One parent mother with children and other
794 136 17.1%
persons
One parent father with children and other
135 26 19.3%
persons
Two or more family units with or without
997 118 11.8%
other persons
Non-family households containing related
1,759 512 29.1%
persons
Households comprised of unrelated persons
4,382 2,625 59.9%
only
Renters by Age
All types of occupancy Rented from private landlord %
Under 25 years 2,030 1,429 9.0%
25 - 29 years 3,452 2,460 15.5%
30 - 34 years 6,495 3,520 22.1%
35 - 39 years 8,120 3,175 20.0%
40 - 44 years 7,828 1,987 12.5%
45 - 49 years 7,518 1,241 7.8%
50 - 54 years 7,832 788 5.0%
55 - 59 years 7,285 486 3.1%
60 - 64 years 6,556 310 1.9%
Future Analytics Consulting 2_0543_Creche Demand Assessment_Granville Hall65 years and over 21,452 510 3.2%
All ages 78,568 15,906
46.6% of renters are under 35 years of age and just 21% are above the age of 44.
Accommodation Type
77.3% 21.9% 0.8%
0% 10% 20% 30% 40% 50% 60% 70% 80% 90% 100%
Family Houses Apartment Living Other
Renting by Age of Stock
All types of occupancy Rented from private landlord % Rented from private landlord
Before 1919 4,835 912 18.9%
1919 to 1945 4,932 409 8.3%
1946 to 1960 10,735 675 6.3%
1961 to 1970 10,925 734 6.7%
1971 to 1980 10,850 1,120 10.3%
1981 to 1990 8,763 1,533 17.5%
1991 to 2000 8,107 2,086 25.7%
2001 to 2010 13,064 5,472 41.9%
2011 or later 1,838 847 46.1%
Not stated 4,519 2,118 46.9%
In DLR, the preference to privately rent newer stock is apparent. This is partially to do with the change in stock
type to higher concentrations of apartment type dwellings over single family dwellings over the past 2 decades.
Future Analytics Consulting 2_0543_Creche Demand Assessment_Granville HallYou can also read