Australia - Country profile - Agrobiodiversity Index
←
→
Page content transcription
If your browser does not render page correctly, please read the page content below
Australia – Country profile
Agrobiodiversity Index Report 2019 – Risk and Resilience
Context forage plant, the most well-known species of which
is alfalfa) at the Australian Medicago Genetic
Resource Centre and 15% of the world’s clover
holdings at the Western Australian Department of
Agriculture.ii
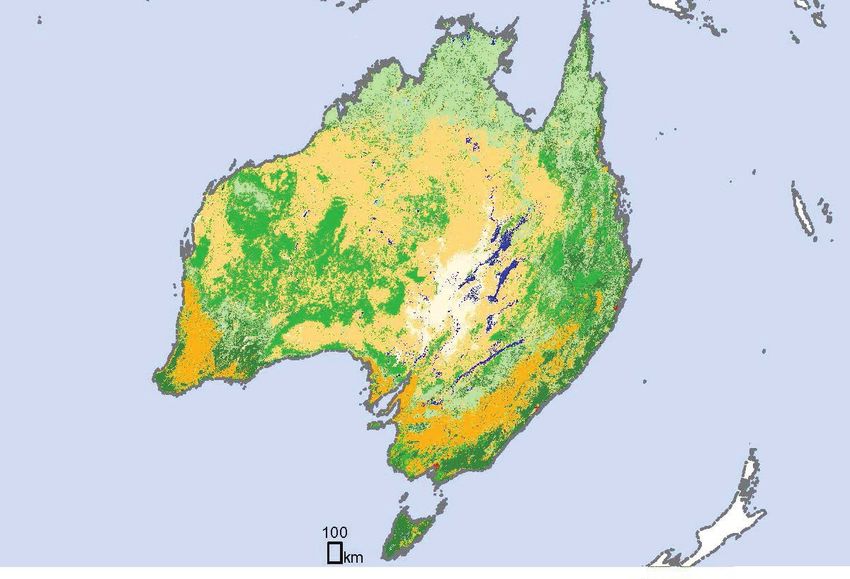
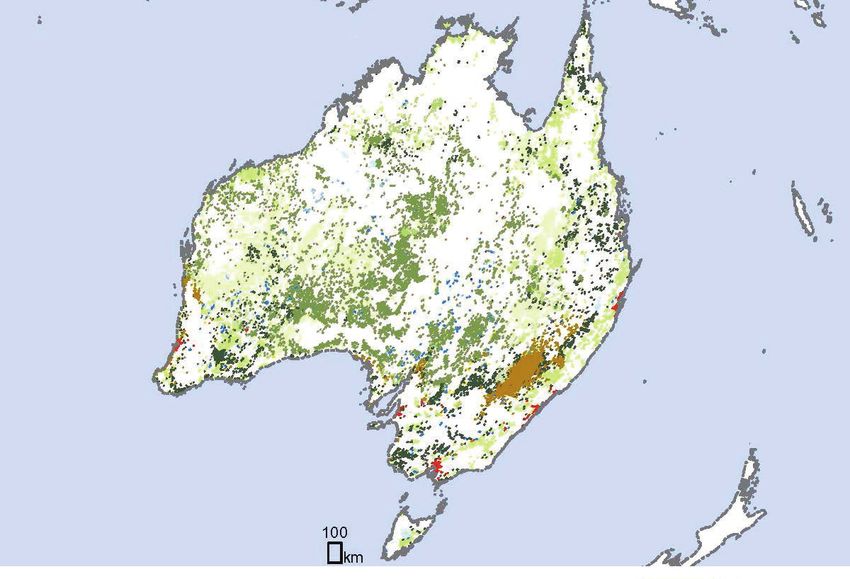
• Covering 48% of the country’s land (Figure • Among adults, the mortality rate attributable
1A), agriculture contributes 3% to Australia’s to inadequate diets is relatively low at 143 per
total gross domestic product. Together with the 100,000 people.iii No national level data are found
related supply chains, agriculture provides a job on minimum diet diversity of children nor child
to over 1.6 million people. Approximately 86,000 malnutrition status.iv
farm businesses in Australia provide 93% of the
• Land use change, habitat fragmentation and
country’s daily domestic food supply.i In addition,
degradation (Figure 1B) are prevalent in many
Australian farmers export about 77% of what they
areas, and invasive species, particularly feral
grow and produce. The livestock export industry
animals, are increasing the pressure they exert
is an important part of the Australian agricultural
on local biodiversity. Impacts of climate change
sector and vital to the country’s international
are increasing. Agricultural techniques involving
competitiveness. Australia is also a major grain
intensive use of fertilizers, pesticides and large
producer and exporter. Wheat, barley, canola
machinery put additional pressure on local
(rapeseed), oats and lupin produced in the country
ecosystems, further reducing biodiversity.v For
are exported across the world for a variety of food
example, the Great Barrier Reef off the coast of
and livestock feed purposes.
Australia is seriously affected by nutrient and
• In Australia, over 220,000 plant accessions are stored pesticide runoff from sugar cane farming and other
in ex situ genebanks. Australia is the predominant types of agriculture.vi
holder of forage legume germplasm, with 30%
of the world holdings of Medicago (a leguminous
FIGURE 1 – Major land use (A) and changes in major land use (B)
A B
Land cover – IPCC categories (2015) Land cover change 1992–2015
Agriculture Gain Loss
Bare areas Agricultural
Forest Forest
Grassland Grassland
Ice and snow Shrubland
Shrubland Wetland
Sparse vegetation Urban
Urban Water
Water
Wetland
Source: Adapted from: A) European Space Agency, 2017;vii B) Nowosad, et al., 2019.viii
Australia – Country profile

Agrobiodiversity                                                also scores low for production practices that support
                                                                agrobiodiversity, such as agroforestry,  integration
                                                                of crop–livestock systems and limited overuse of

Index results                                               •
                                                                pesticides and fertilizers.
                                                                For status, Australia outperforms the 10-country
                                                                average. Australia’s high score on diversity in
                                                                markets and consumption for healthier diets stands
                                                                out, while agrobiodiversity in production is below
•   Australia scores medium-high for status of
                                                                average. However, Australia underperforms on
    agrobiodiversity (Figure 2A). The availability
                                                                the progress score compared to the 10-country
    of genetic resources for future options and
                                                                average. This highlights the risk of losing
    agrobiodiversity in markets and consumption for
                                                                agrobiodiversity and its benefits in the future and
    healthy diets contribute most strongly to this score,
                                                                calls for more explicit commitment and actions
    but the level of agrobiodiversity in production is
                                                                towards sustainable use and conservation of
    much lower. This indicates that agrobiodiversity is
                                                                agrobiodiversity for current and future options.
    highly available in genetic resource management
    and in markets and consumption, but that
    agricultural production systems are not very
    diversified.
•   The progress score (Figure 2B) shows that
    agrobiodiversity related commitment and actions in
    place are rather weak. Mentions of agrobiodiversity
    for healthy diets, sustainable production or future
    options, and specific strategies and targets are
    mostly missing in the sources analyzed. Australia

FIGURE 2 – Overview of Agrobiodiversity Index scores for Australia

                            (A) Status score                                  (B) Progress score

                                59%                                                 23%

             Agrobiodiversity for healthy diets                   Actions on agrobiodiversity for healthy diets
             Agrobiodiversity for sustainable agriculture         Actions on agrobiodiversity for sustainable agriculture
             Agrobiodiversity for future options                  Actions on agrobiodiversity for future options
                                                                  Commitment on agrobiodiversity for healthy diets
                                                                  Commitment on agrobiodiversity for sustainable agriculture
                                                                  Commitment on agrobiodiversity for future options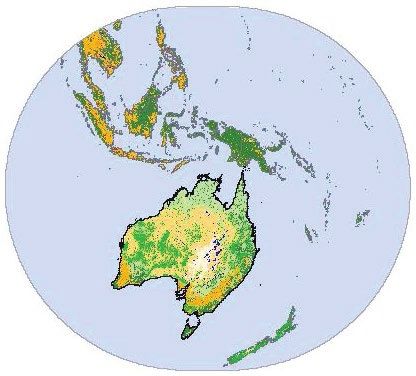
Agrobiodiversity Index Report 2019 – Risk and Resilience

TABLE 1 – Overview of the Agrobiodiversity Indicator scores per pillar for Australia

                                                                           Pillar 1               Pillar 2                Pillar 3

                                                                           Agrobiodiversity       Agrobiodiversity        Agrobiodiversity
                                                                           in markets and         in production           in genetic
                                                                           consumption for        for sustainable         resource
                                                                           healthy diets          agriculture             management for
                                                                                                                          future options
 Commitment Level of commitment to enhancing consumption
            and markets of agrobiodiversity for healthy diets                         22

                   Level of commitment to enhancing production and
                   maintenance of agrobiodiversity for sustainable                                           14
                   agriculture
                   Level of commitment to enhancing genetic resource
                   management of agrobiodiversity for current and future                                                             17
                   use options
 Actions           Consumption and market management practices
                   supporting agrobiodiversity                                        25

                   Production practices favouring agrobiodiversity
                                                                                                             29

                   Production diversity-based practices
                                                                                                             13

                   Genetic resource management practices
                   supporting agrobiodiversity                                                                                       41

 Status            Species diversity
                                                                                      86                     24                      98

                   Varietal diversity
                                                                                                                                     98

                   Functional diversity
                                                                                      48

                   Underutilized/local species
                                                                                      75                                             24

                   Soil biodiversity
                                                                                                             30

                   Pollinator biodiversity

                   Landscape complexity
                                                                                                             46

Note: All scores are scaled from 0–100. The colour scheme was changed on 1 August 2019 to reflect more accurately the scores
Australia – Country profile

Leading practices                                               •   Agricultural production practices: Australia
                                                                    scores low for agrobiodiversity in production for
                                                                    sustainable agriculture, for both status and progress.
                                                                    Species diversity in production is below average,
                                                                    the soil biodiversity index is low, and only 46% of
•   Diversity in supply: About 75% of dietary calories              agricultural land includes natural or semi-natural
    come from non-staples, and species diversity in                 vegetation. Apart from conservation agriculture
    national food supply is high compared to other                  practices, actions and commitment to increase
    countries. The disability-adjusted life years                   agrobiodiversity in production are weak. Only 5% of
    attributed to inadequate diets is medium-low at 2,087           agricultural land includes agroforestry, and only 21%
    per 100,000 population, reflecting a general high diet          includes integrated crop–livestock systems. Nitrogen
    diversity but still too low in vegetables, fruits, whole        use efficiency (the ratio between the amount of
    grains, nuts and seeds, and too high in processed               fertilizer removed from the field by the crop and the
    meat, red meat and salt.ix                                      amount of fertilizer applied, which is considered
                                                                    a proxy for avoided overuse of fertilizer) is at 0.75,
•   Conservation agriculture: Conservation agriculture              above the 10-country average, but it can be further
    is practised on about 37% of Australia’s agricultural           improved to avoid harmful effects on Australia’s
    land. Implementation of conservation agriculture is             vulnerable ecosystems.
    based on locally developed sets of practices involving
    integrated management of crops, soil, nutrients,            •   Children’s diet diversity data: The country is
    water, pests, labour and energy, to enhance and                 encouraged to make available data on children’s diet
    sustain an optimal environment.                                 diversity.

•   International reporting on agrobiodiversity:
    Australia systematically reports on 80% of indicators
    to the World Information and Early Warning System
    (WIEWS) on Plant Genetic Resources for Food and             Notable findings
    Agriculture.
•   Integrated ex situ and in situ conservation:
    Australia combines a high diversity in ex situ
    collections (223,137 accessions are reported in             •   Healthy diets: Australia performs higher than other
    WIEWS) with a large diversity of crop wild relatives            countries in agrobiodiversity for healthy diets. This
    and a many useful wild plants (49%) conserved in                is explained by high species diversity in domestic
    situ. Combining ex situ and in situ conservation is             supply, and a high number of calories from non-
    the most comprehensive way to achieve successful                staples. However, 71% of men and 58% of women
    conservation, but this tends to be rare in practice.x, xi       are overweight,xii and dietary intake of vegetables,
    For example, only 0.2% of the 49% useful wild plants            fruits, whole grains, nuts and seeds is still low, while
    that are conserved in situ are stored ex situ in the            intake of processed meat, red meat and salt is high.
    country. This suggest that Australia can further                While agrobiodiversity seems present in markets
    strengthen its actions to combine ex situ and in situ           and domestic supply, it is not known if and how the
    conservation.                                                   products are consumed, and current diets may be
                                                                    contributing to high rates of overweight.
                                                                •   Sustainable production: Australia scores

Areas for
                                                                    low on agrobiodiversity in production for
                                                                    sustainable agriculture. While the country has
                                                                    clear commitments for sustainable agricultural

improvement
                                                                    production, agrobiodiversity seems not to be part
                                                                    of this agenda yet. Improving agrobiodiversity
                                                                    management in production systems, for example
                                                                    through more agroforestry, natural vegetation, crop
                                                                    species and crop–livestock integration, offers a
                                                                    major opportunity for more sustainable and resilient
•   Commitment to sustainable use and conservation
                                                                    agriculture in the country.
    of agrobiodiversity: Specific commitments
    to managing agrobiodiversity for sustainable                •   Genetic resources: Australia performs relatively well
    agriculture, healthy diets and future use options               on both ex situ and in situ indicators of conservation.
    are not explicit and can be strengthened through                The country can improve this by adopting a
    strategies and target setting related to sustainable            comprehensive approach to conservation, combining
    use and conservation of agrobiodiversity.                       in situ and ex situ conservation.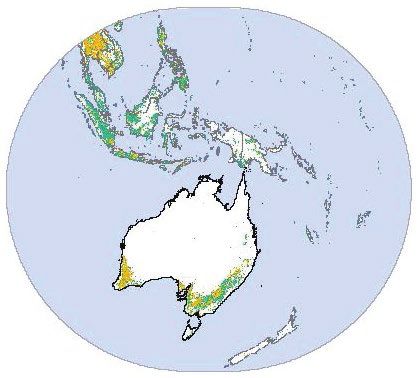
Agrobiodiversity Index Report 2019 – Risk and Resilience
Risk assessment FIGURE 3 – Increased risks related to low
agrobiodiversity levels in Australia
Risks related to low agrobiodiversity
Limited agrobiodiversity in Australia’s production
Low High
systems exposes the country to increased risk for land
Biod
degradation and climate change losses (Figure 3). rty
trap ive
rsi
ty
ve los
Medium-low soil biodiversity, limited interconnection Po s
between agriculture and natural vegetation, and low
species diversity per unit of land contribute to making
this risk high. The absence of explicit strategies and
and diseases
actions to increase agrobiodiversity in production
Climate change
systems further increases those risks.
Pests
Resilience building M
aln at
io
n
utr
itio grad
n d de
Lan
Reversing the risk assessment, current use of
agrobiodiversity helps most strongly to reduce the risk
of malnutrition (Figure 4), although it is uncertain how
this agrobiodiversity is used and by whom. Species
diversity in domestic supply is relatively high and at
least 75% of dietary calories come from non-staple foods.
The high scores in genetic resource management of
agrobiodiversity help reduce the risk of biodiversity loss,
through in situ and ex situ conservation.
FIGURE 4 – Contributions of Agrobiodiversity Index indicators to resilience building in Australia
AUS fig.4
Commitment to agrobiodiversity for healthy diets
Commitment to agrobiodiversity for sustainable
agriculture
Commitment to agrobiodiversity for future use
Reducing risk of poverty trap
options
Consumption and market management practices
supporting agrobiodiversity
Reducing risk of biodiversity loss
Production practices favoring agrobiodiversity
Production diversity-based practices
Reducing risks related to pests and diseases Genetic resource management practices
supporting agrobiodiversity
Species diversity
Reducing risk of land degradation
Varietal diversity
Functional diversity
Reducing risks related to climate changes Underutilized/local species
Soil biodiversity
Landscape complexity
Reducing risk of malnutrition
Pollinator biodiversity
0 20 40 60 80 100
Note: All scores are scaled to a maximum of 100. Colours indicate relative scores of individual agrobiodiversity indicators that contribute to building
resilience for that specific risk area. No data available for pollinator biodiversity.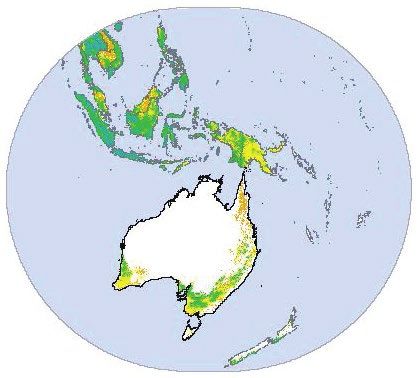
Australia – Country profile
Indicator trends generally low compared to other countries. The majority
of agricultural cropland hosts fewer than 10 crops per
land unit (10x10km). Crop diversity is lowest in the
northeast and in the southwest. This suggests that
production systems could benefit from diversification to
improve risk management and ecosystem functioning.
Spatial trends The soil biodiversity index (Figure 5C) is low in large
areas of the country (Figure 5C), including some of the
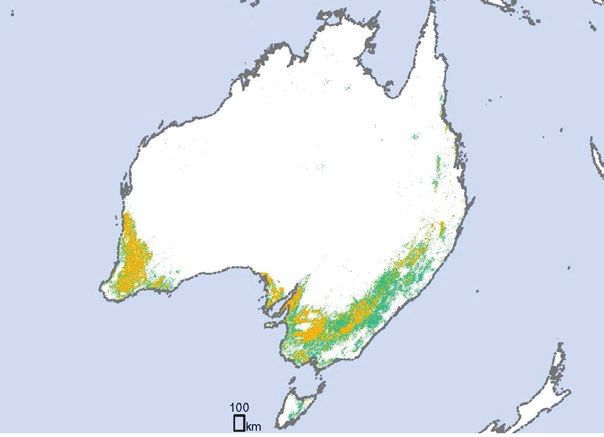
Agricultural cropland in Australia is concentrated in the agricultural areas, indicating limitations for agricultural
southern and eastern regions. About 46% of this land potential. Northern and eastern Australia have higher
contains a minimum of 10% of natural or semi-natural soil biodiversity (Figure 5C). The combination of low
vegetation (Figure 5A), suggesting that agriculture soil biodiversity potential, low crop species diversity
is moderately intertwined with the surrounding and absence of natural vegetation in agricultural land
environment. This land sharing is mainly practiced in southwestern Australia make this area vulnerable to
in eastern Australia and contributes to agroecosystem land degradation.
functioning and resilience. Crop species diversity is
FIGURE 5 – Spatial trends in agrobiodiversity indicators for sustainable agriculture, including A) agricultural land
with >10% natural or semi-natural vegetation; B) number of harvested crops per pixel, and C) soil biodiversity index
A B C 100
km
Agricultural landscapes embedding No. harvested crops per pixel Soil
Soilbiodiversity
biodiversityindex
index
High
High
Agriculture 0
>= 10% natural vegetation 1-5 Low
Low
< 10% natural vegetation 6-10
11-22
23-44
>= 45
Source: Adapted from: A) European Space Agency, 2017; B) Monfreda et al., 2008;xiii C) European Soil Data Center, 2016.xiv
FIGURE 6 – Temporal trends in species diversity in Temporal trends
production in Australia (Shannon diversity index)
Temporal trends in species diversity in Australia’s
production illustrate a rather stable production diversity,
1.00 but levels are below the 10-country average (Figure 6). A
0.90 slight increase in species diversity can be observed more
recently. It will be of interest to explore how this trend
0.80
further evolves, in combination also with the percentage
Diversity
0.70
of natural or semi-natural vegetation on agricultural
0.60
land.
0.50
0.40
1960 1970 1980 1990 2000 2010 2020
Year
Species Diversity 10 countries Species Diversity Production
Source: FAOxv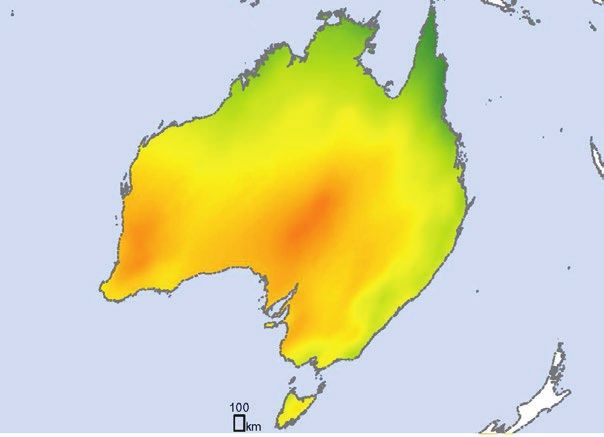
References                                                       Food and Agriculture, J. Bélanger & D. Pilling (eds.).
                                                                 FAO Commission on Genetic Resources for Food and
                                                                 Agriculture Assessments. Rome. 572 pp. Available at:
                                                                 http://www.fao.org/3/CA3129EN/CA3129EN.pdf
                                                                    Khoury, Colin K. & Amariles, Daniel & Soto, Stivens &
                                                                 xi

  National Farmers’ Federation. (2019). Farm facts [Online].
i
                                                                 Diaz, María & Sotelo, Steven & Sosa Arango, Chrystian
Available at: https://www.nff.org.au/farm-facts.html             & Ramírez-Villegas, Julian & Achicanoy, Harold &
   FAO 2010. The Second Report on the State of the World’s
ii                                                               Velásquez-Tibata, Jorge & Guarino, Luigi & León, Blanca
Plant Genetic Resources for Food and Agriculture. Rome.          & Navarro-Racines, Carlos & Castaneda Alvarez, Nora &
Available at: http://www.fao.org/3/i1500e/i1500e.pdf             Dempewolf, Hannes & Wiersema, John & Jarvis, Andy.
                                                                 (2018). Comprehensiveness of conservation of useful wild
   Afshin, Ashkan & John Sur, Patrick & A. Fay, Kairsten
iii
                                                                 plants: An operational indicator for biodiversity and
& Cornaby, Leslie & Ferrara, Giannina & S Salama,                sustainable development targets. Ecological Indicators.
Joseph & C Mullany, Erin & Abate, Kalkidan & Cristiana,          98. 420-429. 10.1016/j.ecolind.2018.11.016. Available at:
Abbafati & Abebe, Zegeye & Afarideh, Mohsen &                    https://www.sciencedirect.com/science/article/pii/
Aggarwal, Anju & Agrawal, Sutapa & Akinyemiju, Tomi              S1470160X18308781
& Alahdab, Fares & Bacha, Umar & F Bachman, Victoria
& Badali, Hamid & Badawi, Alaa. (2019). Health effects              Global Nutrition Report. (2018). Australia Country
                                                                 xii

of dietary risks in 195 countries, 1990–2017: a systematic       nutrition profile [Online]. Available at: https://
analysis for the Global Burden of Disease Study 2017.            globalnutritionreport.org/nutrition-profiles/oceania/
The Lancet. 393. 1958-1972. 10.1016/S0140-6736(19)30041-8.       australia-and-new-zealand/australia/#profile)
Available at: https://www.thelancet.com/journals/lancet/             Monfreda, C., Ramankutty, N., Foley, J. A. (2008).
                                                                 xiii

article/PIIS0140-6736(19)30041-8/fulltext                        Farming the planet: 2. Geographic distribution of crop
   UNICEF. (2018). Infant and young child feeding
iv                                                               areas, yields, physiological types, and net primary
database [Online]. Available at: https://data.unicef.org/        production in the year 2000. In: Global Biogeochemical
topic/nutrition/infant-and-young-child-feeding/                  Cycles, Volume 22, Issue 1. Doi: 10.1029/2007GB002947

v
   CSIRO. (2014). Bioiversity. Science and Solutions for             European Soil Data Center. (2016). “Global Soil
                                                                 xiv

Australia [Online]. Available at: http://www.publish.csiro.      Biodiversity Maps” associated with the Global Soil
au/ebook/download/pdf/6967                                       Biodiversity Atlas. Joint Research Centre  of the European
                                                                 Commission. Available online at: https://esdac.jrc.
   FAO. (2019). The State of the World’s Biodiversity for
vi
                                                                 ec.europa.eu/content/global-soil-biodiversity-maps-0
Food and Agriculture, J. Bélanger & D. Pilling (eds.).
FAO Commission on Genetic Resources for Food and
                                                                 xv
                                                                      FAO. 2019. Food Balance Sheets. In: FAOSTAT [Online].
Agriculture Assessments. Rome. 572 pp. Available at:             Available at: http://www.fao.org/faostat/en/#data/FBS
http://www.fao.org/3/CA3129EN/CA3129EN.pdf
    European Space Agency (2017). European Space Agency
vii

Land Cover CCI Product User guide version 2.0. Technical
report Year 2015. Available at: https://maps.elie.ucl.ac.be/
CCI/viewer/download/ESACCI-LC-Ph2-PUGv2_2.0.pdf
viii
      Nowosad, J., Stepinski, T. F., Netzel, P. (2019). Global
assessment and mapping of changes in mesoscale landscapes:
1992–2015 in Science Direct, Volume 78, pp 332-340. Doi:
https://doi.org/10.1016/j.jag.2018.09.013
   Global Nutrition Report. (2018). Australia Country
ix

nutrition profile [Online]. Available at: https://
globalnutritionreport.org/nutrition-profiles/oceania/
australia-and-new-zealand/australia/#profile)
x
      FAO. (2019). The State of the World’s Biodiversity for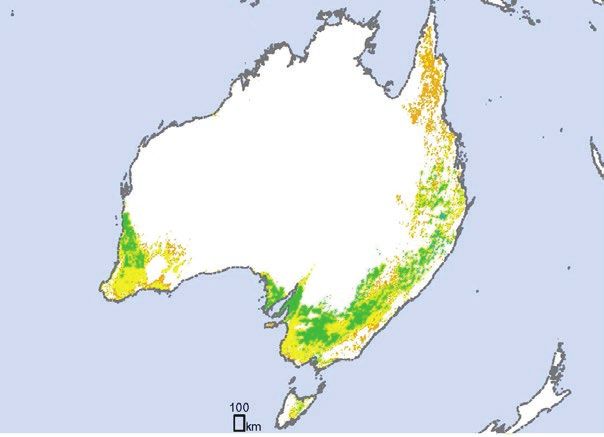
You can also read