At a glance summary - Wine Australia

Page created by Terrence Wallace
 
CONTINUE READING
At a glance summary - Wine Australia
At a glance summary
           • The Australian winegrape crush for 2021 is estimated to be
             2.03 million tonnes – the largest recorded
           • The crush is 31 per cent above the 2020 harvest and 17 per cent
             above the 10-year average of 1.74 million tonnes
           • The average winegrape purchase price increased by
             1 per cent to $701 per tonne
           • The total estimated value of the crush increased by
             36 per cent from $1.15 billion in 2020 to $1.56 billion, an
             increase of $400 million
           • South Australia was the largest contributor with 52 per cent
             of the national crush, followed by NSW (29 per cent) and
             Victoria (17 per cent)
           • The largest individual region was the South Australian

National
             Riverland, accounting for 31 per cent of the national
             vintage, followed by Murray Darling–Swan Hill in Vic/NSW
             (22 per cent) and Riverina NSW (17 per cent)
           • Red varieties overall were up by 37 per cent while white
             varieties were up by 25 per cent

Vintage
           • Shiraz was the largest variety with a crush of 538,402 tonnes,
             an increase of 41 per cent compared with 2020
           • Chardonnay was the second largest variety overall and
             largest white variety with 385,114 tonnes, an increase of
             33 per cent compared with 2020

Report
           • All the top 10 red varieties increased in volume except for Ruby
             Cabernet. Malbec and Mataro/Mourvèdre increased the most
             in percentage terms, while Durif moved up to 6th position,
             overtaking Ruby Cabernet

2021
           • All the top 10 white varieties increased except for
             Gewürztraminer. Prosecco showed the strongest growth, up
             by more than 50 per cent compared with 2020 and more than
             100 per cent compared with the 5-year average.
At a glance summary - Wine Australia
Overview of the 2021 winegrape crush
The 2021 Australian winegrape crush is estimated1 to be 2.03 million tonnes, the         The value of the 2021 crush at the weighbridge is estimated to be $1.56 billion,
largest ever recorded, after a season characterised by near-perfect growing and          an increase of $400 million (36 per cent) compared with 2020, as a result of the
ripening conditions across most states and regions. The larger crush balanced            increased crush and higher grape prices. The overall average value increased by
out the two previous below-average vintages, with the average of the three being         1 per cent from $694 per tonne to $701 per tonne, the highest since 2008.
closely in line with the long-term average.

The 2021 crush was 31 per cent higher than the 2020 crush of 1.54 million tonnes2,            Figure 1 : Australian winegrape crush and average yield 2005–2021
and 17 per cent above the 10-year average of 1.74 million tonnes. The estimated yield
was just under 14 tonnes per hectare, slightly lower than in 2017 when it is estimated
that the area of vineyards was about 5000 hectares less (see Figure 1).
                                                                                                                 2500                                                16
The 2020–21 season was a perfect contrast with the previous one. While summer                                           Crush       Wine Australia   Yield
2019–20 was the second hottest on record, 2020–21 was the coolest in 10 years                                                       estimate
(0.28°C below average) under the influence of a La Niña climate pattern. South                                                                                       14
                                                                                                                           Average crush 2011–2020
Australia had its coolest summer in 19 years and Western Australia the coolest in
                                                                                                                 2000      1.74mt
15 years. December 2020 was the third wettest on record for Australia, whereas
                                                                                                                                                                     12
December 2019 was the driest. Fewer heatwaves and good rain at the right time

                                                                                          Crush in ’000 tonnes
allowed grapes to ripen optimally, reducing bottlenecks at wineries and ensuring
maximum quality potential could be realised. Good fruitset, strong grape prices                                                                                      10
                                                                                                                 1500

                                                                                                                                                                          Yield t/ha
and the need to recover incomes after the low 2020 vintage drove cropping levels
up in many vineyards, facilitated by good water allocations through the inland                                                                                       8
regions, while a lack of disease pressure meant low levels of rejected fruit.

Yields in the three large inland regions: SA Riverland, Murray Darling–Swan Hill and                             1000
                                                                                                                                                                     6
Riverina had been less affected by dry conditions in the previous season compared
with other regions due primarily to the availability of supplementary water,
and therefore had a smaller combined increase of 18 per cent in 2021, while the                                                                                      4

remaining regions were up collectively by 84 per cent, with most up by 30 per cent                               500

or more. This saw the share for the three large inland ‘river regions’ decrease from                                                                                 2
79 per cent to 71 per cent of the total crush.

                                                                                                                   0                                                 0
1. Based on responses to the National Vintage Survey 2021
                                                                                                                      05

                                                                                                                       06

                                                                                                                       08

                                                                                                                       09

                                                                                                                       10

                                                                                                                         11
                                                                                                                        12

                                                                                                                       13

                                                                                                                       14
                                                                                                                       15

                                                                                                                       16

                                                                                                                       18

                                                                                                                       19
                                                                                                                       20

                                                                                                                        21
                                                                                                                       07

                                                                                                                        17
                                                                                                                     20

                                                                                                                     20
                                                                                                                     20

                                                                                                                     20
                                                                                                                    20
                                                                                                                    20

                                                                                                                    20

                                                                                                                    20
                                                                                                                    20

                                                                                                                    20
                                                                                                                    20
                                                                                                                    20
2. Department of Agriculture, Water and Environment, May 2021

                                                                                                                    20
                                                                                                                    20

                                                                                                                    20
                                                                                                                    20
                                                                                                                   20

National Vintage Report 2021                                                                                                                                 Wine Australia            2
At a glance summary - Wine Australia
Crush by state and region
South Australia accounted for the largest share of the crush, with an estimated                 Murray Darling – Swan Hill was the second largest region. This winegrowing area is
1.06 million tonnes (52 per cent of the total). Its crush increased by 44 per cent              in fact made up of two distinct GI regions, each split between NSW and Victoria by
overall compared with the previous year, while the crush for SA excluding the                   the River Murray (see Figure 3) to give four reporting regions:
Riverland more than doubled.                                                                    •   Murray Darling – NSW
NSW was the second largest contributor with an estimated 0.58 million tonnes but                •   Murray Darling – Vic
lost share from 32 per cent to 29 per cent of the national crush as it only increased           •   Swan Hill – NSW
by 17 per cent. Victoria crushed 0.33 million tonnes and increased by 25 per cent,              •   Swan Hill – Vic
retaining a 17 per cent share overall.                                                          These have traditionally been grouped together and treated in the National
The largest individual region by crush size in 2021 was once again the South                    Vintage Report as a single region4. However, for state totals, the crush from the
Australian Riverland, which had a record crush of 558,252 tonnes3, up by nearly                 four components of Murray Darling–Swan Hill are allocated to the correct state5.
100,000 tonnes compared with 2020. Despite this, it reduced its share from 34 per
cent to 31 per cent of the national vintage.                                                        Figure 3: Murray Darling and Swan Hill GI regions in NSW and Victoria

  Figure 2: Share of crush volume
  and growth by state 2021

                                                                           0.02%
                                            2%                                p 112%
               Vol Change
             share    YoY
                                            p 21%
                                                              52%
                                                               p 44%
  SA          52%       44%                                                    29%
  NSW         29%       17%                                                     p 17%
  VIC         17%       25%
  WA           2%       21%
                                                                  17%
  TAS
  QLD
               1%
            0.02%
                        18%
                       112%
                                                                  p 25%                  1%
                                                                                        p 18%
                                                                                                4. In the National Vintage Survey dashboard, this is now reported as a ‘zone’
                                                                                                5. In previous years, the state has not always been specified; in which case grapes are
3. Directly collected tonnes not scaled up to factor in the non-response rate (see Method)         apportioned to each state in the ratio 0.55 (Vic):0.45 (NSW).

National Vintage Report 2021                                                                                                                                                     Wine Australia   3
At a glance summary - Wine Australia
Table 2: Crush in 2021 and year-on-year change for the top 5 GI regions by
                                                                                            state excluding the inland river regions

                                                                                                                                Collected tonnes     Change        Share of
                                                                                            State and region
                                                                                                                                         in 2021        YoY           state
                                                                                            South Australia                             941,113        44%
                                                                                             Barossa Valley                              60,018       112%               6%
                                                                                             Langhorne Creek                             53,523       120%               6%
                                                                                             Coonawarra                                  50,199        91%               5%
                                                                                             Padthaway                                   43,802       167%               5%
                                                                                             McLaren Vale                                36,659        28%               4%
                                                                                            New South Wales                             518,040        17%
                                                                                             Hunter                                       4,041        87%               1%
                                                                                             Orange                                       3,093       112%               1%
                                                                                             Cowra                                        2,286        -17%              0%
                                                                                             Gundagai                                     1,959       420%               0%
                                                                                             Mudgee                                       1,392        17%               0%
A summary of the crush for the three inland ‘river regions’ is shown in Table 1 below.      Victoria                                    298,614        25%
                                                                                             King Valley                                 19,859        84%               7%
Table 1: Crush in 2021 and year-on-year change for the inland river regions
                                                                                             Yarra Valley                                10,246        65%               3%
                                                                                 Share of    Heathcote                                    9,148        30%               3%
                                   Collected tonnes in 2021   Change YoY
                                                                           national crush
                                                                                             Goulburn Valley                              8,609        34%               3%
Riverland                                          558,252          21%             31%
                                                                                             Grampians                                    3,413       149%               1%
Murray Darling-Swan Hill                           401,560          15%             22%
                                                                                            Western Australia                            40,074        21%
  Murray Darling-Swan Hill – VIC                   223,472          40%             12%
                                                                                             Margaret River                              24,566        15%             61%
  Murray Darling-Swan Hill – NSW                   178,088          37%             10%
                                                                                             Great Southern                               8,299        52%             21%
Riverina                                           315,752          18%             17%
                                                                                             Swan District                                2,416         -4%              6%
                                                                                             Geographe                                    2,006        22%               5%
A summary of the crush for the largest GI regions in each state excluding the inland         Pemberton                                    1,658        29%               4%
river regions is shown in table 2.
                                                                                            Tasmania                                     10,800        18%
Table 4 on page 11 shows the crush volume and value by state and region for all GIs.        Queensland                                      365       112%
                                                                                             Granite Belt                                   235       253%             64%
                                                                                             South Burnett                                   86        29%               0%

National Vintage Report 2021                                                                                                                               Wine Australia   4
At a glance summary - Wine Australia
Crush by colour and variety                                                                             Figure 4: Share of crush by colour 2005–2021

The total increase in crush in 2021 over 2020 was approximately 500,000 tonnes.                                                               White share           Red share
Two-thirds of the increase was contributed by red varieties. The crush of red grapes6                                   100%

in 2021 is estimated to be 1,163,482 tonnes – an increase of 314,217 tonnes (37 per                                     90%

cent) compared with 2020. This was the largest red crush for at least 15 years at 31                                    80%
per cent above the 10-year average. It was only the second time since 2005 that the                                     70%
red crush has exceeded 1 million tonnes. The white crush was 864,946 tonnes – an                                        60%
increase of 170,324 tonnes (25 per cent). The crush was 1 per cent above the 10-year                                    50%
average. This smaller increase led to white grapes reducing their share of the total                                    40%
from 45 per cent in 2020 to 43 per cent – the third year in a row that it has declined                                  30%
and the lowest it has been since 2004 (see Figure 4).
                                                                                                                        20%
Although the overall crush in 2021 was the highest on record, the white crush was                                       10%
3 per cent lower than in the previous record year (2017), whereas the red crush was                                      0%
4 per cent higher, reflecting the shift in popularity towards reds over the past few

                                                                                                                                 05

                                                                                                                                  06

                                                                                                                                  08

                                                                                                                                  09

                                                                                                                                  10

                                                                                                                                    11
                                                                                                                                   12

                                                                                                                                  13

                                                                                                                                  14

                                                                                                                                  15

                                                                                                                                  16

                                                                                                                                  18

                                                                                                                                  19
                                                                                                                                  20

                                                                                                                                   21
                                                                                                                                  07

                                                                                                                                   17
                                                                                                                                20

                                                                                                                                20
                                                                                                                                20

                                                                                                                                20
                                                                                                                               20
                                                                                                                               20

                                                                                                                               20

                                                                                                                               20
                                                                                                                               20

                                                                                                                               20
                                                                                                                               20
                                                                                                                               20

                                                                                                                               20
                                                                                                                               20

                                                                                                                               20
                                                                                                                               20
                                                                                                                           20
years.

The main contributor to the increase in red crush was Shiraz, which was up by
157,034 tonnes (41 per cent) to a record 538,402 tonnes. This saw its share increase                    Figure 5: Shiraz vs Chardonnay crush 2015–2021
                                                                                                        (numbers indicate ratio of Shiraz to Chardonnay)
by one percentage point to 46 per cent of all red varieties and 27 per cent of the
total crush.
                                                                                                                                          Chardonnay crush            Shiraz crush
Chardonnay remained the second largest variety overall with 385,114 tonnes, an                                           600                                                                       1.40
                                                                                                                                                  1.39
increase of 95,543 tonnes (33 per cent) compared with 2020. Cabernet Sauvignon
was the third largest variety with 15 per cent of the total crush, increasing by 36 per                                  500           1.06                  1.05          1.18
cent to 308,496 tonnes. The gap between Shiraz and Chardonnay increased further                                                 1.06
                                                                                                                                                                                     1.32

                                                                                                          ’000 tonnes
in 2021, with the crush of Shiraz 40 per cent higher than that of Chardonnay.                                            400

                                                                                                                         300

                                                                                                                         200

                                                                                                                         100

                                                                                                                           0
                                                                                                                                2015   2016      2017        2018          2019      2020          2021
6. Pinot Noir is counted in the red crush although some of it is used to make white (sparkling) wine.

National Vintage Report 2021                                                                                                                                                                Wine Australia   5
At a glance summary - Wine Australia
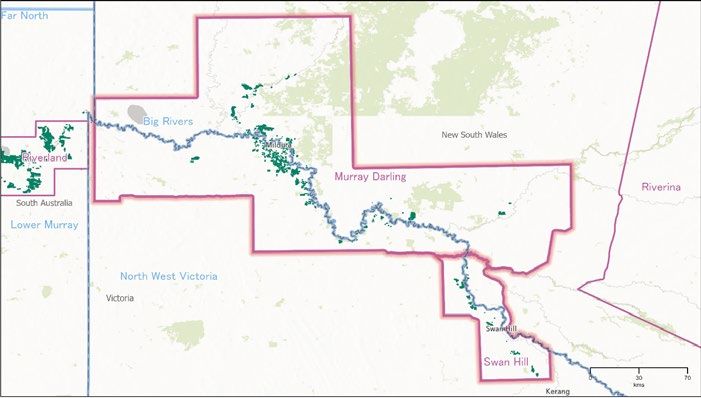
Figure 6: Comparison of 2020 and 2021 crush for top 10 red varieties                                                              Of the top 10 red varieties (see Figure 6), Mataro/Mourvèdre and Malbec had the
                                                                                                                                  largest increases in percentage terms, while Durif continued its strong growth, up
                 600                                                                                                              56 per cent compared with the 5-year average7 and moving up another place in the
                            41%
                                                               2020           2021       % change                                 top 10, overtaking Ruby Cabernet to be the 6th largest red variety. Ruby Cabernet
                 500
                                                                                                                                  slipped to 8th position as it was one of very few varieties to have a lower reported
   ’000 tonnes

                 400
                                                                                                                                  crush in 2021 than in 2020.
                                       36%
                 300
                                                                                                                                  Figure 7 shows that the crush for all the top 10 white varieties increased in 2021
                                                                                                                                  compared with the previous year, except for Gewürztraminer, which declined by
                 200                                                                                                              4 per cent year-on-year, and by 28 per cent compared with the 5-year average.
                                                   26%                                                                            Prosecco showed the strongest growth, increasing by over 50 per cent compared
                 100                                           52%                                                                with 2020 and by over 100 per cent (more than double) compared with the
                                                                        19%      20%        45%        -4%          96%     74%
                     0                                                                                                            5-year average.
                                         z

                                                   t

                                                             ir

                                                                        t

                                                                                  rif

                                                                                           he

                                                                                                         t

                                                                                                                 re

                                                                                                                             c
                                       on

                                                                                                                                  Table 5 on page 15 shows the estimated crush and total estimated value for each

                                                                                                       ne
                                                 lo

                                                                          o
                                     ira

                                                                                                                           be
                                                           No

                                                                                                                 èd
                                                                       rd

                                                                                Du

                                                                                             c
                                    gn

                                               er

                                                                                                     er
                                                                                          na
                                  Sh

                                                                                                                           al
                                                                     Ve

                                                                                                               rv
                                              M

                                                           t
                                 vi

                                                                                                 ab
                                                        no

                                                                                                                       M
                                                                                        re
                                                                                                                                  major variety.

                                                                                                             ou
                               au

                                                                  tit

                                                                                                 C
                                                      Pi

                                                                                     G

                                                                                                         M
                                                                Pe
                             tS

                                                                                             by

                                                                                                         o/
                           ne

                                                                                           Ru

                                                                                                       ar
                         er

                                                                                                     at
                                                                                                                                  Setting aside the unusually low crop in 2020, most white varieties have shown an
                      ab

                                                                                                  M
                                                                Top 10 red varieties
                     C

                                                                                                                                  overall decline in production over the past 5 years, while the opposite is true for reds.

                                                                                                                                  To allow varieties to be directly compared over time despite the different tonnages,
Figure 7: Comparison of 2020 and 2021 crush for top 10 white varieties                                                            the crush for each variety in a reference year is assigned a value of 1.0 and the
                                                                                                                                  crush in each subsequent year is divided by the crush in the reference year. An
                 400         33%                                                                                                  index greater than 1.0 indicates growth, while a number below 1.0 indicates decline.
                 350                                     2020            2021        % change
                                                                                                                                  Figures 8 and 9 show how the crush of each variety in 2021 compares with its
                 300
                                                                                                                                  crush in 2016 (the reference year). Note that the total crush in 2016 was 1.83 million
  ’000 tonnes

                 250                                                                                                              tonnes, 4 per cent above the 10-year average and 9 per cent lower than in 2021. The
                 200                                                                                                              varieties in each chart are listed in order of index from highest to lowest.
                 150                                                                                                              For the whites (Figure 8), only the top 5 on the list have shown positive growth,
                                        15%        30%
                 100                                                                                                              while the next 6 have remained almost static and the bottom 4 have declined by up
                                                               24%       12%     13%
                  50                                                                                                              to 40 per cent. Chardonnay has declined by 7 per cent.
                                                                                            12%        26%          53%     –4%
                     0                                                                                                            In the case of reds, 19 out of the 22 individually reported varieties have increased
                                                                                                                                  over the 5-year timeframe, while only Cabernet Franc and Tempranillo have
                                                                        an its

                                                                                                                            er
                           ay

                                                   io

                                                                              on

                                                                              rd

                                                                                g

                                                                                                                 co
                                      c

                                                                       an at
                                     an

                                                                            cs

                                                                            lin
                                               rig

                                                                                                                           in
                                                                          co

                                                                     bl et
                                                                          ba
                                                                    Bl sc

                                                                                                               ec
                                                          ill
                         nn

                                                                         es

                                                                                                                          m
                                  Bl

                                                                  ns p
                                                         m
                                              /G

                                                                 do Mu

                                                                                                               os
                                                                      om

                                                                                                                                  declined. Durif and Montepulciano showed the strongest overall growth, while the
                        o

                                                                                                                      tra
                                                                      Ri
                                                                ai t à
                                                        Se
                                 n
                     rd

                                                                                                             Pr
                                             ris
                                no

                                                                   ol
                 ha

                                                                                                                      tz
                                                             gr sca
                                                                 C
                                        tG
                              ig

                                                                                                                    ür

                                                                                                                                  benchmark variety Shiraz grew by 22 per cent across the timeframe.
                 C

                            uv

                                                              or

                                                               u

                                                                                                                 ew
                                      no

                                                             M
                                                               G
                         Sa

                                                                                                                G
                                     Pi

                                                        Top 10 white varieties
                                                                                                                                  7. 2016–2020

National Vintage Report 2021                                                                                                                                                                              Wine Australia   6
Figure 8: Comparison of crush in 2021 compared with 2016                                                                    Figure 9: Comparison of crush in 2021 compared with 2016
       by variety (whites)                                                                                                         by variety (reds)

                                           4.5                                                                                                              4.5                                             Durif
                                                                                                                                                                                                            Montepulciano
                                                                                           Grüner Veltliner
                                           4.0                                                                                                              4.0                                             Sangiovese
                                                                                           Prosecco                                                                                                         Mataro/Mourvèdre
                                                                                           Pinot Gris/Grigio                                                                                                Touriga Nacional
                                           3.5                                                                                                              3.5

                                                                                                                  Crush relative to reference year (2016)
 Crush relative to reference year (2016)

                                                                                           Fiano                                                                                                            Muscat à petits
                                                                                                                                                                                                            grains rouges
                                                                                           Rousanne
                                           3.0                                                                                                                                                              Nebbiolo
                                                                                           Muscat Gordo Blanco                                              3.0
                                                                                                                                                                                                            Petit Verdot
                                                                                           Muscat à petits
                                                                                           grains blancs                                                                                                    Nero d’Avola
                                           2.5                                                                                                              2.5                                             Shiraz
                                                                                           Colombard
                                                                                                                                                                                                            Cabernet Sauvignon
                                                                                           Sauvignon Blanc
                                           2.0                                                                                                              2.0                                             Pinot Meunier
                                                                                           Semillon
                                                                                                                                                                                                            Grenache
                                                                                           Chardonnay
                                                                                                                                                                                                            Barbera
                                           1.5                                                                                                              1.5
                                                                                           Chenin blanc                                                                                                     Malbec
                                                                                           Marsanne                                                                                                         Ruby Cabernet
                                           1.0                                             Viognier                                                         1.0                                             Lagrein
                                                                                           Vermentino                                                                                                       Pinot Noir

                                           0.5                                             Riesling                                                                                                         Merlot
                                                                                                                                                            0.5
                                                                                           Gewürtztraminer                                                                                                  Graciano

                                                                                           Verdelho                                                                                                         Cabernet Franc
                                           0.0                                                                                                              0.0                                             Tempranillo
                                                 2016   2017   2018   2019   2020   2021                                                                          2016   2017   2018   2019   2020   2021

Other varieties
The top 10 red and top 10 white varieties together accounted for 96 per cent of the                              or ‘other white’ because of their small volumes and/or small number of reporting
total crush in 2021. The remaining 4 per cent (88,451 tonnes) was made up of a                                   wineries. Table 6 on page 16 provides more detail on the minor varieties crushed in
further 68 red and 58 white varieties. Some of these are individually reported                                   Australia, as reported by respondents to the National Vintage Survey 2021.
in the regional intake summary tables8 while others are grouped under ‘other red’

8. These can be found on the National Vintage Survey dashboard.

National Vintage Report 2021                                                                                                                                                                                  Wine Australia     7
Crush by winery size
The Australian wine sector is made up of a small number of large wine businesses        Figure 10: Number of responses by winery size category
and a large number of small wine businesses. According to the Department of
Agriculture, Water and the Environment9, in 2019–20, there were 2136 winegrape
levy-payers, of whom 251 (12 per cent) did not crush any grapes, 592 (28 per cent)                               26
crushed less than 10 tonnes, 1247 (58 per cent) crushed between 10–3000 tonnes
                                                                                                                        80                    >10,000 tonnes
and 46 (2 per cent) crushed 3000 tonnes or more.

In 2021, there were 579 respondents to the National Vintage Survey (a record                                                                  500–10,000 tonnes
number), plus a further 77 who reported a zero crush for the 2021 vintage, making a
32 per cent response rate out of 2054 known eligible entities surveyed.                              355                    118               100–500 tonnes
The distribution of responses reflects the overall structure of the Australian wine
sector, with the largest size category accounting for 4 per cent of respondents and                                                           10,000 tonnes

                                                                                                                                             500–10,000 tonnes

                                                                                                                                             100–500 tonnes
                                                                                                                      83%
Analysis of grape purchases
The winegrape batches reported in the National Vintage Survey are classified as           Canberra District in New South Wales, Kangaroo Island in South Australia and
either ‘winery grown’ or ‘purchased’ – ie bought from an independent supplier.            Manjimup in Western Australia.
Among the 2000 or so wine businesses in Australia, there is a diversity of business
                                                                                          There were 1,191,186 tonnes of purchased grapes reported, made up of 33,189
models, from wineries that only use their own fruit and do not purchase any
                                                                                          individual batches10 with a total reported value of $833,983,377.
grapes, to those who purchase all their grapes and do not grow any of their
own. In between, many wine businesses are both winemakers and grapegrowers                The average value across all purchases in 2021 was $701 per tonne, an increase of
– either predominantly selling their grapes but keeping some back for their own           1 per cent on the 2020 average value of $694 per tonne. The overall increase was
wine production, or growing some grapes and purchasing the balance of their               made up of a 4 per cent decrease in the average value of reds to $833 per tonne,
supply from grapegrowers. In addition, there are estimated to be around 6,200             offset by an 11 per cent increase in the average value of whites to $538 per tonne
independent winegrape growers who do not crush any grapes.                                (see Figure 12).

Of the 579 respondents to the National Vintage Survey 2021, 215 (37 per cent)
reported only crushing their own grown grapes, while 89 (15 per cent) only crushed         Figure 12: Comparison of red and white average winegrape purchase
purchased grapes and did not grow any of their own. Although more than one-third           value 2007–2021
of respondent wineries crushed only their own grown fruit, their reported tonnage
only accounted for 2 per cent of the crush in 2021 (Table 3).                                             1000
                                                                                                          900                                                                     Red
Table 3: Respondents by source of grape supply                                                            800
                                                                                                                                                                                 Total
                                          # respondents        % total   Share of crush                   700

                                                                                            $ per tonne
All winery grown                                   215            37%              2%                     600
                                                                                                                                                                                White
All purchased                                       89            15%              9%                     500
Both                                               275            47%             89%                     400
Total                                              579          100%             100%                     300
                                                                                                          200
Overall, purchased grapes accounted for 66 per cent of the total crush in 2021.
                                                                                                           100
However, there was a large variation between regions in the share of purchased
                                                                                                            0
fruit, reflecting the number of wineries compared with the number of independent

                                                                                                                08

                                                                                                                09

                                                                                                                10

                                                                                                                              1

                                                                                                                                   12

                                                                                                                                           13

                                                                                                                                           14

                                                                                                                                           15

                                                                                                                                           16

                                                                                                                                           18

                                                                                                                                           19

                                                                                                                                           20

                                                                                                                                           21
                                                                                                                07

                                                                                                                                            17
                                                                                                                               1
grapegrowers in each region. Regions with above 90 per cent purchased fruit

                                                                                                                            20

                                                                                                                                         20
                                                                                                                                   20

                                                                                                                                        20
                                                                                                                                        20
                                                                                                                                        20

                                                                                                                                        20

                                                                                                                                        20
                                                                                                             20

                                                                                                                                        20
                                                                                                                                        20
                                                                                                             20

                                                                                                                                        20
                                                                                                             20
                                                                                                             20
included Southern Fleurieu and the Adelaide Plains in South Australia, Cowra,
Tumbarumba and Gundagai in New South Wales, Bendigo and Upper Goulburn in
Victoria and Blackwood Valley in Western Australia. Conversely, the regions with          10. Most transactions represent individual purchases but some respondents choose to group
                                                                                              transactions by variety and region which does not affect the average value but makes the price
more than 80 per cent own grown fruit included Rutherglen and Henty in Victoria,              dispersion analysis slightly less accurate.

National Vintage Report 2021                                                                                                                                              Wine Australia   9
These net changes were a result of both the change in prices paid and an increase                Price dispersion
in the contribution of non-inland river regions to the total crush value due to their
increased share of the crush in 2021.                                                            The dispersion of prices paid can be determined from an analysis of the batch
                                                                                                 data. Each batch is assigned to a price segment and the volume purchased in each
The average value for reds was down overall in both the inland ‘river regions’ and               segment determined. The dispersion analysis for 2021 shows a strong downward
across the rest of Australia, while the average value for whites increased in both               shift in the prices paid for reds, with the proportion purchased between $600 and
areas (Figure 13).                                                                               $1500 decreasing from 79 per cent to 26 per cent while there was a corresponding
                                                                                                 increase in the share purchased at $300–$600 per tonne (up from 10 per cent to 60
  Figure 13: Average value in 2021 by colour and location                                        per cent). The dispersion for white grapes hardly changed; there was just a slight
                                                                                                 upward shift with 13 per cent purchased at between $600 and $1500 compared
                             1800                                                                with 10 per cent in 2020 (Figure 14).
                                                                          2019
                             1600                                         2020
                             1400                                         2021                    Figure 14: Price dispersion for red and white purchased grapes 2020 vs 2021
     Average value $/tonne

                             1200
                                                                                                                                               100%

                                                                                                    Share of grapes sold in each price range
                                                                                                                                                                                            White 2020
                             1000
                                                                                                                                                                                            White 2021
                             800                                                                                                                                                            Red 2020
                                                                                                                                               80%
                             600                                                                                                                                                            Red 2021

                             400                                                                                                               60%

                             200

                               0                                                                                                               40%
                                    Red        White    Red       White   Red            White
                                    Rest of Australia   River regions            Total
                                                                                                                                               20%

                                                                                                                                                0%
Estimated value of the Australian winegrape crush
Summary statistics – vintage 2021
Table 4: Crush by state and region 2021
                                                                                               Tonnes      Winery grown   Total collected Winery grown            Share of      Number of
Region
                                                                                            purchased            tonnes          tonnes12 share of tonnes   national crush   respondents13
New South Wales                                                                                329,265         188,774          518,040             36%              29%              105
  Big Rivers zone other                                                                          1,711            6,089           7,799             78%               0%
Table 4: Crush by state and region 2021 (continued)

                                                         Tonnes   Winery grown   Total collected Winery grown            Share of      Number of
Region
                                                      purchased         tonnes          tonnes12 share of tonnes   national crush   respondents13
South Australia                                        634,852        306,261          941,113             33%              52%              255
  Adelaide Hills                                         22,379          7,612          29,991             25%               2%              101
  Adelaide Plains                                         2,905                          2,905              0%               0%                  10
  Barossa Valley                                         34,529         25,489          60,018             42%               3%                  83
  Barossa zone other                                        65           1,326           1,392             95%               0%                   5
  Clare Valley                                            7,335         12,522          19,857             63%               1%                  44
  Coonawarra                                             12,891         37,308          50,199             74%               3%                  40
  Currency Creek                                          1,787          3,744           5,532             68%               0%                  11
  Eden Valley                                             4,334          5,336           9,669             55%               1%                  39
  Fleurieu zone other                                     3,358            41            3,399              1%               0%                  15
  Kangaroo Island                                           15            144              159             90%               0%
Table 4: Crush by state and region 2021 (continued)

                                                         Tonnes   Winery grown   Total collected Winery grown            Share of      Number of
Region
                                                      purchased         tonnes          tonnes12 share of tonnes   national crush   respondents13
Victoria                                               201,032          97,582         298,614             33%              17%              182
  Alpine Valleys                                          2,125           596            2,721             22%               0%                  14
  Beechworth                                               224            160              384             42%               0%                   7
  Bendigo                                                 1,668           107            1,775              6%               0%                  15
  Central Victoria zone other                              570           4,129           4,699             88%               0%
Table 4: Crush by state and region 2021 (continued)

                                                         Tonnes   Winery grown   Total collected Winery grown            Share of      Number of
Region
                                                      purchased         tonnes          tonnes12 share of tonnes   national crush   respondents13
Western Australia                                        23,300         16,773          40,074             42%               2%                  99
  Blackwood Valley                                         858                             858              0%               0%
Table 5: Crush by major variety 2021

                                                                      2021 weighted
                                        Est 2021   Per cent change                     Per cent change       Est total value
Major varieties                                                             average
                                          tonnes          in tonnes                    in average value          ALL grapes
                                                                      purchase value
Red
  Shiraz                                538,402               41%               878                -5%         519,499,002
  Cabernet Sauvignon                    308,496               36%               787              -10%          271,387,932
  Merlot                                121,809               26%               591              -12%           74,742,115
  Pinot Noir                             55,335               52%              1235               14%           83,510,051
  Petit Verdot                           26,700               19%               503              -13%           13,828,436
  Durif                                  15,610               20%               632                -8%          10,694,490
  Grenache                               15,579               45%              1256                4%           20,575,770
  Ruby Cabernet                          14,285                -4%              498              -11%            7,277,799
  Mataro/Mourvedre                         9,552              96%               990                1%           10,903,790
  Malbec                                   6,534              74%              1033               16%            7,038,455
  Other red                              51,178               36%                                               42,050,046
Red Total                              1,163,482              37%               833                -4%       1,061,507,886
White
  Chardonnay                            385,114               33%               531               11%          219,156,981
  Sauvignon Blanc                       101,685               15%               677               14%           72,065,383
  Pinot Gris/Grigio                      92,809               30%               705               10%           66,396,991
  Semillon                               63,342               24%               466                7%           30,195,167
  Muscat Gordo Blanco                    61,275               12%               322                -1%          19,754,513
  Colombard                              54,246               13%               324                3%           17,586,365
  Muscat à petits grains blancs          22,663               12%               362                0%            8,328,975
  Riesling                               21,476               26%              1096               11%           24,328,111
  Prosecco                               15,786               53%               952               20%           15,246,278
  Gewürztraminer                           9,279               -4%              414                8%            4,028,948
  Other white                            37,273               11%                                  8%           24,903,790
White Total                             864,946               25%               538               11%          501,991,501
Grand Total                            2,028,428              31%               701                1%        1,563,499,387

National Vintage Report 2021                                                                              Wine Australia   15
Table 6: Varieties outside the top 20 reported in the National Vintage Survey 2021

These varieties were outside the top 10 for each colour but reported individually in                       Varieties grouped as ‘other’ in regional intake summary reports but which have at
the regional summary tables.                                                                               least three wineries reporting them in total.14
Reds                                               Whites                                                  Other reds                                                      Other whites
Barbera                                            Verdelho                                                Aglianico                        Mondeuse Noire                 Albarino
Cabernet Franc                                     Viognier                                                Alicanté Bouschet                Muscat à Petits Grains Noirs   Arinto
Graciano                                           Chenin Blanc                                            Carignan                         Negroamaro                     Arneis
Lagrein                                            Fiano                                                   Carmenère                        Other red                      Canada Muscat
Montepulciano                                      Vermentino                                              Chambourcin                      Rubired                        Clairette
Muscat à Petits Grains Rouges                      Marsanne                                                Cienna                           Sagrantino                     Greco
Nebbiolo                                           Roussanne                                               Cinsaut                          Saperavi                       Grenache Blanc
Nero d’Avola                                       Grüner Veltliner                                        Colorino                         Tannat                         Gros Manseng
Pinot Meunier                                                                                              Counoise                         Tarrango                       Moscato Giallo
Sangiovese                                                                                                 Dolcetto                         Teroldego                      Muscadelle
Tempranillo                                                                                                Gamay                            Tinta Barroca                  Other white
Touriga Nacional                                                                                           Isabella                         Tinta Câo                      Palomino
                                                                                                           Lambrusco                        Tyrian                         Pecorino
                                                                                                           Marzemino                        Zinfandel/Primitivo            Pedro Ximenez
                                                                                                           Mencia                                                          Pinot Blanc
                                                                                                                                                                           Savagnin
                                                                                                                                                                           Sultana
                                                                                                                                                                           Topaque
                                                                                                                                                                           Trebbiano
                                                                                                                                                                           Verdejo
                                                                                                                                                                           Verduzzo

14. There are a further 27 red and 29 white varieties reported by at least one winery in 2021 – including some that are not identified by name.
    These are not listed to protect the confidentiality of the respondents.

National Vintage Report 2021                                                                                                                                                             Wine Australia   16
Method
The National Vintage Survey is a single annual crush and price survey conducted         The crush estimate is based on calculating the ratio of tonnes collected in the
by Wine Australia on behalf of the Australian wine sector. This report has been         survey in the current year to the tonnes collected from the same respondents in
prepared by Wine Australia based on an analysis of survey results.                      the previous year15. This is assumed to be representative of the overall change in
                                                                                        crush volume between the two years, although it can be affected by other factors
Wine grapes levy payers (approximately 2,000 businesses) are sent a request
                                                                                        including changes of ownership and business decisions around use of fruit.
for crush data in late April. Wine Tasmania conducts the survey in Tasmania in
collaboration with Wine Australia to ensure alignment of results and to minimise        This change in crush is applied to the final DAWE figure16 for the previous vintage to
survey load on wineries.                                                                provide an estimate for the current vintage.

Respondents are asked to provide individual transaction data by variety and
region for grape purchases and a summary of their own (winery) grown fruit by           2021 estimated crush calculation
variety and region. This enables accurate reporting of crush (production) and price     Change in crush from respondents who responded in both 2021 and 2020: 31.4%
dispersion data by variety and GI region as well as at a national and state level.      DAWE figure for 2020:                                         1,543,877 tonnes
In 2021, responses were received from 579 businesses, including all wineries known                           Calculation: 1,543,877 x (1 + 0.314) = 2,028,428
to have crushed over 10,000 tonnes. The collected tonnage is estimated to account
for 89 per cent of all winegrapes crushed in 2021.                                      Wine Australia estimated crush for 2021:                                      2,028,428 tonnes

Calculating the national crush estimate                                                 Reconciliation of crush estimate in 2020
At a national level, the data collected has been scaled up to provide an estimate of    Wine Australia estimate in 2020 survey:                   1,520,608 tonnes (June 2020)
the actual crush by variety (including non-collected tonnes).                           Department of Agriculture figure for 2020:                1,543,877 tonnes (as at May 2021)

The actual crush figure for each vintage is taken to be the figure provided by          The Wine Australia estimate for the 2020 crush was within 23,300 tonnes
the Department of Agriculture (now Department of Agriculture Water and the              (1.5 per cent) of the DAWE figure reported in May 2021.
Environment (DAWE)) levies unit, which collects levies based on crush and is the        It should be noted that the 2020 figures reported in this 2021 report will vary slightly
most accurate crush figure available. This figure is updated as levy returns are        from what was reported last year, as they have been adjusted based on using the
received and is not finalised until at least 12-18 months after the vintage it refers   updated DAWE recorded figure for 2020 and incorporating late responses.
to. Therefore, Wine Australia prepares an early estimate of the crush for the wine
sector based on the survey results.

                                                                                        15. The tonnage collected from this group is 89% of the total estimated crush.
                                                                                        16. In fact, the DAWE figure can continue to change for many months as late returns are received.
                                                                                            The latest available figure is used in this calculation, which is from May 2021.

National Vintage Report 2021                                                                                                                                            Wine Australia      17
Notes on the calculation of average value and valuation of own                      The value of own grown fruit is estimated using the same calculated average
                                                                                    purchase value as applies for purchased fruit of that variety in that region. Where
grown fruit
                                                                                    there are no purchases of a particular variety, the average for that variety across
The average value is calculated at the variety/region level by dividing the total   all similar regions is used to estimate the value, or – if that is not available – then
amount paid for all purchased grapes of that variety/region by the tonnes for       the average for red or white in the same region is used. It should be noted that
which purchase value is provided.                                                   this figure is an estimate only as own grown fruit by definition does not have a
                                                                                    commercial purchase value.
Where tonnes purchased have been reported without a price attached, these
tonnes are not included in the calculation of the average price for that variety.

National Vintage Report 2021                                                                                                                               Wine Australia     18
Published July 2021 © Wine Australia

Note: data published in this report supercedes that in earlier reports. Minor
variations in reported figures can occur due to data revisions.

Any questions about the report should be directed to:
Wine Australia Market Insights
+61 8 8228 2000
market.insights@wineaustralia.com

                                                                                       About Wine Australia
Disclaimer
                                                                                       Wine Australia supports a competitive wine sector by investing in research,
This information has been made available to assist on the understanding
                                                                                       development and adoption (RDA), growing domestic and international markets, and
that Wine Australia is not rendering professional advice. Wine Australia does
                                                                                       protecting the reputation of Australian wine.
not accept responsibility for the results of any actions taken on the basis of
the information contained in this report, nor for the accuracy, currency or            Wine Australia is an Australian Commonwealth Government statutory authority,
completeness of any material contained in it. Wine Australia expressly disclaims       established under the Wine Australia Act 2013, and funded by grape growers and
all and any liability and responsibility to any person in respect of consequences of   winemakers through levies and user-pays charges and the Australian Government,
anything done in respect of reliance, whether wholly or in part, upon this report.     which provides matching funding for RDA investments.
You can also read