The Feeding Ecology of Grey Gurnard, Eutrigla gurnardus, off the coast of Scotland. Abstract
←
→
Page content transcription
If your browser does not render page correctly, please read the page content below
The Feeding Ecology of Grey Gurnard, Eutrigla gurnardus, off the coast of Scotland.
Abstract
Until recently, little research had been conducted into the feeding ecology of grey gurnard (Eutrigla
gurnardus), and the species’ wider interaction with the ecosystems it inhabits. This study was carried out
to address several questions that have recently arisen about the species. Mainly whether the grey
gurnard population at Rockall Bank have been predating on the juvenile haddock to a degree that could
cause the stock to decline. This was assessed by conducting a stomach contents analysis on a sample of
grey gurnard caught on several trawls. The results of this were inconclusive, with only 3 stomachs
containing potential haddock remains out of a total of 121 stomachs. However, these results do not
completely disprove the hypothesis, as other factors may have influenced the low fish intake in these
gurnard. Furthermore, the populations of grey gurnard from Rockall Bank and the Firth of Forth were
compared to determine any differences in feeding ecology between the two. It emerged that the two
populations were reasonably similar, with smaller size classes consuming less fish and proportionally
more invertebrates, while larger size classes had a diet that was predominantly fish, with the fish prey
consisting largely of sand eels. Finally, the influence of fish size on prey selection was investigated, with
the result showing a clear correlation between increasing fish size and increasing prey mass, likely owing
to the greater amount of fish prey that makes up a larger gurnard’s diet.

Introduction:
Grey gurnard, Eutrigla gurnadus, is a demersal marine species that has a wide distribution throughout
the North Atlantic and the North Sea (Vinogradov et al., 2014; Floeter et al., 2005). Until recently little
research has focused on the grey gurnard and therefore little is known about population size and life
history strategies (Vinogradov et al., 2014). Russian fleets began a commercial fishery for grey gurnard in
the North East Atlantic in 1999-2000 which increased research effort into the species (Vinogradov et al.,
2014). The emphasis of much of the grey gurnard research is on their feeding behaviour, mainly prey
type and quantity but also acoustic patterns associated with feeding (Amorim & Hawkins 2005;
                                                         Vinogradov et al., 2014; Floeter et al., 2005).
                                                          This study focuses on the feeding behaviour of
                                                          two separate populations of grey gurnard off the
                                                          coast of Scotland. The first population considered
                                                          is found at Rockall Bank located 200 miles off the
                                                          west coast of Scotland in the North East Atlantic.
                                                          The second is found in the Firth of Forth area of
                                                          the North Sea off the east coast of Scotland. Both
                                                          areas are of economic interest to British fishing
                                                          fleets (Newton et al., 2008; Floeter et al., 2005).
                                                          Rockall Bank is fairly isolated and so management
                                                          of fish stocks is difficult. The first major fishery in
                                                         the area operated by British fleets was for cod,
    Figure 1: Location of Rockall Bank. Bottom
                                                         however in the 20th century haddock became of
    right shows location in regards to rest of UK.
                                                         higher commercial interest (Newton et al., 2008).
                                                         In the 2000’s, after some controversy regarding
                                                         the UK’s fishing limits, Russia and Britain were the
main countries fishing in the area, with Scottish boats making up the bulk of the fleet (Newton et al.,
2008). Rockall Bank haddock is managed as a separate stock unit and due to hydrological conditions eggs
or larval haddock from surrounding populations do not reach Rockall (Neat et al., 2011; Newton et al.,
2008). In recent years there has been a decline in haddock catches in the Rockall area and therefore
research into their wider trophic interactions, as well as possible life history causes has been
conducted(Newton et al., 2008). At Rockall haddock recruitment is highly variable from year to year so to
try and encourage more reliable recruitment some areas of Rockall have been closed to all fishing
activity to try and protect haddock nursery areas (Wright et al., 2010).
Another suggestion for the decline in haddock is that increasing numbers of grey gurnard are predating
on juvenile haddock reducing the numbers reaching adult stocks. The aims of this study are firstly to
assess the likelihood that grey gurnard are responsible for the decline in haddock at Rockall Bank and
secondly to compare the feeding behaviours of two different populations of grey gurnard. Thirdly to
assess whether size has any influence on prey selection of grey gurnard. To do this stomach contents
analysis was carried along with various measurements taken from the fish.
Methods:
The Rockall Bank investigation was carried out by the vessel MFV Carina BF803, which left Kinlochbervie
harbour on 16 May 2015 and carried out trawls over the course of 5 days using Carina standard demersal
trawl gear with a 20mm internal binder fitted. During this time 24 stations were sampled with one haul
of 30 minutes carried out at each station. The maximum depth was 220m, daily start time was 06.00 with
all trawling completed by roughly 23.30 each night. See figure 1 for the shoot and haul locations of each
trawl. On tows that recorded both haddock and gurnard, stomach samples were taken from one grey
gurnard of each size class and frozen for later analysis. The number and lengths of haddock and grey
gurnard were also recorded.
The Firth of forth samples are part of a longer running project that has information from 2009 onwards.
Due to this along with stomach samples from a number of species, including grey gurnard, intestine, liver
and gonad samples were also collected to assess energy reserves and age as well as diet. These samples
were also frozen for later laboratory analysis.
Laboratory analysis of most recent samples collected from 2015 at Rockall Bank and 2013 Firth of Forth
samples was carried out from the 27 July 2016. The frozen stomach samples were recovered from the
freezer 8 samples at a time to prevent decomposition of stomach contents once defrosted. Every
individual fish was given its own unique identification number to aid in recording the data properly. The
stomachs were cut open from the oesophageal opening and the contents examined to the lowest
possible taxonomic resolution and then weighed on a Mettler Toledo BD202 balance to the nearest
0.01g and recorded (see figure 2). If the stomach contained multiple prey types, such as fish and
invertebrates, they were also weighed individually. For the Firth of Forth samples collected in 2013, the
nematode parasites around the stomach and intestines were removed and weighed. The stomach mass
was then analysed using the above procedure along with the contents of the intestines being recovered
and weighed. Finally for the Firth of Forth samples, the gonads and liver were allowed to defrost before
being weighed within their respective bags so as to include all the wet weight associated with them. The
statistical software R (version 3.02.1, R Development Core Team 2015) was then used to create the
scatter plots and boxplots shown in the results section.
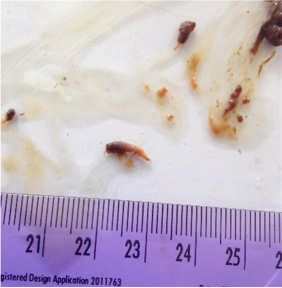
A) B)
Figure 2
A) Shows empty gurnard
stomach
B) Shows crustacean
removed from Rockall
Bank grey gurnardResults
A total of 824 gurnard stomachs are considered in this study with 256 being dissected in July/August
2016 the rest are from previous studies carried out in the Firth of Forth. Of the 824 stomachs 20% were
empty, 35% contained fish prey remains; 31% contained invertebrate prey and 14% contained both types
of remains. Of the Rockall Bank samples the majority of the grey gurnard contained invertebrate prey
remains and the few that did contain fish material were Sandeels (see Figure 4.1 and Table 1). Fish
remains make up a larger mass of the stomach contents despite the number of fish containing
invertebrates or fish being nearly the same. The main species found in grey gurnard stomachs was
sandeels (Ammodytes marinus) there was also a number of crustacean species such as squat lobster
(Galathea squamifera) and other smaller species. Finally there were also a number of cephalopod beaks
Table 1: Shows average stomach contents mass, fish prey mass and invertebrate prey mass for
each location and year considered. (Fof= Firth of Forth)
removed from the stomach samples.
The boxplot in Figure 3 shows that the mean
stomach contents mass did not vary greatly
between the years or geographical locations.
The trawl carried out in the Firth of Forth 2011
did not contain many grey gurnard and the few
that were caught most were empty or the
stomach contents very low and hence a scatter
plot was not drawn of this year (Figure 4).
However, the FoF 2011 information was
included in calculating the averages for each size
class and prey type (Figure 4). The final aim of
this investigation is to address whether the size
of grey gurnard affects prey consumption.
Figure 3: Boxplot showing the stomach
contents mass of all grey gurnards.
Arranged by trawl location and year. (FoF=
Firth of Forth, Roc= Rockall Bank.)4.1) Rockall 2015 4.2) FoF 2009
4.3) FoF 2010 4.4) 2012
4.5) FoF 2013
Figure 4: Scatterplots showing the relationship between
length of grey gurnard and mass of each prey type found
in the stomach. (Circles indicate fish prey, triangles
invertebrate prey). 4.1) Rockall Bank samples with one
outlier removed containing 18.8g of fish. 4.2) Firth of
Forth 2009 samples. 4.3) Firth of Forth 2010 samples also
with outlier of over 20g fish removed. 4.4) Firth of Forth
2012 samples. 4.5) Firth of Forth 2013 samples. All
showing simple linear regression lines.
The scatterplots (Figure 4) show that in general the longer the fish the greater the mass of fish prey
recovered from the stomach, this is consistent across all years considered. However the length of the fish
does not seem to affect the amount of invertebrate prey within the stomachs as shown by the nearlyhorizontal trend lines. There is a slight change in later years with the relationship between the longer fish
and increased amount of invertebrate becoming more prominent.
Table 2 for numbers of gurnards within each size class containing fish remains, invertebrate remains,
both or empty. In general large grey gurnard were more likely to contain fish prey and smaller fish were
more likely to be empty or contain invertebrate prey. Table 2 also shows the average fish prey mass and
average invertebrate prey mass found in each size class which is then plotted as a bar chart in Figure 5
shows the average mass of the two categories of prey type for each size class, with the fish separated
into small (10-19.9cm), medium (20-24.9cm) and large (25-40cm). The results show that the percentage
of large gurnards containing fish remains was higher (approximately 47%) than small gurnards with only
~20% containing fish
remains.
Table 2: Number of grey gurnards in each size class and stomach contents
group; fish prey, invertebrate prey, both types or empty
Figure 5: Bar chart showing
average prey mass for all
grey gurnards in the study
separated into size classes.
N= 824.Figure 6: Length frequency histograms of all the grey gurnard and haddock caught in the 2015
trawls.
Haddock Rockall 2015 Grey Gurnard Rockall 2015
Discussion
The initial aim of this project was to determine the extent of the trophic relationship between grey
gurnard and haddock at Rockall Bank. However due to the fact that this type of stomach contents
analysis has not been carried out at Rockall before it is difficult to properly address this aim. In the future
it is crucial to obtain both a greater temporal range of samples and also the number of gurnard collected.
From these results it seems unlikely that grey gurnard are the principal cause for the decline of haddock
in recent years, of the 7 gurnard stomachs to contain fish remains 4 contained the remains of sandeels
and the rest could not be determined. There are a number of possible reasons for such an inconclusive
result however. Firstly, the time of year is a major factor influencing the feeding habits of grey gurnard at
Rockall. Previous studies show that grey gurnard feed more heavily on fish prey in September whereas,
in spring the major portion of their diet consists of euphausiids (Vinogradov et al., 2014). Furthermore,
the feeding intensity of Rockall grey gurnard was also shown to peak in April which again may explain
why the majority of stomach samples collected in May 2015 were empty (Vinogradov et al., 2014). In the
North Sea grey gurnard is considered one of the 10 most dominant species in the area and therefore has
begun to be studied in more detail to get a better understanding of its trophic interactions (Floeter et al.,
2005; Floeter & Temming 2005). In the North Sea it has been recorded that gurnard feed on a number of
juvenile fish including whiting, cod and saithe along with sandeels. Juvenile haddocks have not been
found to be a major prey item for grey gurnard in the North Sea and although the results for this study
are not definitive, it does support the idea that grey gurnard are not a major source of mortality for
juvenile haddocks (Floeter et al., 2005). Previous studies have highlighted that Rockall haddock stock
show large variation in recruitment year to year and this could be one of the causes for a decline in
haddock (Newton et al., 2008; Wright et al., 2010). Another influencing factor is that when fish are
caught in a trawl and hauled to the surface regurgitation of stomach material may occur (Staniland et al.,
2001). As the Rockall samples consisted only of the gurnards’ stomachs, with the oesophagus being
removed prior to freezing, potential haddock remains may have been lost.
The second aim of this study was to compare the feeding ecology of the Rockall grey gurnard to the
population found in the Firth of Forth. The results show that the most recent year from the Firth of
Forth, 2013, follows a similar pattern to that of Rockall Bank in that the larger gurnards contained more
fish prey mass. Also as the years have progressed the amount of crustacean prey consumed by larger fish
has increased in the Firth of Forth. There are a number of possible reasons behind this trend such as
abundance of different prey types meaning it is more efficient to target one over the other. This couldhave a seasonal component as the results shown here are only from spring. One large difference
between the two populations was the presence of the parasite Anisakis simplex in the FoF stomach
samples, which was entirely absent in the Rockall samples. A study by Levsen & Karl (2014) has
investigated the occurrence of these parasites in gurnard populations in the North Sea, and hypothesised
that they originate from one of the gurnards main food sources, the lesser sandeel (Ammodytes
marinus). While the same species of sandeel is present at Rockall, it is possible that due to the
geographical isolation of the species, Anisakis simplex has been unable to infect this population.
However, a large number of the parasites were found in the intestines of the affected FoF samples, and
as the Rockall samples consisted only of the stomachs, any present parasites may have been discarded
before the samples were frozen.
The length of the grey gurnard was considered in relation to prey type. Over the years a number of
studies have investigated the diet of grey gurnard with greatly varying results (Weinert et al., 2010).
Despite this variety in results from small scale studies grey gurnard show an ontogenetic diet shift from
mainly invertebrate prey to fish prey once they reach a length of approximately 20cm (Floeter et al.,
2005; Floeter & Temming 2005; Weinert et al., 2010). The results from this study follow the trend
previously recorded that once grey gurnard attain the size of 20cm they consume more fish prey than
invertebrate prey. The percentage of the stomach contents made up of fish prey remains is not that
much greater in medium fish (77%) compared to small fish (70%) however in large gurnards the
percentage is a lot higher at about 90%. The length frequency distributions (Figure 6) of haddock at
Rockall bank show that there are individuals small enough to be consumed by the larger grey gurnard
but it seems that gurnard favour invertebrates and sandeels. One study into prey preference of grey
gurnard in the North Sea showed that at a certain predator size there is a shift back to a prey preference
for relatively smaller prey such as invertebrates (Floeter & Temming 2005). This strategy can be
explained from a bioenergetic perspective because as the predator increases in body size the energetic
cost of fast burst swimming after larger fish prey becomes more costly and therefore the gurnards switch
back to easier foraging for smaller prey such as crustaceans (Floeter & Temming 2005).
Conclusion
Based on the evidence gathered in this study, it would appear that the grey gurnard population at
Rockall is not responsible for the declining haddock stocks, with no identifiable juvenile haddock being
found in any of the sampled stomachs. However, differences in feeding at different times of year and the
lack of regurgitated material from the samples mean that the original hypothesis cannot be completely
ruled out, so more research into this area is recommended. Comparing the feeding ecology of the Rockall
and Firth of Forth populations has shown the two areas to be similar, with similar prey mass to fish
length relationships being shown across the two populations. Finally, it can be concluded that the size of
the fish does influence prey selection in grey gurnard, with an increase in fish length leading to an
increase in fish and invertebrate prey mass found in the stomach.
References:
Amorim, M.C.P. & Hawkins, A.D., (2005) Ontogeny of acoustic and feeding behaviour in the grey
Gurnard, Eutrigla gurnardus. Ethology, 111(3), pp.255–269.
Floeter, J., Kempf, A., Vinther, M., Schrum, C., Temming, A., (2005) Grey gurnard (Eutrigla gurnadus) in
the North Sea : an emerging key predator ? , Can. J. Fish Aquat. Sci., Vol 62, pp.1853–1864.
Floeter, J. & Temming, A., (2005) Analysis of prey size preference of North Sea whiting, saithe, and
grey gurnard. , ICES Journal of Marine Science, 62, 897-907.
Levsen, A. & Karl, H., (2014) Anisakis simplex (s.l.) in Grey gurnard (Eutrigla gurnardus) from the North
Sea: Food safety considerations in relation to fishing ground and distribution in the flesh. Food
Control, 36(1), pp.15–19.
Neat, F. and Campbell, N., (2011) Demersal fish diversity of the isolated Rockall plateau compared withThe adjacent west coast shelf of Scotland. , Biological Journal of the Linnean Society, 104,
pp.138–147.
Newton, A.W., Peach, K.J., Coull, K.A., Gault, M., Needle, C.L., (2008) Rockall and the Scottish haddock
fishery. Fisheries Research, 94(2), pp.133–140.
R Core Team (2015). R: A language and environment for statistical computing. R Foundation for
Statistical Computing, Vienna, Austria. URL https://www.R-project.org/.
Staniland, I.J., Hart, P.J.B. & Bromley, P.J., (2001) The regurgitation of stomach contents in trawl caught
whiting, evidence of a predator size effect. Journal of Fish Biology, 59(5), pp.1430–1432.
Vinogradov, V.I., Arkhipov, A.G. & Kozlov, D.A., (2014) Feeding of Grey Gurnard Eutrigla gurnardus
(Triglidae) in the Area of the Rockall Seamount. , Journal of Ichthyology, 54(3), pp.243–248.
Weinert, M., Floeter, J., Kröncke, I., Sell, A.F., (2010), The role of prey composition for the condition of
grey gurnard (Eutrigla gurnardus). Journal of Applied Ichthyology, 26, pp.75–84.
Wright, P.J., Tobin, D., Gibb, F.M., Gibb, I.M., (2010) Assessing nursery contribution to recruitment:
Relevance of closed areas to haddock Melanogrammus aeglefinus. Marine Ecology Progress
Series, 400(2006), pp.221–232.You can also read