Magnetic and Dielectric Studies of Iron Nanoparticles
←
→
Page content transcription
If your browser does not render page correctly, please read the page content below
© 2018 IJSRST | Volume 4 | Issue 2 | Print ISSN: 2395-6011 | Online ISSN: 2395-602X
                                                                                                 Themed Section: Science and Technology

           Magnetic and Dielectric Studies of Iron Nanoparticles
              P. Durga Prasad, P Siva Prasada Reddy, J. Prasanthi, G. Nageswara Rao*
   Department of Inorganic and analytical Chemistry, School of chemistry, Andhra University, Visakhapatnam,
                                                       Andhra Pradesh, India
 ABSTRACT

 Iron nanoparticles were synthesized by sol-gel protocol. The techniques of XRD, FTIR, RAMAN, SEM, EDX,
 and VSM were used to characterize the ferrite nanoparticles. Through the characterization of the prepared iron
 nanoparticles, the effect of annealing temperature, chemical composition and preparation technique on the
 microstructure, magnetization and the particle size of the ferrite nanoparticles are discussed.XRD results clearly
 show that the lattice parameter and crystallite size are increased with annealing temperature. SEM photograph
 of the sample shows the shape of the particles is almost spherical. The magnetic properties of the iron oxide
 magnetite nanoparticles were investigated with a Vibrating Sample Magnetometer. Magnetic measurements at
 room temperature showed improvements in the saturation magnetization with increase in annealing
 temperature, which might be related to increase in particle size. Dielectric constant and dielectric loss were
 observed. The effect of annealing temperature on the magnetic properties of the samples is analyzed by
 vibrating sample magnetometer (VSM) and Dielectric properties are also measured.
 Keywords: Vibrating Sample Magnetometer, Dielectric constant, dielectric loss, SEM, XRD.

                    I. INTRODUCTION                                   structure for bulk magnetic material exhibiting super
                                                                      paramagnetization. Magnetic nanoparticles exhibiting
 Iron nanoparticles are found to be exhibiting                        super paramagnetic behaviour display higher
 interesting structural and magnetic properties. The                  saturation magnetization and low coercivity having
 possible applications of the iron nanoparticles are in               potential applications viz., as magnetic resonance
 magnetic storage, as precursors for ferro fluids,                    imaging contrast agents in ferro fluids based
 magnetic guided drug delivery agents and gas sensor                  technology,      information          storage   device   [8, 9].
 [1]. In recent years, the utilization of iron oxide                  Nanostructuring of materials has opened up a new
 nanoparticles with novel properties and functions has                dimension and made size as a parameter to be
 been widely studied due to their nano-range size, high considered for the phase diagrams in addition to the
 surface area to volume ratios and superparamagnetism. existing ones. The properties of nanosized
 [2-5]. Most of iron oxides show semiconductor semiconductor particles have been known to depend
 properties with narrow band gap (2.0–2.3 eV) and are                 very sensitively on the particle size [10]. The physical
 photoactive under solar irradiation as photo catalysts               properties of semiconductor nanocrystals are
 absorbing visible light [6, 7]. For example, Fe2O3 with              dominated by the spatial confinement of excitations
 band-gap of 2.2 eV is an interesting n-type                          (electronic and vibrational). Quantum confinement
 semiconducting material and a suitable candidate for                 that manifests itself in widening of HOMO, LUMO
 photo degradation under visible light condition.                     gap or the bandgap increase with decreasing crystallite
                                                                      size and its implications on the electronic structure
 The magnetic particles with smaller size become                      and photo physics of the crystallites has generated
 single domain in contrast with the usual multi domain

IJSRST1841159 | Received : 20 Jan 2018 | Accepted : 06 Feb 2018 | January-February-2018 [ (4) 2: 758-763]
                                                                                                                           758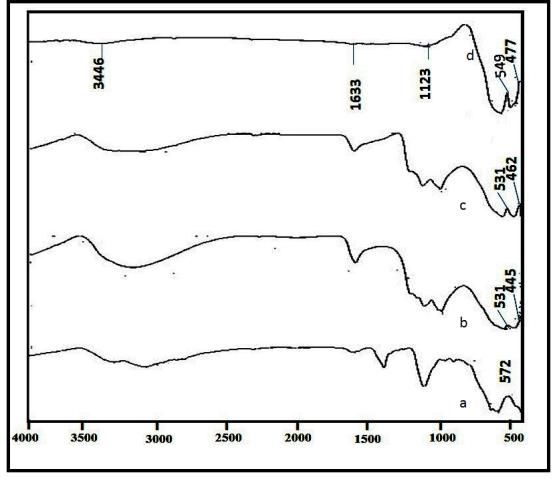
considerable interest [11]. In order to synthesize
nanoparticles and retain the size and morphology, it is
mandatory to try and maintain sufficiently low
temperatures during synthesis, processing and also in
the course of application.
Magnetic particles with sizes in the nanometer scale
are now of interest because of their many
technological applications and unique magnetic
properties which differ considerably from those of
Figure 1. XRD patterns of Fe3O4 nanoparticles
bulk materials. Below a critical size, magnetic particles
as-synthesized and calcined samples at 400oC, 600oC
become single domain in contrast with the usual multi and 800oC.
domain structure of the bulk magnetic materials
exhibiting unique phenomena such as super
For calcined samples we observed peaks (104), (110),
paramagnetic and quantum tunneling of the
(024) and (116), are well indexed at 30o, 36 o, 52 o and
magnetization [12]. Dielectric materials are changed
55o to the inverse cubic spinel structure of Fe3O4. In
as the particle size decreases from a typical bulk value
the above spectra phase identification is one of the
into a nanometer scale. most important uses in XRD. As shown in fig XRD
pattern of Fe3O4 nanoparticles after annealing the
II. SYNTHESIS XRD patterns well indexed to the cubical spinel phase
of magnetite and no other peaks observed in as
3.2 gm of PEG taken in 25 ml of D.H2O and stirred.
synthesized material.
3.3 gm of Fe (SO4).7H2O in 10 ml of D.H2O, 9.6 gm of
Fe2 (SO4)3 in 20 ml of D.H2O are stirred separately.
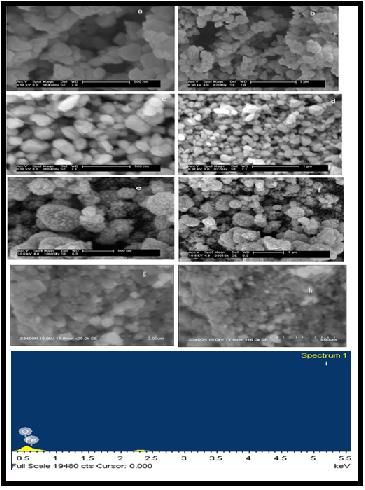
3.2 FTIR spectra:
Now both Fe (SO4).7H2O and Fe2(SO4)3 Solutions are
The typical FTIR spectra of Fe3O4 nanoparticles is
added drop by drop into the PEG solution. Then the
shown in fig Broad peak between 3151-3448 cm-1
solution is stirred for 30mins, Ammonia solution is
corresponds to O-H stretch vibration and 530-572 cm-
added for maintain pH-10. The mixture was further 1 Fe-O-Fe stretching vibration are observed in all the
stirred for 4hrs and filtered, washed with D.I. water
spectra.
and finally rinsed with acetone, dried in hot air oven
at 60oC/ 8h. The dried compound was calcined at
different temperatures at 400oC 600oC and 800oC for
4hrs to get Fe3O4 nanoparticles.
III. RESULTS AND DISCUSSION
3.1. X-Ray Diffraction Spectra:
XRD patterns of Fe3O4 nanoparticles as-synthesized
and calcined at different temperatures at 400oC, 600oC,
800oC. From the patterns of samples, it was found that Figure 2. a) As- Synthesized Fe3o4 nanoparticles, (b-d)
all the different peaks at (110), (024) and (116) Illustrates the FTIR spectra of Fe3O4 nanoparticles
corresponds to 36 o, 52 o and 55o. annealed at different temperatures.
International Journal of Scientific Research in Science and Technology (www.ijsrst.com) 759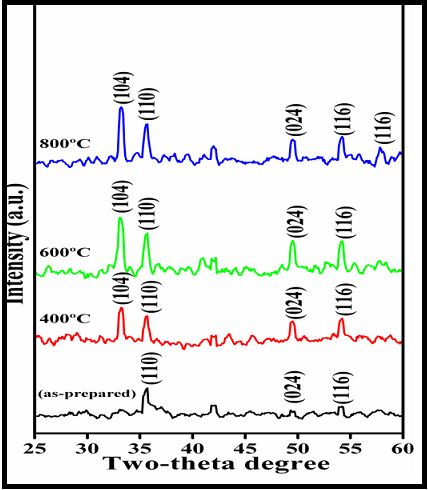
Peak observed between 1518-1732 cm-1 corresponds                raster scan pattern. The electrons interact with the
to C=O stretching vibration are observed in all the             atoms that make up the sample producing signals that
spectra, which are characteristic of asymmetric vas             contain information about the sample's surface
(COO ) and the symmetric vas (COO ) stretch This
       -                                     -                  topography as shown in Figure 4. Figure 4.(a, b) are as
explains that the bonding pattern of the carboxylic             prepared samples with spherical structure, Figure 4.(c,
acid on the surface of nanoparticles was a combination          d) are calcined at 400oC with Spherical structure,
of molecules bonded symmetrically and molecules                 Figure 4.(e, f) are calcined at 600oC with Spherical
bonded at an angle to the surface. Peaks observed               structure and Figure 4.(g, h) are calcined at 800oC
between 445-475 cm-1 correspondings to Fe-O (α-                 with Sphere structure. The EDX analysis shown in
Fe2O3) observed in all the calcined samples as shown            Figure 4.(i) confirms the presence of Fe and O, the
in Fig (b-d).                                                   consequent elements of        F-400.

3.3 Raman spectra:                                              3.5 DIELECTRIC PROPERTITES:
Figure 3. Illustrates the raman spectra of Fe3O4                Dielectric properties of solids are determined by
magnetite nanoparticles for as-synthesized material             electric dipoles having a length scale of a few
and calcined at different temperature, peak observed            angstroms. A local change in microstructure or
at 220 cm-1, 290 cm-1, 400 cm-1, 490 cm-1, 610 cm-1, 650        composition within this length scale affects the type
cm-1 and 720 cm-1 correspond to Fe3O4 vibration mode            and intensity of the dipole. As the particle size
for as synthesized material and calcined at 400 C and o         decreases to the nanometer scale local microstructure
600oC temperature , low intense peak at 610 cm-1 ,              and composition changes relative to the bulk state are
720 cm-1 correspond to Fe3O4. Calcined at 800°C high            greatly increased especially at the particle surfaces.
intense peak at 240 cm , 290 cm and low intense
                            -1          -1

peak at 420 cm-1, 510 cm-1, 620 cm-1 and 670 cm-1
correspond to Fe2O3 indicating Fe3O4 transformation
in to Fe2O3. These results well match with our XRD
results.

                                                                Figure 4. SEM images of Fe3O4 nanoparticles (a, b) as-
     Figure 3. The Raman Spectra of Fe3O4 magnetite             synthesized and calcined at different temperatures at
                       nanoparticles                            (c, d) 400oC, (e, f) 600oC and (g, h) 800oC, (i) EDX
3.4 SEM-EDX:                                                    Spectrum of F-400.
The scanning electron microscope (SEM) is a type of
electron microscope that images the sample surface by           Consequently, the dielectric properties of nanometer-
scanning it with a high-energy beam of electrons in a           sized particles are unique and different than those of

International Journal of Scientific Research in Science and Technology (www.ijsrst.com)                        760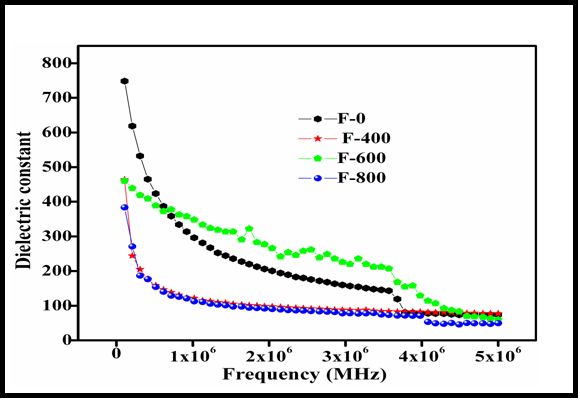
bulk-sized      particles.        Fabrication   methods    of
nanometer-sized particles have been developed to a
mature state where high control on size and
composition is achievable which enables efficient
usage of their unique dielectric properties.

                                                                 Figure 6. Dielectric loss of Fe3O4 nanoparticles as-
                                                                 synthesized and calcined at different temperatures at
                                                                 400oC, 600oC and 800oC.

                                                                 The hope of electrons to reach the grain boundary and
Figure 5. Dielectric constant of Fe3O4 nanoparticles             if the resistance of grain boundary is high enough
as-synthesized and calcined at different temperatures            then electrons pile up at the grain boundaries which
at 400oC, 600oC and 800oC.                                       causes polarization. The further increase of applied
                                                                 field shows that the electrons reverse their direction
The dielectric properties were measured for the                  of motion and reduces the chance of electrons to
samples      prepared         and      impedance     analyzer    approach the grain boundary and decreases the
infrequency range of 50Hz to 1MHz.The variation in               polarization. Thus this study reveals that the value of
dielectric    constant       of    Fe3O4   nanoparticles   as-   dielectric    constants    lowly   decreases    at    lower
synthesized and calcined at different temperatures at            frequencies     and      remains   constant    at    higher
400oC, 600oC, 800oC. The maximum value of the                    frequencies [14]. The dielectric constant and dielectric
dielectric constant in the range 380–750 is obtained.            loss decrease as the frequency increases. This decrease
From results it is found that the particle size of the           indicates the normal behaviour of ferrite samples. The
material increases with increase in the annealing                decrease takes place when the jumping frequency of
temperature. According to Koops the decrease in                  electric charge carriers cannot follow the alteration of
dielectric constant for increase in frequency can be             applied AC electric field beyond a certain critical
expressed by considering the solid as composed of well           frequency [15].
conducting grains which is separated by the poorly
conducting grain boundaries [13].                                3.6 VSM STUDIES:
                                                                 Magnetic measurements have been carried out by
                                                                 using quantum design vibrating sample magnetometer.
                                                                 The M–H hysteresis loops of Fe3O4 derived under
                                                                 different magnetic field strength demonstrates that
                                                                 both samples are super paramagnetic and different
                                                                 magnetic field intensity does not change the
                                                                 superparamagnetism of nanoparticles. The particle
                                                                 size has been reported to influence the magnetic
                                                                 properties of materials. The particle is size low and the
                                                                 saturation magnetization is large.

International Journal of Scientific Research in Science and Technology (www.ijsrst.com)                          761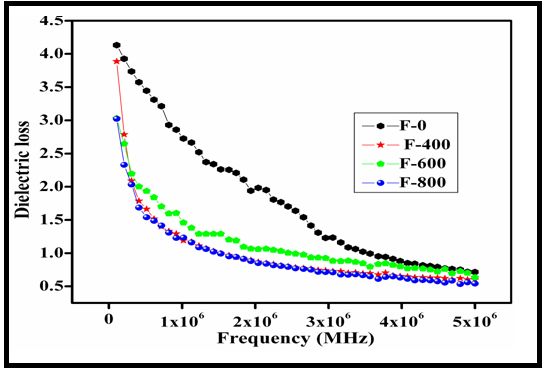
A comparison between the magnetic properties before                                   IV. CONCLUSION
and     after   annealing,       presented   in   Fig.7.    The
magnitudes of Ms and Mr should be scaled by the                   The syntheses of Iron nanoparticles are synthesized
fraction of the ferrite phase presenting each sample              via sol-gel protocol. The structural morphology of the
since the impurity phase of hematite is a canted                  Iron nanoparticles are identified by using SEM which
antiferromagnetic at room temperature with only                   are spherical in nature with particle size 0f ~100 nm
feeble magnetism. The increase in the magnetization               and crystal structure are measured by X-Ray
with increase in the annealing temperature is very                diffraction.   Among       the   four   samples    of    iron
likely related to increase in the particle size. This size        nanoparticles calcined at 400 C show better results in
                                                                                                   o

dependent effect has been well established in                     all the characterizations and also in dielectric and
magnetite nanoparticles where it was interpreted in               magnetic studies.
terms of the presence of magnetic dead layer on the
surface of a nanoparticles [16].                                                 V. ACKNOWLEDGEMENT

                                                                  The   authors    gratefully      acknowledge      to    UGC-
                                                                  NEWDELHI for financial assistance and acknowledge
                                                                  DST-FIST for instrument laboratory, department of
                                                                  inorganic and analytical chemistry for providing
                                                                  instrumentation facility.

                                                                                      VI. REFERENCES

                                                                  [1]. E. RanjithKumar, P.SivaPrasadaReddy, G.Sarala
                                                                        Devi , S.Sathiyaraj, (2016), Journal of Magnetism
Figure 7. Magnetic studies of Fe3O4 nanoparticles as-
                                                                        and Magnetic Materials , 398 ,281-288.
synthesized and calcined at different temperatures at
                                                                  [2]. S. A. C. Carabineiro, N. Bogdanchikova, P. B.
400oC, 600oC.
                                                                        Tavares and J. L. Figueiredo, (2012), RSC Adv.,
                                                                        2, 2957-2965.
Due to the strong molecular field, ferro and
                                                                  [3]. M. Niu, F. Huang, L. Cui, P. Huang, Y. Yu and
ferrimagnetic        materials     are   self-saturating,    or
                                                                        Y. Wang, (2010), ACS Nano, 4, 681-688.
“spontaneously magnetized” in the absence of an
                                                                  [4]. P. Xu, G. M. Zeng, D. L. Huang, C. Lai, M. H.
external field. However, it is still easy to find a ferro-
                                                                        Zhao, Z. Wei, N. J. Li, C. Huang and G. X. Xie,
or ferrimagnetic sample in the unmagnetized state.
                                                                        (2012), Chem. Eng. J., 203,423-431.
This is because ferro- and ferrimagnetic contain many
                                                                  [5]. J. L. Gong, B. Wang, G. M. Zeng, C. P. Yang, C.
small     regions,     called     “domains,”      which     are
                                                                        G. Niu, Q. Y. Niu, W. J. Zhou and Y. Liang,
spontaneously magnetized to saturation Ms but
                                                                        (2009) J. Hazard. Mater., 164, 1517-1522.
oriented at different directions to minimize the
                                                                  [6]. J. K. Leland and A. J. Bard, (1987), J. Phys.
energy potential within the material. The Ms in these
                                                                        Chem., 91, 5076- 5083.
domains cancel each other, yielding zero macroscopic
                                                                  [7]. X. H. Feng, H. J. Guo, K. Patel, H. Zhou and X.
magnetization. When an external field is applied,
                                                                        Lou, (2014), Chem. Eng. J., 244, 327-334.
these domains align with the field, and a large
                                                                  [8]. O.K.      Varghese,     C.A.    Grimes,   (2003),     J.
magnetization is observed.
                                                                        Nanoscience. Nanotechnol, 3, 277-293.

International Journal of Scientific Research in Science and Technology (www.ijsrst.com)                             762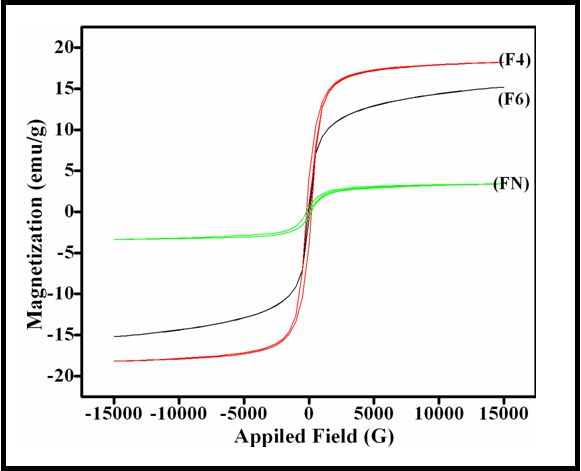
[9]. R.B. Kamble, V.L.            Mathe,     (2008),    Sens.
       Actuators B, 131,205-209.
[10]. A.L. Linsebigler, G. Lu Jr., J.T. Yatus, (1995), J.
       Phys. Chem., 99 7626-7631.
[11]. A. Fujishima, K. Honda, (1972), Nature , 238,
       37-38.
[12]. Y L N Murthy, I V Kasi Viswanath, T. Kondala
       Rao, Rajendra Singh, (2009), Int. J. of Chem
       Tech Research CODEN (USA): IJCRGG ISSN:
       0974-4290, Vol.1, No.4, pp 1308-1311.
[13]. C.G.Koops, (1951), PhysRev.83, 121.
[14]. S.R.Kulkarni,C.M.Kanamadi,B.K.Chougule,
       (2005), Mater. Res.Bull., 40, 2064-2072.
[15]. A.M.Abdeen, (1999), J.Magn.Magn.Mater. 192,
       121.
[16]. P. Dutta, S. Pal, M.S. Seehra, N. Shah, G.P.
       Huffman, (2009), J. Appl. Phys. 105,501.

International Journal of Scientific Research in Science and Technology (www.ijsrst.com)   763
You can also read