A Framework to Manage the Time Dimension of GIS
←
→
Page content transcription
If your browser does not render page correctly, please read the page content below
A Framework to Manage the Time Dimension of GIS
Pigaki M 1, Koutsopoulos K 1 and Klonari C 2
1 2
NTU of Athens University of the Aegean
pigaki@survey.ntua.gr, koutsop@survey.ntua.gr, aklonari@geo.aegean.gr
Abstract
Nowadays the use of Geographic Information Systems (GIS) requires the support of flexible
and expressive data management systems in order to describe, analyse and present the
physical and manmade world. However, the majority of the current approaches are based on
classical relational models, and subsequently on the distinction between spatial and thematic
information. This paper puts forward a theoretical framework based on the notion that time is
also an important element of GIS. More specifically, it suggests that the inclusion of time into
spatial databases has to be the condition for the optimal management of cartographic data
when the time dimension is considered. The proposed framework is based on two pillars: the
first one links the methods, which themselves are dependent on the way information is
modelled in the database, with the recycling of all information available. The second one, is
the development of “real” models which integrate spatio-temporal constraints (socio-
economic, regulatory and co relational) in order to analyse activities, processes and their
impact on the real world.
Keywords: spatial, temporal, historical, geography, GIS
Introduction
The way human beings perceive the physical space is mostly functional. It is the result of two
actions: first how we perceive our place in space and correlate with other subjects or objects
and second, how we perceive time as an environmental change due to natural phenomena or
to man-made influences. Therefore, the notions of “object” and “space” are closely associated
with the notion of time, which itself (in its complete form) is based mainly on logical actions
such as the order of events that justifies time-sequence, and time measurement which is
isomorphic to space measurement. Although the current GIS tools store, depict and model
space in a rather sufficient way, nevertheless the depiction of time
and its effects on objects is still incomplete. A new research
approach is thus necessary.
It is well known that in existing commercial GIS the problem of
spatial depiction is not entirely resolved, in the sense that they do
not examine the parameter of time. They have inflexible
databases which are not able to manage the cognitive or physical
time. However, the representation of the real world depends
highly on the multiple depictions that are the result of time
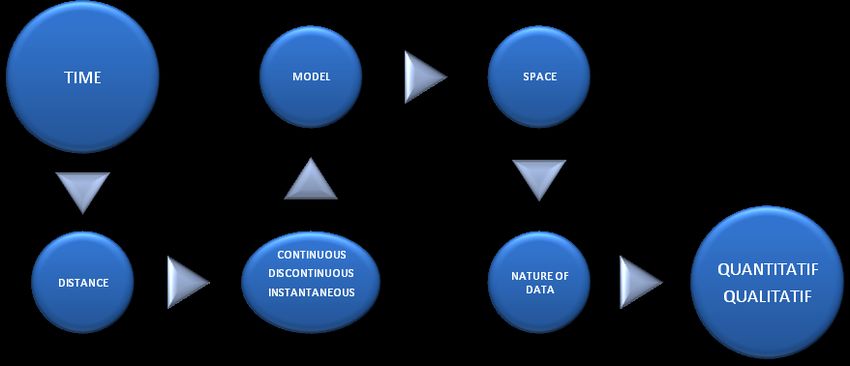
sequences. Therefore, the need for a time-space approach in order
to manage geographical space emerges (Figure 1). This approach
should be supported by a functional mathematical model which Figure 1
should be flexible as far as the connections are concerned, as well
as effective in managing the problem of time.
This article presents a theoretical framework for modelling the notions of space and time as
well as representing “reality”. The first part examines how our space perception shifts from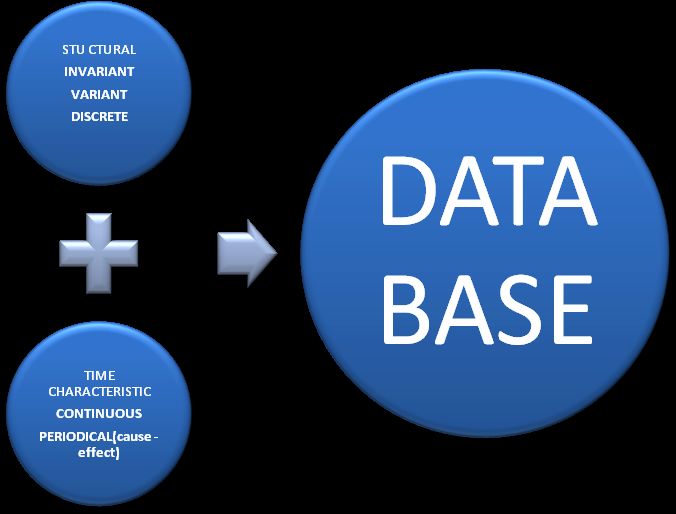
the static present space into a dynamic one that alters. Next a theoretical framework for the
synchronic management of geographical data is presented, which induces the use of a model.
Finally, suggestions on which future research have be based are presented.

Changing our perception of space: space as part of a “scenario”

Space can be perceived and depicted in a static or in a dynamic way. But these two ways in
treating space, lead us to define “distance” on two levels: distance-space and distance-time. In
the first case we refer to a spatial perception that is based on the measured “distance”, while
in the second one we perceive space through the chronological order of events which means
that space is integrated into a “scenario”.

“Distance” - Space
Presently the spatial tools depict space in a given moment and thus create a “virtual reality”.
In other words the user lives and acts inside a certain
spatial context that has instantaneous projection. Our
perception of how space evolves through time (past-
future) is achieved by using multiple designed
projections (graphic projections) of the geographical
space. As a result, the “distance”-space mobilises
visualised entities by synchronising spatial features
(Figure 2). The parameters which are activated in order
to achieve the perception of “reality” in a present
spatial context are:
• The alternation of scale from the partial to the
    holistic approach of space creates the perception of
    unity and promotes a better understanding of the
    relations between multiple objects.
• The integration of different images, maps, aerial
    photos or satellite images, display the chronological               Figure 2
    order of the phenomena and thus convey the notion
    of time.

“Distance”-Time
“Distance” – time depicts space through the use of timelines. In that way it transforms the
spatial “virtual realities” into scenarios (past – present – future). “Distance” - time restructures
the conflictual reality which is the final result of the interaction between time, space and man.
In this time-structure, the objects are placed in relation to:
    • The succession of events (before, afterwards, during)
    • The duration of time intervals (the notions of a bigger or smaller time period -an hour,
         a minute- the notions of regular or irregular rhythm as well as the notions of a faster or
         slower rhythm).
    • The cyclical recurrence of certain periods of time (days, months, seasons)
    • The reversible feature of time (p.e. “this is over… we cannot live that again”)

As a result, in order for a GIS to be a time-space tool, it must reflect and depict the past, the
present as well as the future. In other words, it must be able to manage the above notions.
Otherwise, it must record the perception of the identity and the allocation of subsequent
phenomena that bare similar relationships in time.
Integrating time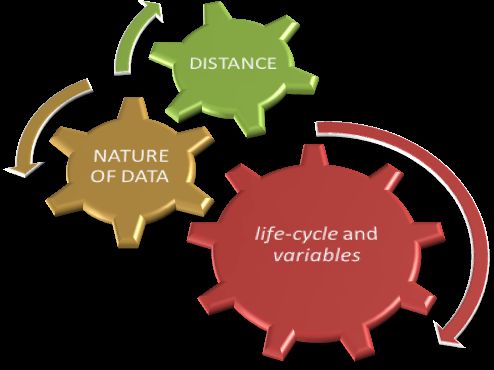
The integration of time is based on the analogy between time and space. Theoretically, the
objects can be depicted on both a spatial and a temporal “dimension”. On a temporal
dimension they are called time-points (lacking dimension-volume), while on a spatial
dimension they are called space-points (points, lines, surfaces). Their management and
measurement refers to the dimensional specification (duration, length, volume) or to the
topological specification (before, after).

A time-managing GIS becomes a system of cognitive depiction per object, meaning a
modelling and exploitative tool of additional knowledge. Its implementation is based on rules
that determine “real” space and it is represented by variables and connections so as to provide
a model for their variation. This type of system, however, should provide a flexible database,
that would enable it to support the connections between the object variations as well as to
express the functionality of space. Therefore, the integration of time into a spatial system
should be treated differently and the emerging problems that need solutions are far more
complex than those posed by the depiction of space. The insertion of time into a spatial
system such as a GIS requires precise definitions and rules that have to be set on the system’s
database and are presented next.

The framework for the new modelling of space and time

A space model must include the rules that permeate the world we live in and perceive it. In
such modelling the following concepts are relevant, in a theoretical framework: the nature of
the data, their “distances”, their life-cycle, their variables and the axes that determine the new
geographic systemic background (Figure 3). In this model this system is represented by one-
dimensional allocations.

With regard to the nature of the data:
This new model consists of two components:
a. Starting from a point of reference, space is
depicted via a three-dimensional Euclidean
space, which contains the concept of “distance”
as a unit of measurement and expresses the
observed measured space. This is a quantitative
space that is geometrically chartered, in total
connection to the mathematical structure.
b. The second component depicts the world as
the result of human actions, thus attributing the
element of “functionality’ to it. These data are
descriptive and statistical and thus qualitative
and one-dimensional. The nature of these data
                                                        Figure 3: The new geographic systemic
is considered to be isotropic, continual and                          background
lacking limitations.

With regard to the “distance”: The new model includes the integration of the dimension of
time that can actually activate the notion of “distance” and thus define the life-cycle of the
objects in the database (registration / destruction). In that way, the registration of data
becomes quantitative and is expressed as a relative position or as the result of observation.
With regard to the systemic background: The new model includes data pertaining to space,
which are organized (inside a certain geo-system) according to the following axes:
horizontally, based on a topological structure, vertically based on their descriptive structure,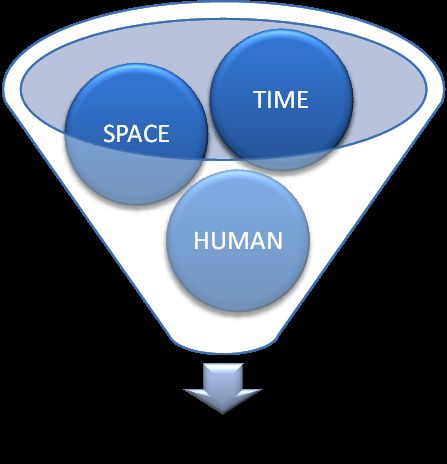
in “depth” based on the “distances” and “forward” in order to describe their dynamic
evolution.

Modelling the objects in the database
The integration of time categorizes the spatial elements according to their life-cycle in the real
world. In other words, the spatial elements acquire a temporal dimension. Those intervals
begin from the moment of their record into the database and their life-cycle continues until
their destruction. In the new model we propose, their life-cycle introduces three types of time-
span, which in their turn define the specific types of objects (Figure 4). Therefore we observe
the continuous objects, the discontinuous-periodical ones and the objects that have an
instantaneous temporal dimension.

The continuous objects are
those objects that exist
constantly. They never cease
to be recorded in the database.
These objects are considered
to be continuous even when
they don’t have a temporal
dimension themselves (life-
cycle), but they possess time -
characteristics        (morphic
elements) as well as structural           Figure 4: New modeling of the objects in the database
elements that alter in time.
The discontinuous-periodical objects are the ones whose life-span is periodical or disrupted.
They are the objects whose life-cycle (birth-destruction) will be recorded in the database and
they remain recorded even after their destruction. In the new model we propose, we should
explicitly illustrate the difference between the objects that possess continuous time-
characteristics (morphic elements) and the discontinuous-periodical ones which appear in the
database only during their life-span. The category representing this type of objects has a time
-characteristic that could be identified as “interval”. The "interval” describes the life-span of
the object.

The objects having an instantaneous time dimension consist of events, natural phenomena,
social phenomena, and so on, that need to be modeled in the database due to their importance.
They are marked on the time axis as a point and this type of object has a time-characteristic
that could be identified to “date”.

Modelling the new variables of data (weight)
In order to express and record in detail the
dynamic feature of an entity, it is essential that we
find a model for the components that defines time
and space. These components are permeated by
certain rules which define the “weight” of their
variables, according to the need of the application
(Figure 5). The entities, therefore, are recorded not
only      according        to     their     life-cycles Figure 5: The new variables of data
(birth/destruction), but we can also make a further (weight)
distinction as far as their variables are concerned. More specifically, the dynamics of an entity
are defined by two types of variables that can function as weight variables.
The entities may consist of variables such as: the time -characteristic (morphic element) and
the structural element. The first variable refers to the notion of time, namely to that
characteristic of the entity that changes. The second one refers to the spatial transformation of
an entity. These two variables may be independent or dependent.
They are independent when they do not influence the structural element of the entity and
dependent when they transform even the structural element. The transition from the
independent to the dependent stems from the “weight” of the time -characteristic (morphic
element).
The first one, the time -characteristic is the variable that alters the description of the entity.
If we further specify this category (time -characteristic) we will find the notion of a
continuous time-variable as well as the notion of cause and effect. The continuous time-
variables describe the entities that remain in a certain condition for a period of time and then
suddenly they change. The notion of “cause and effect” covers these cases where the
structural element no longer exists but its effects continue to exist through time.
Finally, the time -characteristic (morphic element) is rendered by “intervals” and "values”,
where “interval” defines the validity period of the
variable’s value, and “value” defines the measured
value (Figure 6).
The second one, the structural element is the
variable that attributes to the entity its spatial
characteristic. In this category we discern three
types: the invariable, the variable and the discrete
structural elements. The structural element is
represented by the “date” and the “value”, where
“date” defines the time of registration in the
Figure 6: Type of variables
database, and “value” expresses the value of the
structural element.
New types of connections in the database
In order to render the temporality of the entities we
must record in an equally detailed way the
connections in the database. It is clear by now that
the connections formed have to deal with the
“temporal dimension”. A temporal connection that
has a certain life-cycle describes a relationship in the
real world that exists so far as the participant objects
appear, coexist and cease to exist. A typical example
of this is a model that describes two adjacent
buildings through a connection. That connection is
valid only as long as the two buildings coexist. The
destruction of one of the two buildings brings about Figure 7: New types of connection in
the destruction of the connection itself. the database
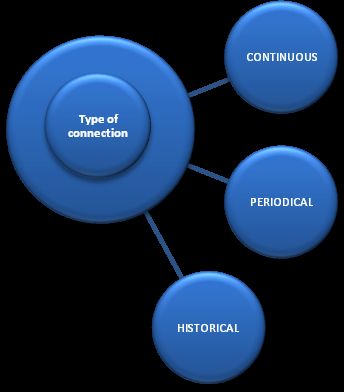
We can detect three types of connections: The long-term connections deal with the
continuous entities. The periodical connections deal with objects where there is at least one
continuous time-characteristic. Finally, an historical connection describes a connection that
continues to exist even after the destruction of the entities that had formed it (Figure 7). More
specifically: a long-term connection describes that kind of connection that is lacking temporal
dimension and whose existence exceeds its life-span in the database. Such a connection may
include various entities but at least one of them must be “continuous”.

The periodical connection describes two kinds of connections: the ones that do have a
temporal dimension but a periodical life-span, and the connections that have a constant time-
span but their life-span is equal to that of the database. The life-cycle of such a connection
cannot exceed the life-span dictated by the life-cycle of the entities in the connection.

The historical connection: The relationships that have a cause and effect type of component
must be represented by such a connection. A typical example would be the modelling of land-
plot development. A connection describing the relationship between adjacent land-plots is a
temporal connection, but it is valid and active only as long as the two land-plots coexist, that
is only as long as the situation remains unaltered. On the contrary, when the parameter of
“cause and effect” comes into place (for example a land-plot is divided into two parts) we
have an historical connection: the fact that a land-plot was divided remains unchangeable
regardless of the life-cycle of the participant objects.

Conclusions and proposals

Through the modelling of entities in timelines, we observe that the depiction of space alters.
An entity recorded as continuous, discontinuous or discrete leaves its mark in space; and that
has multiple consequences and effects. The modelling of connections and time intervals (that
depend on the life-cycle of the entities) will help recover those entities that were damaged or
destructed or may be damaged by time. As a result, both the life-cycle of an entity and the
recording of its variables create a new systemic geographical setting. That very systemic
background is what helps us restructure or “recover” the interdependent spatial entities. In this
way, space becomes part of a “scenario” thus representing the effects of natural phenomena
and human actions in real time.

The proposed ideas on modelling time do not constitute a complete and thorough schema. The
logic behind our model consists in defining the rules that permeate the entities as well as their
interaction. The application of such a model requires a more detailed research in the sector of
planning. Nevertheless, this article constitutes a first attempt to approach the issue by defining
certain essential concepts. The objective of our future research will be to develop a time-space
tool that will enable us to manage complex applications (for example socio-economical) while
representing as much as possible the real world.

References
Page, M., Gensel, J., Capponi,. C., Bruley, C., Genoud, P. , Ziebelin, D., Bardou, D.,
Dupierris, V. A New Approach to Object-Based Knowledge Representation: the AROM
System, Lecture Notes in Artificial Intelligence, 2001.
Weibel, R. and Dutton, G.. Generalizing Spatial Data and Dealing with Multiple
Representations. In: Longley, P, Goodchild, M.F., Maguire, D.J. and Rhind, D.W. (eds.).
Geographical Information Systems: Principles, Techniques, Management and Applications,
Second Edition. Cambridge, GeoInformation International, 1999.

You can also read


