Standard & Poor's Credit Outlook on the U.S. Life Insurance Industry
←
→
Page content transcription
If your browser does not render page correctly, please read the page content below
Standard & Poor's Credit Outlook
on the U.S. Life Insurance Industry
Matt Carroll, CFA
Senior Director
Carmi Margalit, CFA
Director
North American Insurance Ratings

October 28, 2013
Permission to reprint or distribute any content from this presentation requires the prior written approval of
Standard & Poor’s. Copyright © 2013 by Standard & Poor’s Financial Services LLC. All rights reserved.
Agenda

I.   U.S. Life Industry Outlook & Recent Trends
II. Life Insurers’ Sensitivity to Interest Rates
III. Quick update on S&P Insurance Criteria

2
Sector Outlook & Recent
Trends
S&P U.S. Life Insurance Sector Outlook: Stable
• Stable outlooks predominate
• Companies well positioned for the environment
• Strong balance sheets
• Focus shifting from spread to fee type businesses
• Modest use of yield enhancement strategies with
less-liquid and riskier assets
• Most are de-risking and/or re-pricing products post
crisis
• Legacy issues are being addressed
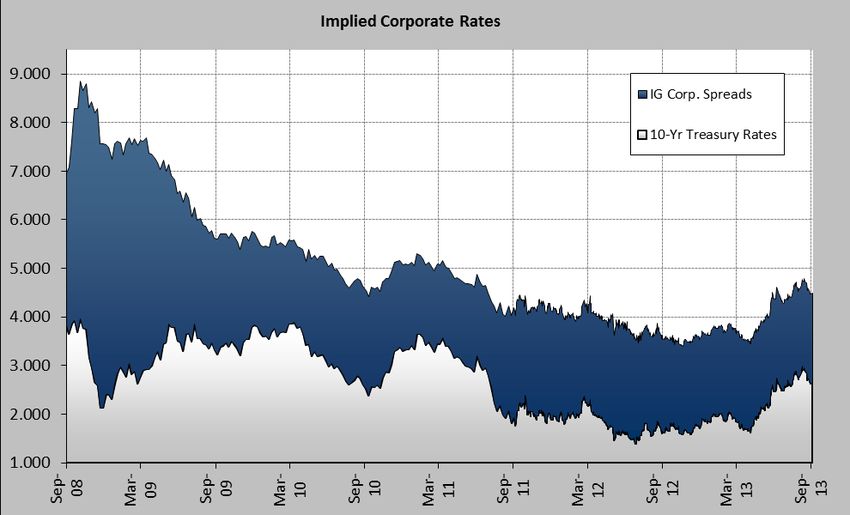
4Implied Investment Grade Corporate Bond
Yields
Source: Standard & Poor’s Ratings Services and Bloomberg
The investment portfolio yield for a typical insurer will generally
range between ‘BBB’ corporate bond yields and ‘A’ corporate
bond yields
5Life Bond Quality: Increase in ‘BBB’ exposure
Life Bonds: Quality
100.0%
3.1% 3.2% 3.7% 3.6% 3.5% 3.3% 3.4% 3.6% 4.0% 3.8%
95.0% 4.3% 4.1% 4.0% 4.4% 4.1% 4.3% 4.0%
5.0%
90.0%
85.0%
22.5% 22.8%
80.0%
24.6% 26.2% 25.0% 24.9% 26.0%
26.9% 28.1% 28.6% 27.0% 27.3% 28.4% 30.8%
28.3%
30.8% 28.7% 29.7%
75.0%
70.0%
65.0%
60.0%
55.0% 72.3% 72.0%
69.3%
66.2% 64.6% 64.3% 68.0% 69.3% 69.3% 67.6%
65.3% 65.5% 65.8% 65.0%
50.0% 61.7% 62.9% 62.9% 62.9%
45.0%
40.0%
1995 1996 1997 1998 1999 2000 2001 2002 2003 2004 2005 2006 2007 2008 2009 2010 2011 2012
NAIC 1 NAIC 2 NAIC 3 NAIC 4 NAIC 5 NAIC 6
Source: Standard & Poor’s Ratings Services
6Life Industry Net Investment Yield (2007-2012)
8.00%
7.00%
6.00%
5.00%
4.00%
3.00%
2.00%
1.00%
0.00%
2007 2008 2009 2010 2011 2012
Life Net Investment Yield Avg. Annual 10-Yr Treasury Yield Avg Annual Implied IG Corporate Rates
Source: Standard & Poor’s Ratings Services
7Economic Forecast
Macroeconomic
Indicators for North
American Insurance
September 2013 FORECAST
Comment/Outlook on Baseline Impact
--Upside--* --Baseline-- --Downside--* ACTUAL baseline forecast on Sector
2013 2014 2013 2014 2013 2014 2012
The poor labor market
continues to keep the Neutral
Real GDP (% change) 2.0 4.5 1.7 2.8 1.3 0.4 2.21 recovery in slow gear.
Federal Funds Rate (%) 0.1 0.8 0.1 0.2 0.1 0.1 0.1 Interest rates expected to
10-yr. Treasury note yield remain low in 2013 then
(%) 2.5 4.4 2.4 2.9 2.2 1.9 1.80 return to 2011 levels in 2014,
Unfavorable
putting downward pressure
on insurers' net investment
'BBB' bond yield (%) 5.10 6.34 4.97* 5.42* 4.61 4.95 4.94 income.
Stocks expected to appreciate
by double digit percentages in
Favorable
S&P 500 Common Stock 2013, benefiting insurer
Index 1,667 2,037 1,622 1,759 1,576 1,509 1,380 capital bases.
Modestly lower
unemployment should benefit
Somewhat
consumer income and
Favorable
confidence and lead to fewer
Unemployment rate (%) 7.4 6..1 7.5 7.0 7.6 8.0 8.07 home foreclosures.
Source: Standard & Poor’s Ratings Services
* June Data
8Rating Distribution: North America Life Insurance
2011 2012 2013
60%
52%
49%
50%
46%
42%
40% 39%
35%
30%
20%
10% 8% 8%
6% 6%
4% 4%
0% 0% 1%
0%
AAA AA A BBB Lower
Currently representing ratings of 83 interactively-rated companies and groups, as of July 2013, Dec. 2012 and Dec. 2011
Source: Standard & Poor’s Ratings Services.
9Rating Trends: North America Life Insurance
7 7 6 7 7
4 5 5 4
2 3
0 1 0
-5 -3 -4
-6 -5
-10 -10 -9
-11
-13
-17
-22
-26
-28
2000 2001 2002 2003 2004 2005 2006 2007 2008 2009 2010 2011 2012 2013
Upgrades Downgrades
Rating actions within a given year; 2013 represents year-to-date totals to July 31, 2013
10Rating Outlooks: North America Life Insurance
CreditWatch Outlook Outlook Outlook Outlook
Negative Negative Stable Developing Positive
2011 6% 7% 80% 7%
1%
2012 1% 23% 72% 2%
4%
2013 8% 86% 2%
0% 10% 20% 30% 40% 50% 60% 70% 80% 90% 100%
Currently representing ratings of 83 interactively-rated companies and groups, as of July 2013, Dec. 2012 and Dec 2011
11Life Insurers’ Sensitivity to Interest Rates
Life And Annuity Interest Rate Sensitivity

Individual fixed annuity and universal life products are the most
sensitive to both rising and falling rates.
13
Life Insurers’ Revenue And Margins

                   $900                                                                                                                         24%

                   $800
                                                                                                                                                18%
                   $700
                                                                                                                                                12%
In billions

                   $600

                   $500                                                                                                                         6%

                   $400                                                                                                                         0%
                   $300
                                                                                                                                                -6%
                   $200
                                                                                                                                                -12%
                   $100

                     $0                                                                                                                         -18%
                                    2007                        2008         2009              2010           2011                 2012

                                     Pre-Tax Operating Income          Revenue      Net Underwriting Margin   Net Inv. Income as % of Revenue

                   Source: Standard & Poor’s Ratings Services

              The negative impact of prolonged low interest rates on insurers
              earnings and profitability could become more pronounced over
              time as investment portfolios turn-over.
              14
Pain Points For Life Insurers If Interest Rates Spike
• Surrenders on products like FA and UL are likely to increase
when policyholders exchange contracts for competing
products with higher new money rates.
o Likely to react the fastest are sophisticated institutional clients holding
GIC, BOLI, or COLI policies) will likely respond quickly to an interest rate
spike.
o Mortality could deteriorate on some products, such as UL, because
healthier insured policyholders are better positioned to be re-underwritten
on new policies.
• Insurers could incur significant capital losses if they are
forced to sell investments at depressed values in order to
meet demands for surrenders.
• Prepayments on residential mortgages would likely slow,
causing RMBS to extend and delay insurer’s ability to deploy
principal into higher-yielding assets.
15
.Potential Benefits Of An Interest Rate Spike • Investment income could increase, particularly for long-tailed in force lines such as long-term care (LTC) and long-term disability (LTD) insurance. • The net present value of pension obligations could be reduced through higher discount rates. 16
Unrealized Gains/Losses Reflect Movements
In Interest Rates
                       20,000
                                                                         Life Industry
                       10,000

                              0
 In millions ($)

                      (10,000)

                      (20,000)

                                                                                                                        Life Industry
                      (30,000)

                      (40,000)

                      (50,000)

                      (60,000)
                                    2002      2003       2004   2005   2006   2007   2008   2009   2010   2011   2012

            Source: Standard & Poor’s Ratings Services

A spike in interest rates could erode current high levels of
unrealized gains and GAAP equity.
17
Closing Thoughts
• Insurers are generally well positioned to cope
with most interest rate scenarios
• Our base case economic scenario assumes a
modest rise in interest rates
• Generally, a more significant rise in rates, as
contemplated by upside scenario, would be
favorable
• A spike in interest rates, which we don’t
expect, could hurt the industry from:
• Unrealized losses on investments
• Disintermediation on life and annuity products
• Potential realized investment losses
18Revised S&P Insurance Criteria
Scope of Insurance Criteria Revisions
                                                 Scope

                       Includes                                         Excludes

     • Life & Health      • Trade Credit                 • Bond Insurers
       Insurers             Insurers
                                                         • Insurance Brokers
     • Property/Casualty • Marine P&I Clubs
       Insurers                                          • Mortgage and Title Insurers
                          • Start-ups and
     • Multiline Insurers   Run-off situations

     • Reinsurers         • PI Ratings

20
Key Messages • Framework of rating methodology is evolutionary • Fundamental view of risks and analysis is not changing • Enhances transparency and specificity of insurance criteria • Enhances comparability of insurance ratings through clear, coherent and globally consistent criteria framework • More explicitly forward-looking • More explicitly reflecting comparative analysis 21
New Criteria Framework

22
Criteria Framework – Anchor Score
Matrix
      Table 1: Anchor
                                                         Financial risk profile (from table 12)

       Business risk
     profile (from table Extremely Very                 Moderately Upper    Lower    Less than           Very    Extremely
              3)                            Strong                                             Weak
                         strong    strong               strong     adequate adequate adequate            weak    weak

     Excellent            aa+        aa       aa-          a+         a         a-      bbb+      bbb-     N/A      N/A

     Very Strong          aa        aa-     aa- or a+    a+ or a      a         a-       bbb      bb+      bb       N/A

     Strong               a+      a+ or a    a or a-        a-        a-      bbb+       bbb      bb+      bb-       b+

     Satisfactory       a or a-      a-        a-         bbb+       bbb+      bbb       bbb-     bb       bb-       b

                                            bbb+ or
     Fair                bbb+      bbb+                    bbb       bbb       bbb-      bb+      bb       b+        b
                                              bbb
     Vulnerable          bbb-       bbb-      bbb-         bb+       bb+       bb+        bb      bb-       b        b

     Highly
                          bb-       bb-       bb-          bb-       bb-       bb-        b+       b        b    b- or lower
     vulnerable

23
Thank You Matt Carroll, CFA Senior Director T: 212.438.3112 Matthew.Carroll@standardandpoors.com Carmi Margalit, CFA Director T: 212.438.2281 Carmi.Margalit@standardandpoors.com Permission to reprint or distribute any content from this presentation requires the prior written approval of Standard & Poor’s. Copyright © 2013 by Standard & Poor’s Financial Services LLC. All rights reserved.
Copyright © 2013 by Standard & Poor’s Financial Services LLC. All rights reserved.

No content (including ratings, credit-related analyses and data, valuations, model, software or other application or output therefrom) or any part thereof (Content) may be modified,
reverse engineered, reproduced or distributed in any form by any means, or stored in a database or retrieval system, without the prior written permission of Standard & Poor’s
Financial Services LLC or its affiliates (collectively, S&P). The Content shall not be used for any unlawful or unauthorized purposes. S&P and any third-party providers, as well as their
directors, officers, shareholders, employees or agents (collectively S&P Parties) do not guarantee the accuracy, completeness, timeliness or availability of the Content. S&P Parties
are not responsible for any errors or omissions (negligent or otherwise), regardless of the cause, for the results obtained from the use of the Content, or for the security or
maintenance of any data input by the user. The Content is provided on an “as is” basis. S&P PARTIES DISCLAIM ANY AND ALL EXPRESS OR IMPLIED WARRANTIES,
INCLUDING, BUT NOT LIMITED TO, ANY WARRANTIES OF MERCHANTABILITY OR FITNESS FOR A PARTICULAR PURPOSE OR USE, FREEDOM FROM BUGS,
SOFTWARE ERRORS OR DEFECTS, THAT THE CONTENT’S FUNCTIONING WILL BE UNINTERRUPTED OR THAT THE CONTENT WILL OPERATE WITH ANY SOFTWARE
OR HARDWARE CONFIGURATION. In no event shall S&P Parties be liable to any party for any direct, indirect, incidental, exemplary, compensatory, punitive, special or
consequential damages, costs, expenses, legal fees, or losses (including, without limitation, lost income or lost profits and opportunity costs or losses caused by negligence) in
connection with any use of the Content even if advised of the possibility of such damages.

Credit-related and other analyses, including ratings, and statements in the Content are statements of opinion as of the date they are expressed and not statements of fact. S&P’s
opinions, analyses and rating acknowledgment decisions (described below) are not recommendations to purchase, hold, or sell any securities or to make any investment decisions,
and do not address the suitability of any security. S&P assumes no obligation to update the Content following publication in any form or format. The Content should not be relied on
and is not a substitute for the skill, judgment and experience of the user, its management, employees, advisors and/or clients when making investment and other business decisions.
S&P does not act as a fiduciary or an investment advisor except where registered as such. While S&P has obtained information from sources it believes to be reliable, S&P does not
perform an audit and undertakes no duty of due diligence or independent verification of any information it receives.

To the extent that regulatory authorities allow a rating agency to acknowledge in one jurisdiction a rating issued in another jurisdiction for certain regulatory purposes, S&P reserves
the right to assign, withdraw or suspend such acknowledgement at any time and in its sole discretion. S&P Parties disclaim any duty whatsoever arising out of the assignment,
withdrawal or suspension of an acknowledgment as well as any liability for any damage alleged to have been suffered on account thereof.

S&P keeps certain activities of its business units separate from each other in order to preserve the independence and objectivity of their respective activities. As a result, certain
business units of S&P may have information that is not available to other S&P business units. S&P has established policies and procedures to maintain the confidentiality of certain
non-public information received in connection with each analytical process.

S&P may receive compensation for its ratings and certain analyses, normally from issuers or underwriters of securities or from obligors. S&P reserves the right to disseminate its
opinions and analyses. S&P's public ratings and analyses are made available on its Web sites, www.standardandpoors.com (free of charge), and www.ratingsdirect.com and
www.globalcreditportal.com (subscription), and may be distributed through other means, including via S&P publications and third-party redistributors. Additional information about our
ratings fees is available at www.standardandpoors.com/usratingsfees.

STANDARD & POOR’S, S&P, GLOBAL CREDIT PORTAL and RATINGSDIRECT are registered trademarks of Standard & Poor’s Financial Services LLC.
You can also read