Determining Site-Specific Parameters for Living Shoreline Design
←
→
Page content transcription
If your browser does not render page correctly, please read the page content below
Organized By

                                                        C. Scott Hardaway, Jr.
                                                        Donna Milligan
                          Pre-Workshop Learning
                                                        Shoreline Studies Program
      Determining Site-Specific Parameters for
             Living Shoreline Design                    Karen Duhring

                               Presented by             Center for Coastal
                              Donna Milligan            Resources Management

                                                            March 2021
This project was funded by the Virginia Coastal Zone
Management Program at the Department of Environmental
Quality through Grant # NA19NOS4190163 Task 92.02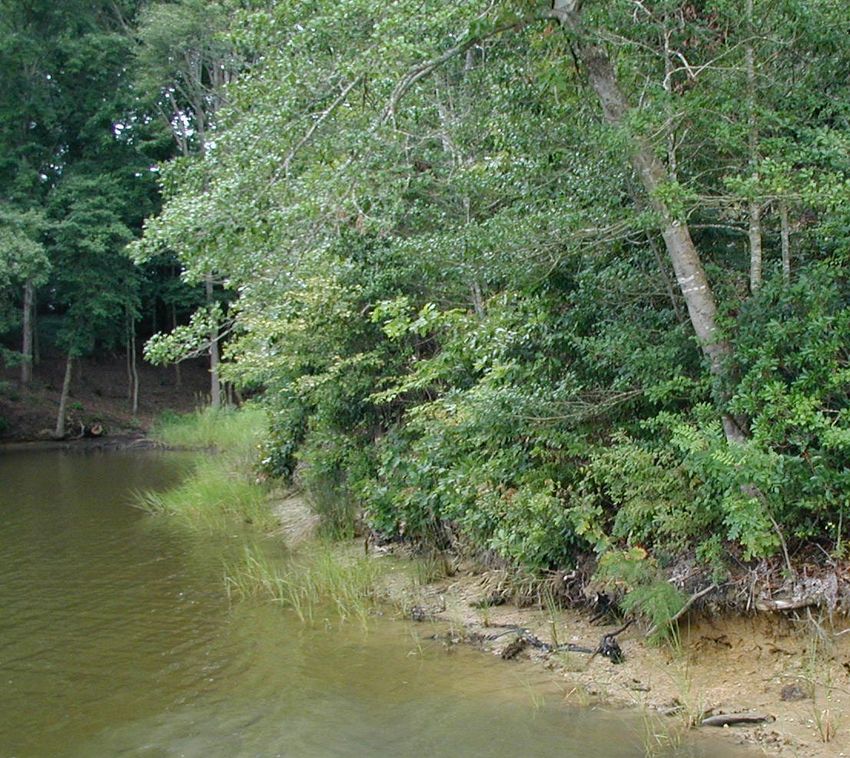
The goal of this presentation is to demonstrate the tools that are
available for effective living shoreline design in Chesapeake Bay.
Each shoreline professional has a method for conducting site
evaluations

This presentation has suggestions and tools for standardized data
collection

Not all parameters have equal weight, professional judgment
necessary

A site evaluation worksheet is provided in Appendix A of the Living
Shoreline Design Guidelines https://scholarworks.wm.edu/reports/833/
Desktop or Map Parameters      Site Visit Parameters
Existing information        Site-specific characteristics
available from maps or
Internet resources          Local setting
Not readily visible or      Not easily captured by
measurable at ground        remote sensing
level
Search for your
                                                                       site by street
                                                                       address
                             https://www.google.com/earth/

Google Earth can be used to determine many of the desktop site parameters.

Several versions are available for free: https://www.google.com/earth/versions/

Google Earth Pro: Available for free download to your desktop and provides the
most functionality. Create maps with advanced tools.

Google Earth: Available from anywhere on the web

Google Earth Mobile: Allows you to view maps and Google Earth files (*.kmz or
*.kml) on your mobile device. Not particularly intuitive, but it can be handy.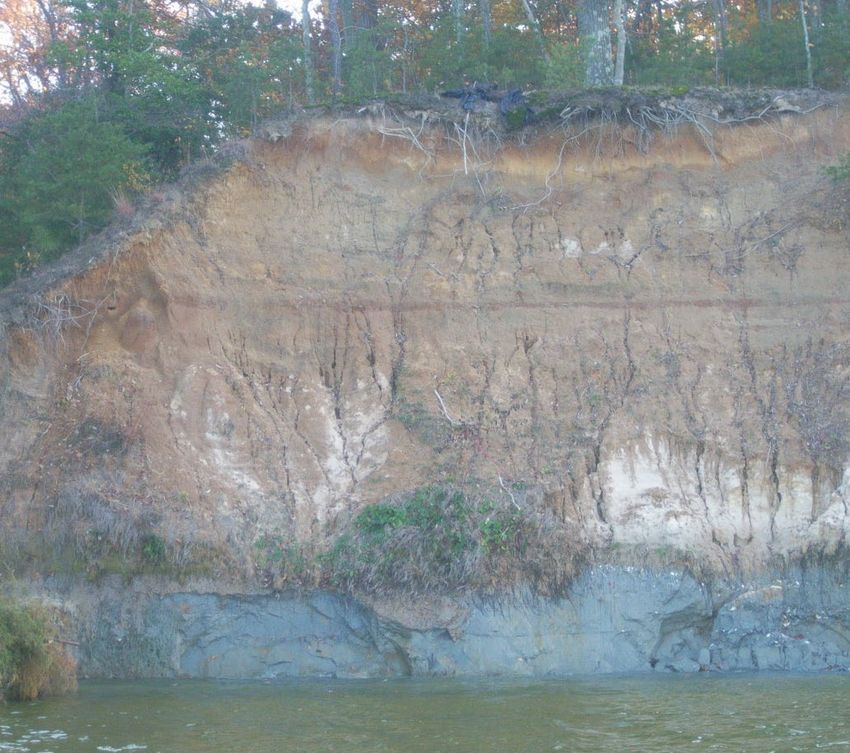
Shoreline orientation – Google Earth
Fetch - Google Earth measuring tool
Shore Morphology - Google Earth
Depth Offshore – NOAA nautical charts
Nearshore Morphology - use Google Earth
Submerged Aquatic Vegetation – VIMS SAV online viewer
Tide Range – Use Shoreline Studies Program’s Google Earth file
Storm Surge – FEMA Flood Insurance Studies
Erosion Rate - Use Shoreline Studies Program’s online viewer or Google
Earth’s time slider
Design Wave – VDOT shore protection graph
Sea-Level Rise – USACE curve generator
Rule of thumb, not
                  always a determining
                         factor

Good lighting
                    Poor lighting

       South    North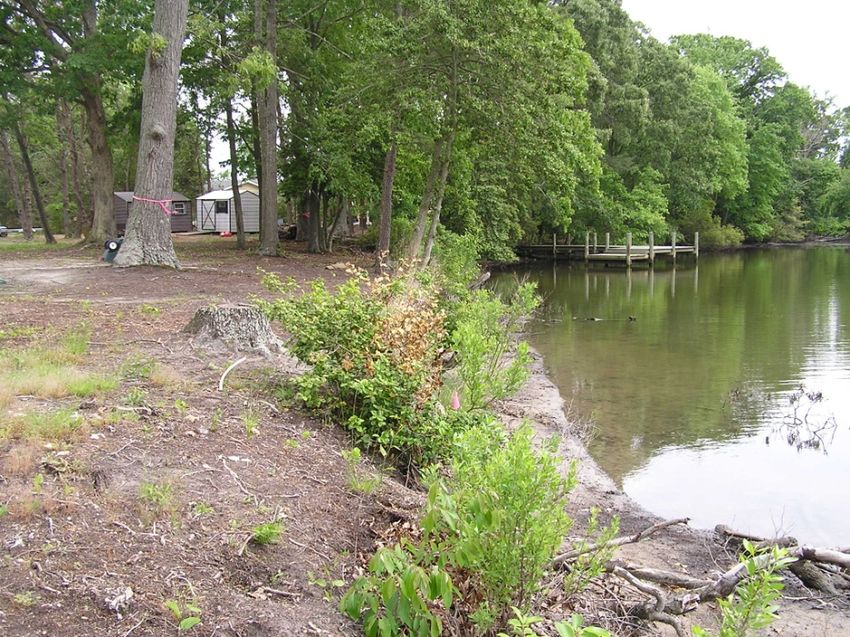
• Length of water over which a given wind can blow
  without obstruction.

• It is a proxy measure for wind/wave energy
  impacting the shoreline.

• The larger the fetch, the more energy potentially
  impacting the shoreline.

                              Longest Fetch
                               black lines

                             Average Fetch
                            measure 5 green
                             arrow vectors
                              and take an
                                average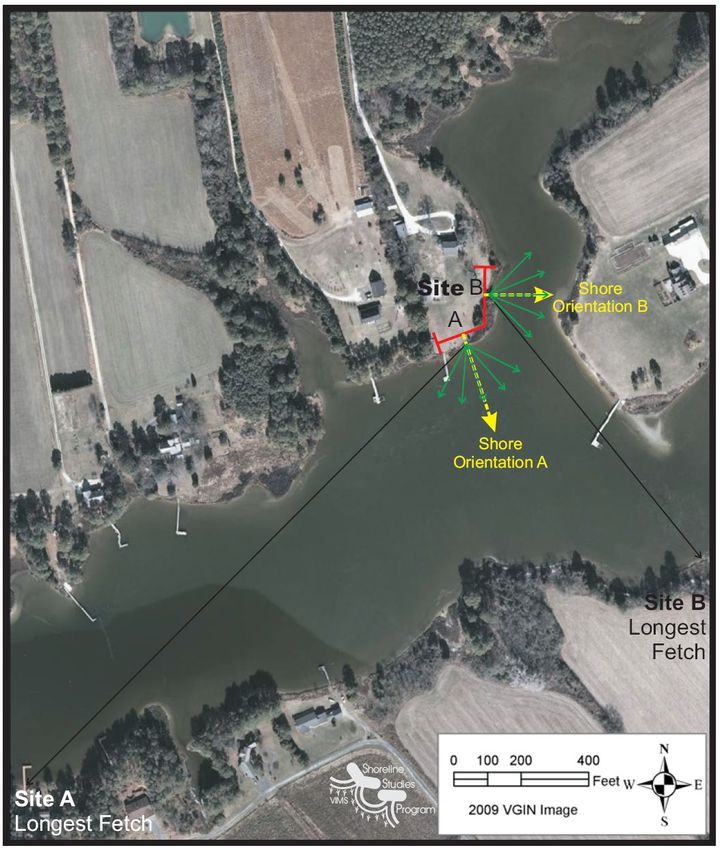
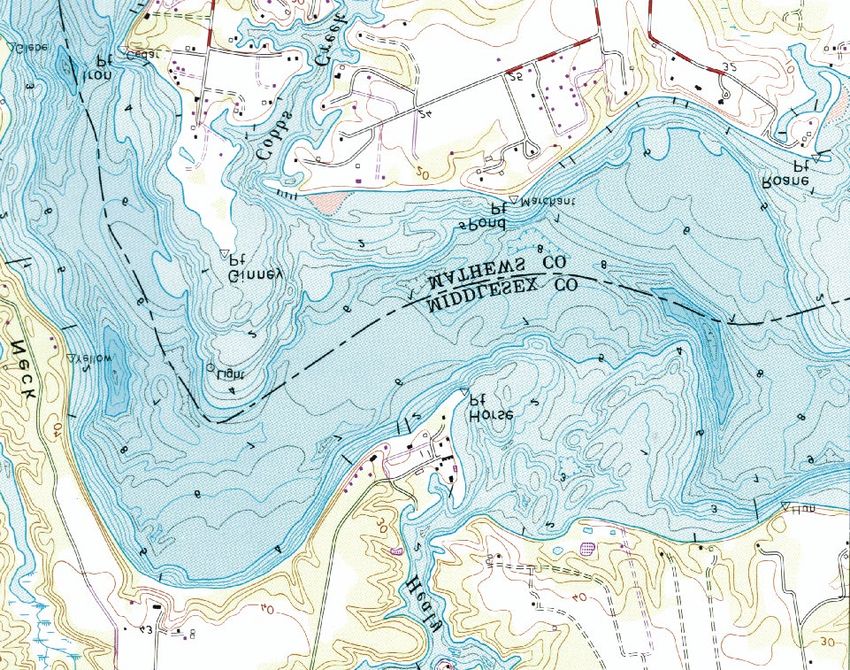
Measured parameters include average fetch (AF=(F1+F2+F3+F4+F5)/5) and longest fetch. Also shown
is shore strike from which the wind/wave window for fetch and shore orientation are established
(Hardaway & Byrne, 1999). Shore orientation in this case is about due north.

        LONGEST   FETCH
         FETCH      2
                                                          Average Fetch Length Categories
                                   FETCH     FETCH
     FETCH                           4         5
       1                                                  Very low 15 miles

                                                          Hardaway & Byrne, 1999
                                                          https://scholarworks.wm.edu/reports/581/
                          SHORE
                          STRIKE
• Pocket or embayed shorelines tend to cause
waves to diverge and spread wave energy
out.
• Straight and headland shorelines receive the
full impact of the wave climate.
• Irregular shorelines tend to break up wave
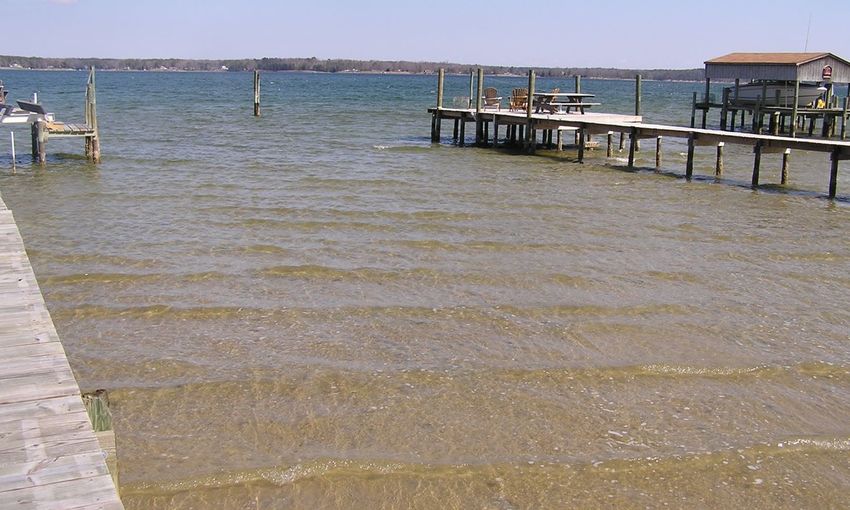
crests.A broad shallow
nearshore has different
wave attenuation than
narrow deep water with
same fetch
6 ft contour
lines
NOAA Nautical Charts
https://nauticalcharts.noaa.gov/Presence or absence of nearshore tidal flats
and sand bars indicate sand supply, bottom
conditions
Important consideration for sills and
breakwaters
Hard supportive substrate vs. soft, fine-
grained sediment
The nearshore morphology often can be determined in Google Earth or during a site visit.Shallow sand flat with Submerged Aquatic Vegetation (SAV) Google Earth Imagery
VIMS SAV online viewer
 displays species and
 densities by year

  Click on Layer List to
  change viewer options

https://www.vims.edu/research/
units/programs/sav/access/map
s/index.php
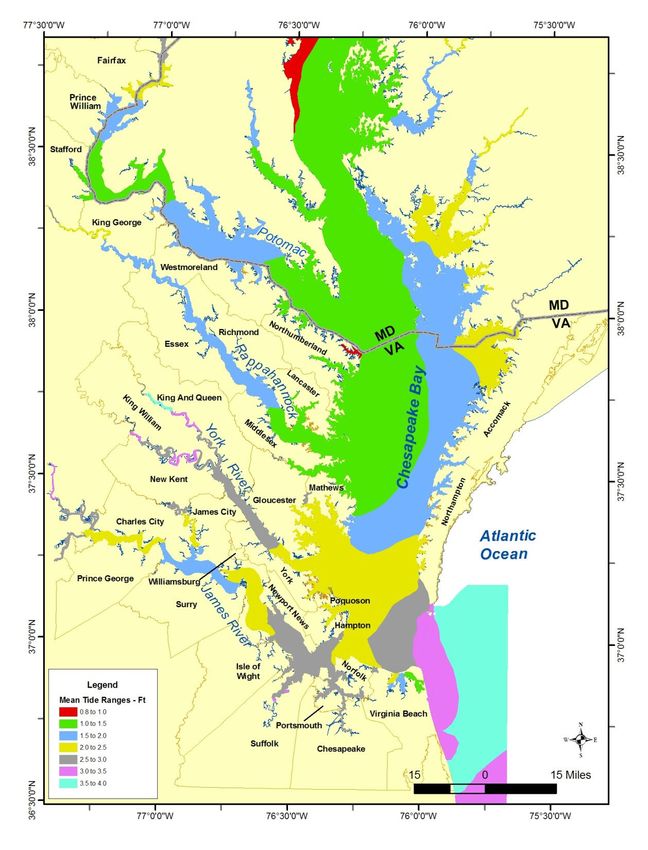
NOAA provides access to a great deal of marine data necessary for shore
    protection design. Knowing the mean tide range and spring tide range are
    critical information for planted marshes. Knowing the tide level at the time of
    the site visit (whether tide is running higher or lower than normal for example)
    is important to understanding the site.

Click on map for your state
Click on closest tide gauge
                                                           https://tidesandcurrents.noaa.gov/
Click on the “More Data” down arrow to access
verified water levels, tide predictions, datums,
meteorological data, sea-level trends, and other
information.
Google Earth files are available to determine mean
and spring (great diurnal) tide ranges in feet. The
files can be downloaded from the SSP website and
opened in Google Earth Pro.
Click on a polygon near your tide to get the data.
The maps also are printed in the Living Shoreline
Design Guidelines
Polygons interpolated from NOAA data points
https://www.vims.edu/research/departments/physi
cal/programs/ssp/shoreline_management/living_sh
orelines/class_info/index.phpUsing the advanced search option on
Predicted water level during certain storms the FEMA Flood Map Service Center,
Return frequencies – probability of repeating select the state, county and all
jurisdictions
100-yr storm = 1% chance
50-yr storm = 2% chance
25-yr storm = 4% chance
water level will occur in any given year
FEMA Flood Insurance Studies web site
https://msc.fema.gov/portal/advanceSearchhttps://msc.fema.gov/portal/advanceSearch
3. Find the transect location map
and determine the closest transect
1. Using the advanced search option
to your site.
on the FEMA Flood Map Service Center,
select the state, county and all
jurisdictions
2. In the search results, select
“Effective Products”, then “FIS
Reports”. Download the document.https://msc.fema.gov/portal/advanceSearch
4. The transect data table lists the wave height and period for the
predicted 100 year storm (1%) and the stillwater elevations for the
10-yr (10%), 50-yr (2%), 100-yr (1%), and 500-yr (0.2%) storms.
The elevation data is relative to the North American Vertical Datum (NAVD88). In Virginia, NAVD88
generally is around a mid-tide level. To convert the NAVD88 elevations to a local tide level (mean low
water), SSP has developed a Google Earth Pro tool. It is available for download on the SSP website
https://www.vims.edu/research/departments/physical/programs/ssp/shoreline_management/living_s
horelines/class_info/index.phphttps://www.vims.edu/research/departm ents/physical/programs/ssp/gis_maps/in dex.php
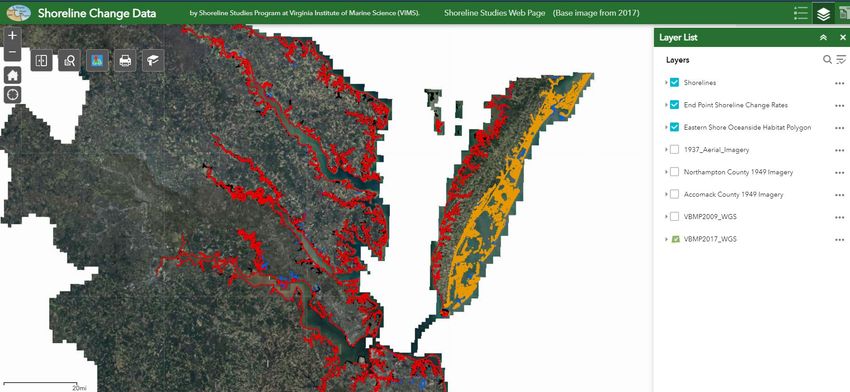
The rate of change has been calculated
between 1937 and 2009 for most of the
Virginia portion of Chesapeake Bay. It is
represented by dots offshore of the
shoreline.

Using the layer list, the shorelines,
1937/38 images, and rates of change
can be turned on and off.

Sites can be found by searching by
address

If the 1937/38 image is turned on, the
swipe tool can be used to view change
Significant wave heights                   Predicted waves may be
   are the average of the                     more or less than actual
   highest 33% of the                         storm wave
   wind/wave field
                                              Many sophisticated wave
   Wave heights for the                       prediction models can be
   highest 10% should be                      used
   noted to determine rock
   size.                                      Simple method uses
                                              forecasting curves

The FEMA 100-yr storm predicted wave may not be practical for shore protection design.
Projects designed to this elevation may be too costly.
Interpolate on the graph to estimate wave height and period based on wind speed, duration, and fetch length. Other options are available to determine a design wave, but the VDOT method for determining wave height for shore protection is readily available and easy. http://www.virginiadot.org/business/locdes/hydra- drainage-manual.asp Chapter 13: Shore Protection, Pg 30
The projected rise in mean sea level is a concern for management of the coastal zone in
the longer term. The potential impacts of sea level rise over time include:
• Higher projected storm surge and inundation levels.
• Landward recession or erosion of shorelines. Depending on the rate and scale of sea
   level rise, the environmental, social and economic consequences or shoreline recession
   within low lying inter-tidal areas, in particular, may be significant in the medium to
   long term.
• Salt water intrusion and landward advance of tidal limits within estuaries. This may
   have significant implications in the medium to long term for freshwater and salt water
   ecosystems and development margins, particularly building structures and foundation
   systems within close proximity to the shoreline.

When sea levels rise, even a small increase can have devastating effects on coastal
habitats farther inland, it can cause destructive erosion, wetland flooding, aquifer and
agricultural soil contamination with salt, and lost habitat for fish, birds, and plants.
Use the USACE sea-
level rise change
curve calculator to
determine SLR near
your site.

Input project
parameters and
the curve is
created below.

https://cwbi-
app.sec.usace.army.
mil/rccslc/slcc_calc.
html
Only 10 active NOAA tide gauges
  occur in Chesapeake Bay

  They are typically located near the
  mouth of the rivers flowing into the
  Bay.

  Pick the one closest to your site.

  The resulting curves show the low,
  intermediate, and high predicted
  changes in sea level. Uncertainty
  exists about how fast SL will rise in
  the future.
https://cwbi-
app.sec.usace.army.mil/rccslc/slcc_calc.html
Additional data on these parameters are discussed in the Living
                  Shoreline Design Guidelines
          https://scholarworks.wm.edu/reports/833/
Site boundaries
Site characteristics
RPA Buffer
Bank condition
Bank height
Bank composition
Shore zone
width and elevation
Backshore zone
width and elevation
Existing shoreline defense structures
Boat wake potentialSite Boundaries Site Characteristics
Legal property limits Current and future upland land use
In addition to talking to the Locate visible and invisible
homeowner and looking for boundary improvements
markers, many localities have their Primary and accessory
parcel data available online which structures
shows the actual extent of the Underground utilities
property.
Drainfields
Determines where end effects and
downdrift impacts should be Groundwater wells
considered Presence or absence of improvements
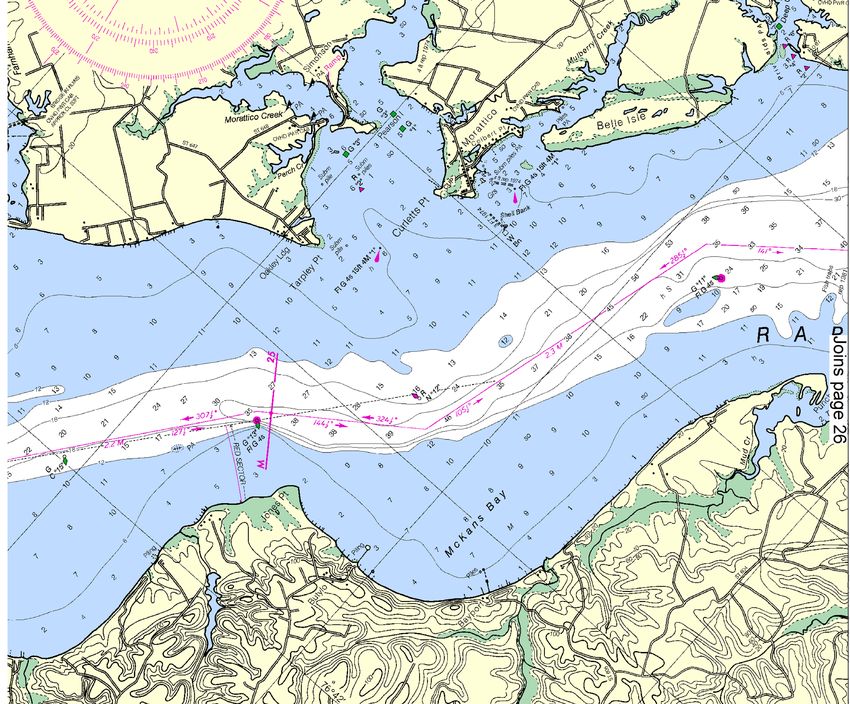
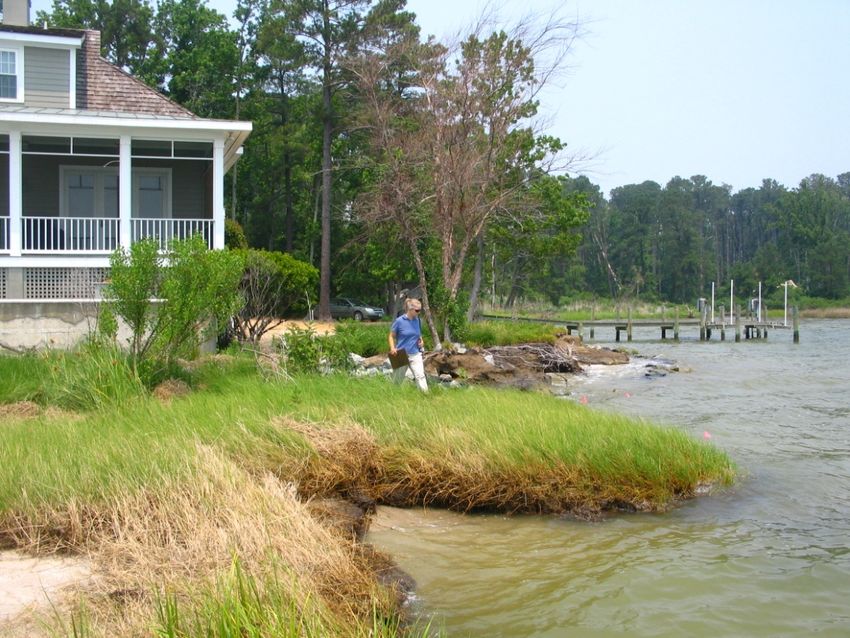
Construction access options revealed determines level of protection neededA stable base of bank and bank face
that has been graded and planted with
vegetation. James River, Virginia
An unstable base of bank and bank face.
The different colored layers indicates
different types of material. Piankatank
River, Virginia
An undercut bank on the East River, Virginia.Top of Bank
Bank Heignt
Base of bankDensely Vegetated / Forested Previously Cleared Does vegetation cover contribute to erosion protection or problem? Should the bank be graded or not ? Is the absence of vegetation due to active erosion or previous land disturbance?
Existing tidal wetland           Measure width of each feature in
        Non-vegetated            profile on previous page
        Salt or freshwater marsh
        Cypress trees            Identify plant species, jurisdictional
                                 limits
Existing sand beach
        Intertidal beach          Do existing beach and marsh
                                  contribute to erosion protection?

Combination
                             Can they be temporarily disturbed
      Patchy marsh headlands or enhanced?
      with pocket beaches
Existing high marsh Measure width of each feature in
Saltmeadow hay profile
Phragmites
Salt bushes Identify plant species, jurisdictional
Existing supratidal beach > limits
MHW
Overwash sand Do existing features contribute to
Primary & secondary erosion protection?
dune features
Backshore terrace Can they be temporarily disturbed
Bank slumping or enhanced?
Upland grasses and treesBoat wake effects are difficult to determine. However, often the homeowner can provide information for this assessment. High boat traffic in narrow waterways will produce severe wave climate not indicated by other parameters (fetch) Presence or absence of docks, marinas, marked channels Local knowledge and judgment calls are required to weigh this parameter
Target Shoreline                Adjacent Shoreline
Serviceable or failing            Consider effects on structural
                                  integrity
Contributing to erosion
protection or problem ?           Opportunities for reach-based
                                  solutions?
Failed structures indicate wave
climate, other design
alternatives
Combine all parameters for site-specific conditions
Are all parameters weighed equally?
Consider how integrated habitats can influence shore protection,
water quality and habitat functions
Each element in the system works to reduce wave energy
impacting the uplandFirst consider if any action is needed at all. If No Action is not acceptable, what is the least impacting solution to solve the particular erosion problem?
Maximum wind-wave climate          Design storms
expected
                                          10 yr
                                          25 yr
Amount of risk or damage
                                          50 yr
property owner is willing to
accept                                    100 yr

Balanced with cost-effectiveness   Set elevations against eroding
                                   upland bank so that storm
                                   waves do not undercut the
                                   bank.
Landward Channelward
Bank grading Non-vegetated to vegetated tidal
Tree removal wetland
Upland conversion to tidal Shallow water conversion to
wetlands stone and vegetated marsh
SAV
Sand movement & navigation
channels
Shellfish lease areas
https://webapps.mrc.virginia.go
v/public/maps/chesapeakebay_
map.phpYou can also read