Three attempts of earthquake prediction with satellite cloud images
←
→
Page content transcription
If your browser does not render page correctly, please read the page content below
Nat. Hazards Earth Syst. Sci., 13, 91–95, 2013
www.nat-hazards-earth-syst-sci.net/13/91/2013/                                                   Natural Hazards
doi:10.5194/nhess-13-91-2013                                                                           and Earth
© Author(s) 2013. CC Attribution 3.0 License.                                                   System Sciences

Three attempts of earthquake prediction with satellite cloud images
G. Guangmeng and Y. Jie
Remote Sensing Center, Nanyang Normal University, China

Correspondence to: G. Guangmeng (guogm@igsnrr.ac.cn)

Received: 4 June 2012 – Revised: 21 December 2012 – Accepted: 22 December 2012 – Published: 22 January 2013

Abstract. Thermal anomalies detected from satellite data are      appearance, the quakes happened close the clouds and the
widely reported. Nearly all the anomalies are reported after      faults.
the quake. Here we report three earthquake predictions in            On one hand, earthquake short time prediction is consid-
Italy and Iran according to satellite cloud anomalies. These      ered extremely difficult and controversial; on the other hand,
cloud anomalies usually show a linear pattern, stay there         many scientists try to study the anomalies before earthquake,
for hours and do not move with winds. According to these          such as the ionosphere TEC anomaly before the earthquakes
anomalies, we can give a rough estimation about impending         in China, Japan, Indonesia and Haiti (Liu et al., 2004), ther-
earthquake activities. All the estimated dates and magnitudes     mal anomalies before the earthquakes in India, Iran, China
are in good agreement with the earthquake facts, and the only     and Italy (Qiang et al., 1991, 1992; Tronin, 2000; Saraf and
unsatisfactory point is that the distance error is 100–300 km.    Choudhury, 2005; Choudhury et al., 2006; Ouzounov et al.,
Because the cloud anomaly is long, we can not reduce the          2006, 2007) and the radon anomaly before the earthquake in
distance error further. A possible way is to combine geophys-     Japan (Yumi et al., 2006). Nearly all the anomalies are re-
ical data and satellite data together to estimate the epicenter   ported after the quake, not before the quake, and this leads to
and this will increase the prediction accuracy.                   questions why people can not predict earthquakes according
                                                                  to these anomalies. Here we report 3 earthquake prediction
                                                                  examples according to satellite cloud image. Such kinds of
                                                                  work are seldom reported. A possible reason may be that sci-
                                                                  entists are limited in different disciplines. For example me-
1   Introduction
                                                                  teorologists who are familiar with geostationary satellite im-
                                                                  age do not study earthquake activity, and geologists who are
In 1997 Russian scientist Morozova found some abnormal            familiar with earthquake activity do not study meteorology
linear clouds above an active fault (Morozova, 1997). This is     activity. This awkward situation limits the progress in earth-
the first report that clouds may have some relation with ge-      quake prediction research.
ological activity. In 1999 Shou considered that some strange
clouds were related with earthquake. He predicted some
earthquakes according to the cloud precursors and reported        2   Data and method
them to the USGS and had some success (Shou, 1999). In
2008 Guo and Wang (2008) studied a cloud anomaly be-              Here geostationary satellite imagery with 1 h temporal res-
fore the M = 6.8 Bam earthquake of 26 December 2003               olution is used. Its resolution is enough to monitor the
(Guo and Wang, 2008). In that paper some strange clouds           cloud continuous movement. Polar orbit satellite data such as
were observed before this and other Iran earthquakes. Wu          AVHRR or MODIS can not do this, because their temporal
et al. (2009) reported two abnormal linear clouds before          resolution is about 12 h, and sometimes the cloud anomaly
M = 8.0 Wenchuan Earthquake of China (Wu et al., 2009).           existed less than 10 h. So they will not detect such anomaly.
These clouds showed an abnormal pattern, they stayed over         In current preliminary stage there is no formula or equation
the main geology fault for hours, and did not move with the       can be used to quantify such cloud anomaly. Our new de-
wind. Until now none meteorological theory can explain this       veloped method is combining the cloud image series into
phenomenon. Several days or months later after the clouds         a computer animation, and then running this animation. In

Published by Copernicus Publications on behalf of the European Geosciences Union.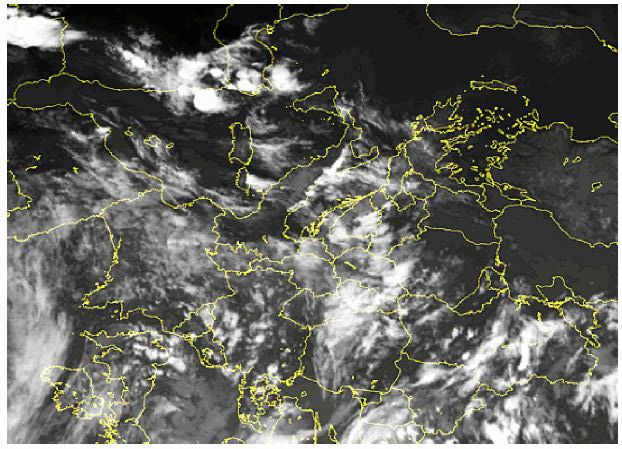
92                                                       G. Guangmeng and Y. Jie: Three attempts of earthquake prediction

                    April 22 18:00UTC                                                               April 22 22:00UTC

                     April 22 20:00UTC                                                                April 23 00:00UTC

Fig. 1. Geostationary satellite image         of   Europe   from
22 April 18:00 UTC to 23 April 02:00 UTC.

the normal situation, the cloud will move fluently in the sky,
except when the clouds are affected by an active fault, the
clouds shape will change and pause sometime, while the nor-
mal cloud is still moving. According to this change we can
identify the abnormal clouds.

3    The Italy earthquake prediction

On 22 April 2012, a linear cloud appeared over eastern
                                                                                                 April 23 02:00UTC
Italy. Figure 1 shows the cloud movement from 22 April,
                                                                     Figure 1. Geostationary satellite image of Europe from April 22, 18: 00 UTC to April
18:00 UTC to 23 April, 02:00 UTC. The straight linear cloud         Fig. 1. Continued.
appeared on April 22, 18:00 UTC, it spread from central Italy        23, 02:00 UTC

to south Italy, about 200 km long and it nearly coincided with
the main thrust fault of Italy. At 20:00 UTC, the cloud be-
came wider, while its left edge was still there and did not         the clouds were moving except this linear cloud over Italy. A
move. On 23 April, 00:00 UTC, the left edge was very clear          similar but small cloud also existed over north of Greece.
and it looked like cut with a knife. It stayed in-place for about     We know that in normal situations clouds should move
8 h, and did not move with winds. In the whole of Europe, all       with winds continuously, while in this image, the cloud

Nat. Hazards Earth Syst. Sci., 13, 91–95, 2013                                   www.nat-hazards-earth-syst-sci.net/13/91/2013/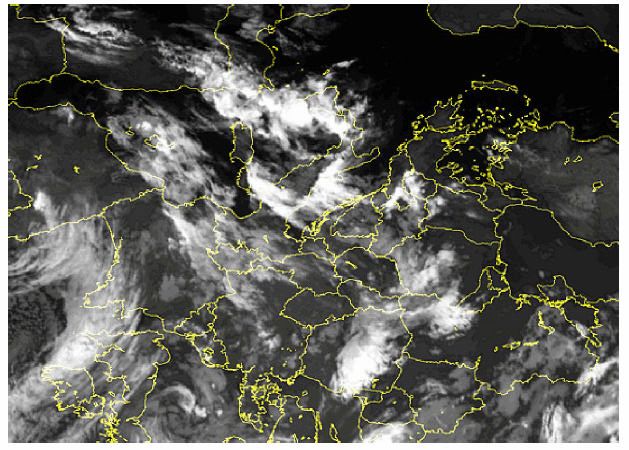
G. Guangmeng and Y. Jie: Three attempts of earthquake prediction 93
stayed there and did not move with winds for hours. It looks
like some unknown force was dragging and hampering this
cloud to move. In Freund’s P-hole theory and rock experi-
ments, he suggests that when the rocks are under high stress,
it will ionize the air and produce positive airborne ions. The
continuous supply of positive ions may be the reason why
“stationary clouds” form over fault regions (Freund et al.,
2009). We consider that this means the underground geologi-
cal activity is becoming active, and according to this anomaly
we make this prediction: “According to the satellite data,
there will be M = 5.5–6.0 quake in Italy. If M = 5.5, it is
about in 10 days, If M = 6.0, it is in 30 days. I am trying
to reduce the location error, but my data is limited.” This pre-
diction was sent to Angelo DeSantis, researcher of Italy’s Na-
tional Institute for Geophysics and Vulcanology and Hattori
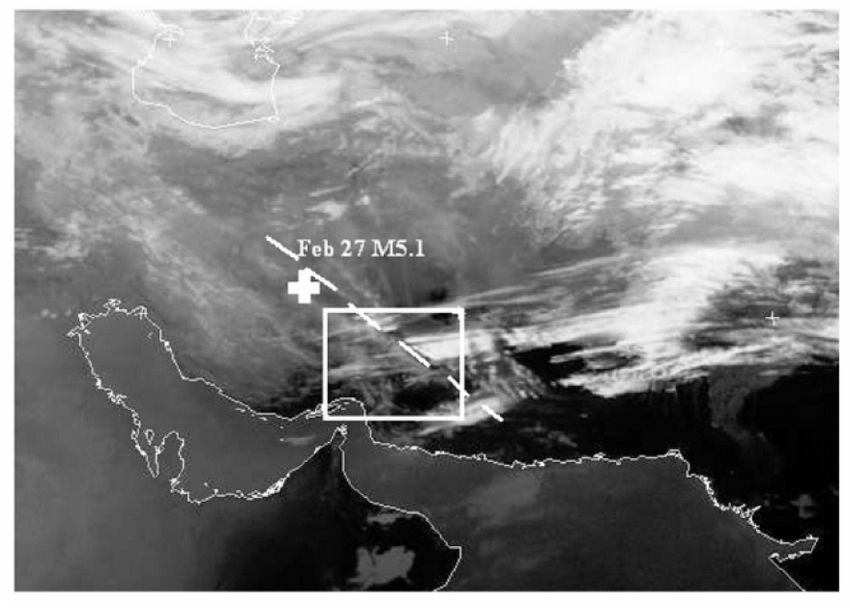
Katsumi, professor of Japan Chiba University on 23 April. At Fig. 2. Cloud image at 06:00 UTC on 20 February 2012. The dashed
the same time, a small cloud anomaly appeared above Cor- line is a major fault of Iran, and the square was our predicted future
sica, the island to the west. Its width was small compared to epicenter area.
the cloud over Italy, so in this large area there were two cloud
anomalies. Because the area is large, it is difficult to estimate
the epicenter accurately, that is why we just gave a predicted tude M = 5.8–6.3. Because the stationary cloud edge was so
location “Italy”. Also because the area was large, so it meant long, about 300 km, it was difficult to predict the future epi-
a strong quake. That is why we predicted M = 6.0. center location, possibly in the region 28◦ –30◦ N, 58◦ –60◦ E.
The M = 5.5–6.0 magnitude estimation is based on the The earthquake time was also difficult to predict, because we
large area of the cloud anomaly, because it appears in Italy have no information about the local geology activities, such
and north Greece, and it is about 200 km long in Italy. The as underground fluids, ground electric or local gravity. So we
date is based on our experience in Iran and China. The only could only give a rough estimate, between 10 days to 30 days,
disadvantage is that the epicenter is difficult to estimate due and the possible date is in 10 days. We sent this prediction
to the large area of cloud anomaly. So we tried to get some to the editor of International Journal of Remote Sensing and
field measurement data such as radon or ground water data the earthquake administration of Nanyang city on 20 Febru-
from Italy and tried to reduce the epicenter location error. But ary. Seven days later, on 27 February 2012, a M = 5.1 earth-
we did not obtain usable data. On 20 May 2012 a M = 6.0 quake occurred at 31.46◦ N, 56.76◦ E in south Iran (reported
quake occurred at 44.800◦ N, 11.192◦ E, and a M = 5.8 quake by USGS). So the location error of our prediction is 1.46◦ N,
occurred at 44.814◦ N, 11.079◦ E on 29 May 2012 (reported 1.24◦ E, and the magnitude error is 0.7. Considering the cur-
by USGS). The M = 6.0 quake was the largest in Italy since rent science technology, the absence of field data, and the big
the M = 6.3 L’Aquila quake in 2009. An interesting point area of cloud anomaly, it is difficult to reduce this location
is that a M = 5.6 quake occurred in Bulgaria at 42.686◦ N, error further. So we think this prediction can be counted as
23.009◦ E on 22 May 2012, very close to the small cloud successful.
anomaly in North Greece (see Fig. 2). From 1970 to the Table 1 lists the earthquake times in 2001–2011 within
present time, there were only 9 quakes larger than M = 5.0 in 28◦ –32◦ N, 56◦ –60◦ E of south Iran. All these earthquakes
region of Bulgaria. So it is unlikely that this M = 5.6 quake have magnitudes larger than or equal to M = 5.0. The record
was a mere coincidence with the cloud anomaly. shows that average frequency of earthquakes (M ≥ 5.0) in
south Iran is 250 days. While in our prediction the quake
comes only 7 days after we made the prediction, the met-
4 The Iran earthquake prediction ric for a successful possibility is 7/250 = 2.8 % for a pre-
diction according to the 250 days frequency. This means
On 19 February 2012, a cloud appeared over a major fault in that our prediction is most likely not a coincidence. Will
Iran. Figure 2 shows the image at 06:00 UTC on 20 Febru- the earthquake activity of Iran be quiet for some weeks af-
ary. We can see that in the left part of the fault, there are ter the M = 5.1 earthquake of 27 February? According to our
thin clouds, while in the right part, as the cloud passed the study, the answer is no. We found another cloud anomaly on
main fault, thick clouds appeared suddenly. The cloud edge 1 March (see Fig. 3). Its pattern was similar as Fig. 2, so ac-
was straight and stationary for about 1 day, while clouds in cording to this cloud anomaly we made a second prediction:
other areas were moving continuously. So according to this “According to the satellite data, fault activity of Iran is still
anomaly, we make a prediction that there will be a medium in a high stress. So we predict, there will be a M = 5.0–6.0
to strong earthquake in south Iran, with the possible magni- quake in Iran from 2 March to 17 March. 7–8 March is a
www.nat-hazards-earth-syst-sci.net/13/91/2013/ Nat. Hazards Earth Syst. Sci., 13, 91–95, 2013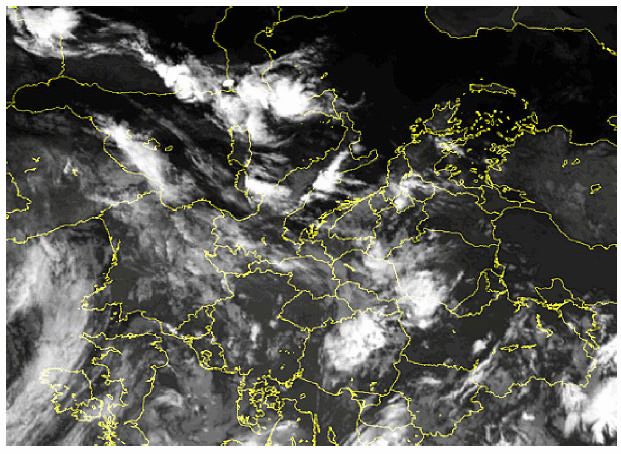
94                                                                      G. Guangmeng and Y. Jie: Three attempts of earthquake prediction

Table 1. Number of earthquakes (M ≥ 5.0) from 2001–2011 in southern Iran.

        Year                2001      2002      2003       2004      2005      2006      2007      2008     2009      2010     2011      total    frequency
        Quake times             1          0         4           1       2           1         1       0         0        2         4      16      250 days

Table 2. Lists of four earthquake dates and magnitudes.

                                      Date of cloud              Date of                  Time         Magnitude       Location
                                      anomaly                    earthquake               duration
                                                                                          (day)
                                      23 April 2012              20 May 2012              27           M = 6.0         Italy
                                      23 April 2012              22 May 2012              29           M = 5.6         Bulgaria
                                      19 February 2012           27 February 2012         8            M = 5.1         Iran
                                      1 March 2012               8 March 2012             7            M = 5.1         Iran

                                                                                              Figure 4. Scatter map of four earthquakes preparation time and magnitude
                                                                                         Fig. 4. Scatter map of four earthquake’s preparation time and mag-
                                                                                         nitude.

             Figure 3. Cloud image at 00:00 UTC on Mar 1, 2012
Fig. 3. Cloud image at 00:00 UTC on 1 March 2012.
                                                                                         5     Discussions

 Table 2 Lists
likely   date.”of four
                   Thisearthquake date and was
                           prediction      magnitude
                                                sent to the editor of Interna-           Of course earthquake prediction is a very difficult task, and
tional Journal of Remote Sensing and the earthquake admin-                               many even think it is impossible (Robert et al., 1997). Here
istration    of Nanyang
 Date of Cloud      Date of     city Time
                                       on 2duration
                                               March.   The fact isLocation
                                                     Magnitude        a M = 5.1          we presented three earthquake prediction attempts where we
quake
 anomaly   occurred      at  32.91
                    earthquake
                                     ◦ N, 46.98◦ E on 8 March in North
                                          (day)
                                                                                         were able to register some success. We made three pre-
Iran    (reported                                                                        dictions, and all three became true. The dates and magni-
 April 23, 2012 Mayby        USGS).
                         20,2012      27 In this prediction
                                                     M6.0         our
                                                                   Italy estimate
of  impending          earthquake       activity    and  the  earthquake     time        tudes were acceptable, and the distance error was about 100–
 April 23, 2012 May 22,2012           29             M5.6          Bulgaria
were accurate. Because their distance is larger than 500 km,                             300 km. From Table 2 and Fig. 4, we can see that bigger
 February 19, February 27,            8              M5.1          Iran                  earthquakes seem to need more time to prepare, and this is
and their magnitude are both M = 5.1, so they are probably
 2012               2012
two isolated quakes. Statistically according to the 250 days                             reasonable with current knowledge, although only 4 quakes
 March 1,2012
frequency,       theMarch 8, 2012
                        chance of 7making a successful
                                                     M5.1          Iran
                                                                  prediction    is       are listed due to earthquake prediction being extremely diffi-
2/250 = 0.8 %. The chance of making 2 consecutive predic-                                cult.
tions such as ours, the probability will be 7/250 · 2/250 =                                 Unlike the gravity and geomagnetic measurement which
0.0224 %. So this shows that it is nearly impossible to make 2                           need millions of dollars to build a station and transfer net-
consecutive successful predictions according the earthquake                              work, the method presented here is very inexpensive because
history data. While with the help of satellite data, we make                             anyone can download satellite data from the internet and an-
two partly successful predictions.                                                       alyze them. Note that our prediction is only based on satellite
                                                                                         cloud images; we use no field survey, no in situ measurement
                                                                                         and no other geophysical data. Cloud anomaly observed in
                                                                                         some region indicates that there is stress build-up in this area,
                                                                                         and this means there is a high probability of a major seismic

Nat. Hazards Earth Syst. Sci., 13, 91–95, 2013                                                       www.nat-hazards-earth-syst-sci.net/13/91/2013/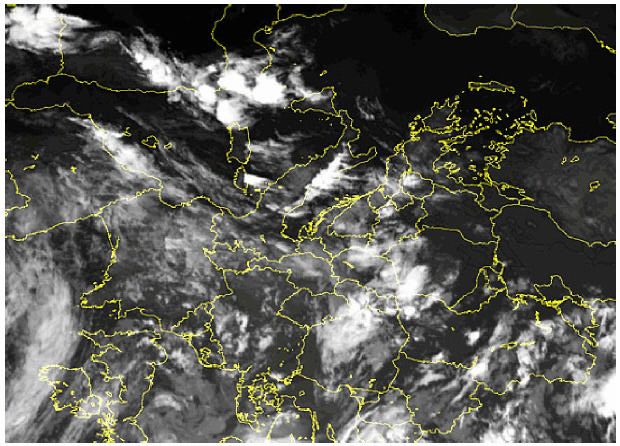
G. Guangmeng and Y. Jie: Three attempts of earthquake prediction                                                                             95

event. But we must note that not every cloud anomaly cor-               Liu, J. Y., Chuo, Y. J., Shan, S. J., Tsai, Y. B., Chen, Y. I., Pulinets,
responds to an earthquake. To reduce the false alarm, we                  S. A., and Yu, S. B.: Pre-earthquake ionospheric anomalies reg-
can use some other geophysical data such as ground wa-                    istered by continuous GPS TEC measurements, Ann. Geophys.,
ter, ground electric, gravity, and combine them together with             22, 1585–1593, doi:10.5194/angeo-22-1585-2004, 2004.
satellite data. For example, ground electrical measurements             Morozova, L. I.: Dynamics of cloudy anomalies above fracture re-
                                                                          gions during natural and anthropogenically caused seismic activ-
will enable the estimation of the epicenter and magnitude of
                                                                          ities, Fizika Zemli, 9, 94–96, 1997.
the impending earthquake (Varotsos et al., 1986) along with             Ouzounov, D., Bryant, N., Logan, T., Pulinets, S., and Taylor, P.:
the determination of its occurrence time (Sarlis et al., 2008).           Satellite thermal IR phenomena associated with some of the ma-
Qin et al. (2012) analyze air temperature data before the same            jor earthquakes in 1999–2004, Phys. Chem. Earth, 31, 154–163,
Italy M = 6.0 quake and finds that from 20:00 to 23:00 UTC                2006.
on 12 May 2012, an obvious high temperature area appeared               Ouzounov, D., Liu, D., Kang, C.,Cervone, G., Kafatos, M., and Tay-
above the epicenter region, then gradually weakened and nar-              lor, P.: Outgoing long wave radiation variability from IR satellite
rowed onto the epicenter. These independent verifications                 data prior to major earthquakes, Tectonophysics, 431, 211–220,
can increase the reliability of earthquake prediction. So we              2007.
think that this method has great potential in earthquake pre-           Qiang, Z. J., Xu, X. D., and Dian, C. G.: Thermal infrared anomaly
diction.                                                                  precursor of impending earthquakes, Chinese Sci. Bull., 36, 319–
                                                                          323, 1991.
                                                                        Qiang, Z. J., Dian, C. G., Wang, X. J., and Hu, S. Y.: Satellite
                                                                          thermal infrared anomalous temperature increase and impending
Supplementary material related to this article is
                                                                          earthquakes precursor, Chinese Sci. Bull., 37, 1642–1646, 1992.
available online at:                                                    Qin, K., Wu, L. X., De Santis, A., and Cianchini, G.: Preliminary
http://www.nat-hazards-earth-syst-sci.net/13/91/2013/                     analysis of surface temperature anomalies that preceded the two
nhess-13-91-2013-supplement.zip.                                          major Emilia 2012 earthquakes (Italy), Ann. Geophys., 55, 823–
                                                                          828, 2012, http://www.ann-geophys.net/55/823/2012/.
                                                                        Robert, J. G., Jackson, D. D., Kagan, Y. Y., and Mulargia, F.: Earth-
                                                                          quakes Cannot Be Predicted, Science, 275, 1616–1617, 1997.
                                                                        Saraf, A. K. and Choudhury, S.: Thermal remote sensing technique
Acknowledgements. This work was supported by NSFC project                 in the study of pre-earthquake thermal anomalies, J. Ind. Geo-
(41071280).The satellite data were provided by Dundee Satellite           phys. Union, 9, 197–207, 2005.
Receiving Station and www.sat24.com. Many thanks for the                Shou, Z. H., Earthquake Clouds, a reliable precursor, Science &
reviewer’s great assistance in evaluating this paper. Their help are      Utopya, 64, 53–57, 1999.
greatly appreciated.                                                    Sarlis, N. V., Skordas, E. S., Lazaridou, M. S., and Varotsos, P. A.:
                                                                          Investigation of seismicity after the initiation of a Seismic Elec-
Edited by: M. E. Contadakis                                               tric Signal activity until the main shock, Proc. Jpn Acad. Ser. B.
Reviewed by: L. X. Wu and F. T. Freund                                    Phys. Biol. Sci., 84, 331–343, 2008.
                                                                        Tronin, A. A.: Thermal IR satellite sensor data application for earth-
                                                                          quake research in China, Int. J. Remote Sens., 21, 3169–3177,
References                                                                2000.
                                                                        Varotsos, P., Alexopoulos, K., Nomicos, K., and Lazaridou, M.:
Choudhury, S., Dasgupta, S., Saraf, A. K., and Panda, S. K.: Re-
                                                                          Earthquake prediction and electric signals, Nature, 322, 120,
   mote sensing observations of pre-earthquake thermal anomalies
                                                                          doi:10.1038/322120a0, 1986.
   in Iran, Int. J. Remote Sens., 27, 4381–4396, 2006.
                                                                        Wu, L. X., Li, J. P., and Liu, S. J.: Space Observed Two
Freund, F. T., Kulahci, I., Cyr, G., Ling, J., Winnick, M., Tregloan-
                                                                          Abnormal Linear Clouds before Wenchuan Earthquake. 3rd
   Reed, J., and Freund, M. M.: Air ionization at rock surfaces and
                                                                          IASME/WSEAS Int. Conf. Geol. Seismol., Cambridge, UK,
   pre-earthquake signals, J. Atmos. Sol.-Terrest. Phys., 71, 1824–
                                                                          138–143, 2009.
   1834, 2009.
                                                                        Yasuoka, Y., Igarashi, G., Ishikawa, T., Tokonami, S., and Shinogi,
Guo, G. M. and Wang, B.: Cloud anomaly before Iran earthquake,
                                                                          M.: Evidence of precursor phenomena in the Kobe earth-
   Int. J. Remote Sens., 2, 1921–1928, 2008.
                                                                          quake obtained from atmospheric radon concentration, Appl.
                                                                          Geochem., 21, 1064–1072, 2006.

www.nat-hazards-earth-syst-sci.net/13/91/2013/                                       Nat. Hazards Earth Syst. Sci., 13, 91–95, 2013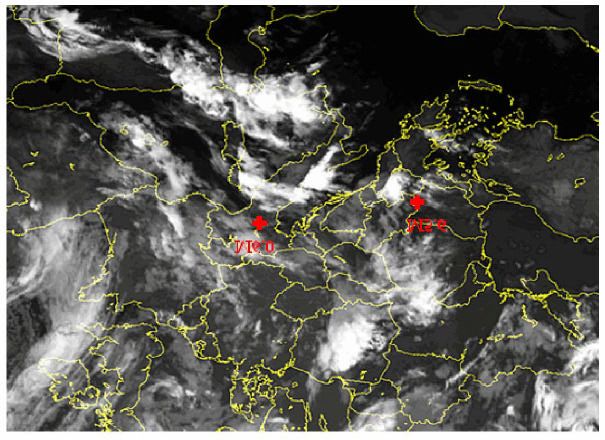
You can also read