Investor Presentation - May, 2015 POLARIS INDUSTRIES INC.
←
→
Page content transcription
If your browser does not render page correctly, please read the page content below
POLARIS INDUSTRIES INC.

Investor Presentation
May, 2015

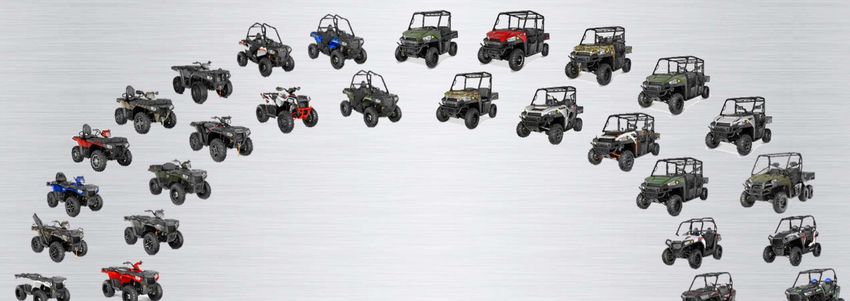
Polaris Industries Inc. – A Global Corporation

                ~8,100   Employees Worldwide

                   15    Manufacturing Locations

                    5    Research & Development
                         Centers of Excellence
                ~1,850   Dealers In North America

                ~1,400   Dealers Outside North America

              >380,000   Units Shipped Worldwide in 2014

                 >100    Countries – Polaris Products Sold

IR May 2015                                                  2
Corporate Overview: 2014 Sales
                Sales by Geography                                     Sales by Component*

                                                                                            PG&A
                                                                                      17%
              United
              States                                           Off-Road
                            15% International                  Vehicles                      7% Snowmobiles
               75%
                                                                    62%                      8% Motorcycles
                          10%
                                Canada                                                   6%
                                                                                               Global Adjacent
                                                                                                  Markets

                                                 BILLION                      UP

IR May 2015                                     *Reclassified for new Global Adjacent Markets organizational structure   3
Polaris at a Glance – Key Financial Metrics

                            Sales   Guidance   Net Income*
                                                                             SALES UP
                                                                            9% TO 12%
         5-Year CAGR                                         +19%
          Sales +23%                                         $4,480

          EPS* +34%                            $3,777                         NET INCOME
                                                                                  UP
                                    $3,210                    $454             9% TO 12%

                        $2,657                 $381
                                    $312
              $1,991
                        $228
              $147
              2010      2011        2012       2013           2014             2015
                                                                             Guidance

  EPS*        $2.14     $3.20       $4.40      $5.40         $6.65         $7.27 TO $7.42
               +40%      +50%       +38%       +23%           +23%           UP 9% TO   12%

         2014 - 5th Straight Year of Exceptional Financial Performance
IR May 2015                                                      *from continuing operations   4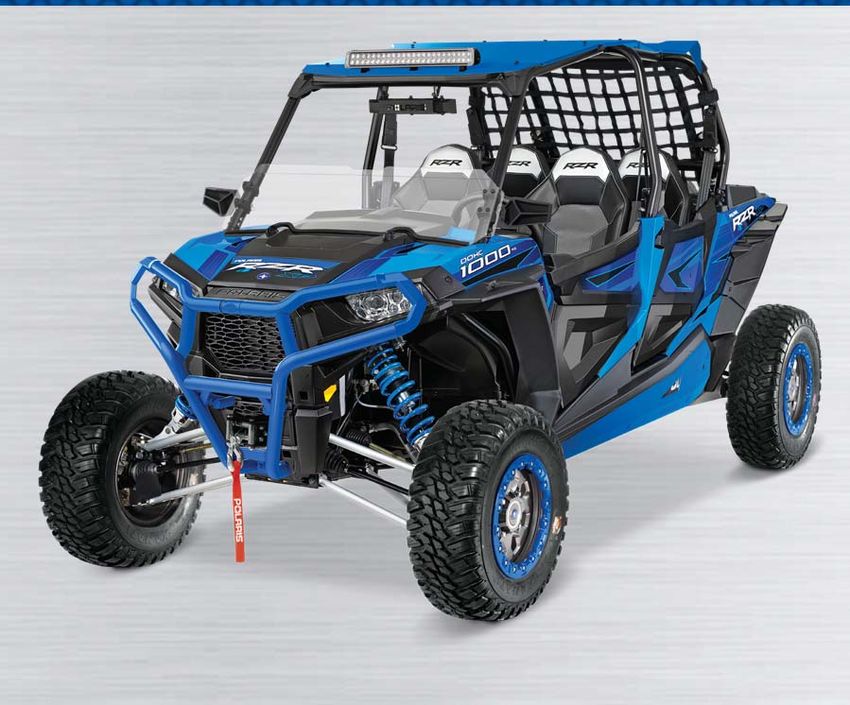
Polaris Strategic Objectives
 Vision & Strategy                                                                                           Guiding Principles
 VISION                               STRATEGY
 Fuel the passion of riders,          Polaris will be a highly profitable, customer centric,
 workers and outdoor enthusiasts      $8B global enterprise by 2020. We will make the best                       Best People, Best Team
 around the world by delivering       off-road and on-road vehicles and products for recreation,
                                                                                                                  Safety & Ethics Always
 innovative, high quality vehicles,   transportation and work supporting consumer, commercial
 products, services and               and military applications. Our winning advantage is our                           Customer Loyalty
 experiences that enrich their        innovative culture, operational speed and flexibility, and
 lives.                               passion to make quality products that deliver value to
                                      our customers.

 Strategic Objectives                                                                                     Performance Priorities
 Best in Powersports PLUS             Global Market Leadership           Strong Financial
 5-8% annual organic growth           >33% of Polaris revenue            Performance                                              Growth
                                                                         Sustainable, profitable growth
                                                                                                                       Margin Expansion
                                                                         Net Income Margin >10%
 Growth Through Adjacencies LEAN Enterprise is
                                                                                                             Product & Quality Leadership
 >$2B from acquisitions & new markets Competitive Advantage
                                      Significant Quality,                                                              LEAN Enterprise
                                      Delivery & Cost Improvement

 GROW SALES >$8 Billion by 2020                12% CAGR             INCREASE NET INCOME >10% of Sales by 2020                13% CAGR

IR May 2015                                                                                                                                 5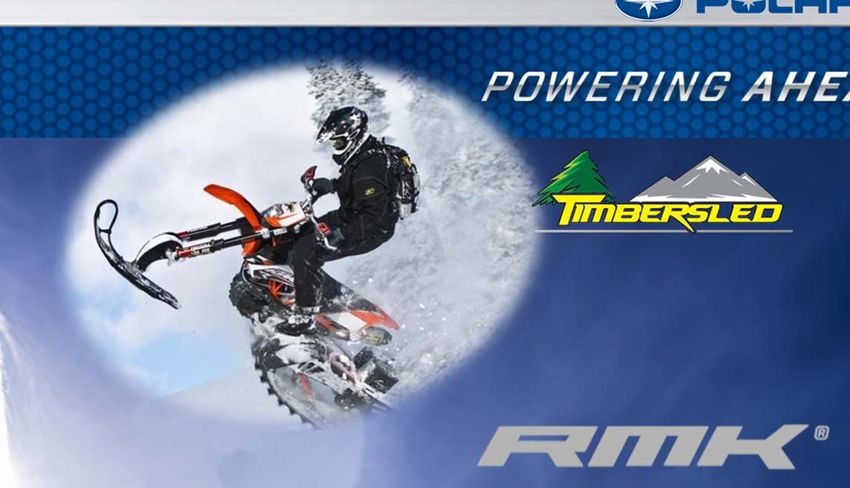
Off-Road Vehicles

                                       3-Yr CAGR +17%
                                        Sales ($ in millions)

                                                                  Up mid-single
                                                                     digits %
                                         $2,909          +15%      (unchanged)
                                                        $2,793*
                              $2,522
                     $2,226

                     2012      2013        2014          FY 2014     FY 2015
                                                      (Reclassified) Guidance

              #1 in Market Share – Double the Nearest Competitor
IR May 2015                                            *2014 reclassified to exclude Defense and Commercial Sales   6
Motorcycles

                                        Est. 2011

              Est. 1998   3-Yr CAGR +38%                                   Est. 2014
                                                           Up 55% to 70%
                           Sales ($ in millions)             (increased)

                                                    +59%
                                                    $349

                                       $220
                           $196

                           2012        2013         2014     FY 2015
                                                             Guidance

         Growing Core Brands; Leveraging Aftermarket Opportunities
IR May 2015                                                                            7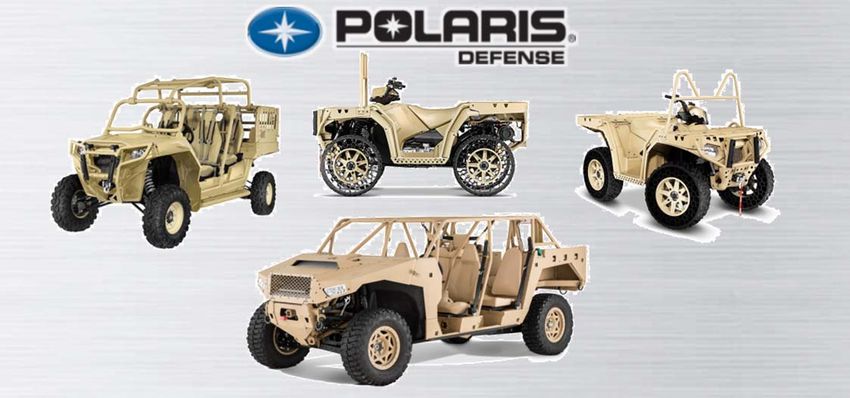
Snowmobiles

                     3-Yr CAGR +5%
                     Sales ($ in millions)
                                             Down low-single
                                   +7%           digits %
                      $302         $322        (increased)
              $283

              2012    2013         2014        FY 2015
                                               Guidance

 Solid #2 – Growing Market Share & Continuous Quality Improvement
IR May 2015                                                         8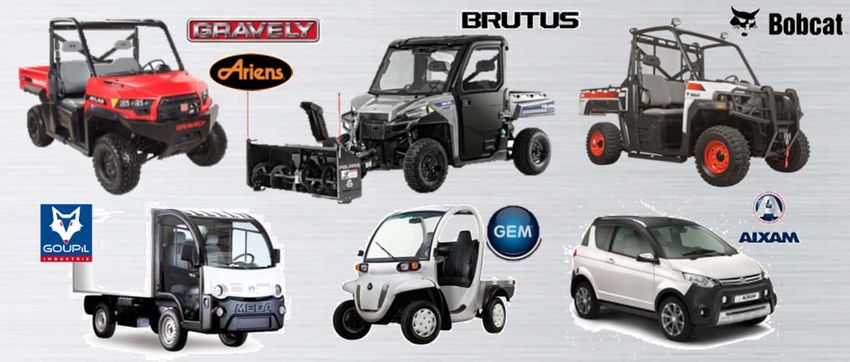
Global Adjacent Markets
                                  Total Sales**                                       Work & Transportation*

                                                             Up 5% to 10%
                                             +24%             (decreased)
                                             $273
                         $221
     $ in Millions

                                                                                         *Small Vehicles + Commercial

                                                                                                Military
                         2013           2014                    FY 2015
                     (Reclassified) (Reclassified)              Guidance

               **Beginning in 2015 the organization restructured by combining Small
                  Vehicles, Commercial & Military into “Global Adjacent Markets”

                                                       Growing Outside Powersports
IR May 2015                                                                                                             9
Parts, Garments & Accessories (PG&A)

                                           3-Yr CAGR +22%
                                            Sales ($ in millions)

                                                                    Up high-teens %
                                                                      (unchanged)
                                                          +21%                                        Motorcycles
                 Parts                                    $742                                           Small
                                              $611                                    Off-Road            Vehicles
                         Garments                                                     Vehicles
                                    $461                                                          Snow

              Accessories
                                                                                                      Other

               FY 2014                                                                      FY 2014
                                    2012      2013        2014        FY 2015
                                                                      Guidance

                    Amazing Products & Launches – Big Opportunity!
IR May 2015                                                                                                      10
International
2014 Sales by Product 2014 Sales by Geography
Latin
Snow Motorcycles America
8% 11% 7%
Asia 4%
ORV Small Europe
46% Vehicles 68% Aus / NZ
19% 12%
PG&A
16%
ME / Africa
9%
Total International Sales ($ in millions)
3-Yr CAGR +17% Down low-single
+16% digits %
$685 (decreased)
$592
$461 Latin America
Asia/Pacific
Europe, Middle East & Africa
2012 2013 2014 FY 2015
Guidance
Focused on Execution in Challenging Markets and Fx Pressures
IR May 2015 11Appendices
Slide
Consistent Financial Performance 14
Q1 2015 Sales and Income 15
N.A. Retail Sales & Q1 2015 16
Dealer Inventory – Q1 2015 17
2015 Full Year Detailed Guidance 18
2015 Gross Profit Margin Guidance 19
Foreign Currencies Exposures for Polaris 20
Balance Sheet and Liquidity Profile 21
LEAN is a Competitive Advantage 22
Customer Profiles 23
Recent Acquisitions 24
IR May 2015 13Consistent Financial Performance
5+Year Total Return Dec. 31, 2009 – April 24, 2015 Dividends (Per Share)
5-year dividend payout $457 million
Dividends increased 20% per year compounded
617% annually for the past 5 years $2.12
$1.92
$1.68
$1.48
$0.80 $0.90
203%
111% 90% 73%
Polaris Peer S&P S&P DJIA 2010 2011 2012 2013 2014 2015
Avg. Midcap 500 Expectation
400
Return on Assets (2010-2014) Return on Invested Capital (2010-2014)
41% 42% 42% 42%
23% 24% 24%
20% 33%
16%
13% 21%
9% 9% 9% 15% 14%
7% 12%
11%
6% 6% 7% 12%
6% 7% 8%
4% 6% 6%
2010 2011 2012 2013 2014 2010 2011 2012 2013 2014
Polaris Peer Average (ACAT, BC, DE, HOG, WGO, TTC) S&P 500 Average
IR May 2015 14Q1 2015 Sales and Income ($ in millions)
Q1 Sales Q1 Operating Income Q1 Net Income
$150.3 $88.6
$1,033.3
$126.7 $80.9
$888.3
Q1 2014 Q1 2015 Q1 2014 Q1 2015 Q1 2014 Q1 2015
Record 1st quarter sales, operating income and net income
Sales of Motorcycles +74%; PG&A +12%; ORV +11%
Sales in EMEA -15%; Asia Pacific +6%; Latin America +75%
Earnings per share increased 9% to a record $1.30
Gross profit margin down 66 bps, primarily currency and mix pressures
Operating income margin up 28 bps
Pretax profit impacted by $16 million currency hit in Q1
Record Results In-spite of Stiff Currency Pressures
IR May 2015 15N.A. Powersports Retail Sales – Q1 2015
Polaris Retail Sales Industry Retail Sales
15%
13%
12%
8%
7%
+4% +4%
Industry Industry
Q1-14 Q2-14 Q3-14 Q4-14 Q1-15 Q1 2014 Q1 2015
Polaris N.A. retail 8% for Q1 2015 vs. Q1 2014
Gained share in powersports driven by motorcycles
ORV market share flat in Q1 – Intense competitive promotional pressure
Motorcycle Q1 retail strong; double last year
Indian and Victory and gaining share; Slingshot stronger than expectations
Polaris N.A. Snow retail high-single digits for season driving increased market share,
but Q1 low-double digits %
N.A. Snowmobile industry ended the season mid-single digits %, strongest year since ’08/’09
Solid Retail Quarter for Most Businesses; Slingshot Strong
IR May 2015 16Dealer Inventory – Q1 2015
N.A. Dealer Inventory
4% Existing ORV Models
3% New ORV Models
2015 3% ACE / New Segments
2% Snowmobiles
2014
1% Slingshot
2013
4% New Dealers
2012 17% Total Increase
Jan Feb Mar Apr May Jun Jul Aug Sep Oct Nov Dec
Polaris Q1 2015 N.A. dealer inventory 17% vs. 2014
ORV mid-teens % driven primarily by more new models & market categories & RFM ATV segment stocking
Motorcycles about 20%; Indian motorcycles and Slingshots , Victory low double-digits %
Snowmobiles mid-twenties % due to lower snowfall levels in key regions
Continue to optimize RFM business model in ATVs
Improving model to be more flexible/nimble going forward
Current ORV capacity limitations requiring level-loaded production ahead of key spring and fall seasonality
Targeting year-over-year unit and percent decreases throughout 2015 through improved turns
ORV Dealer Inventory High, but Expect to Improve by Year-end
IR May 2015 172015 Full Year Guidance
METRIC GUIDANCE
Sales Components
Off-Road Vehicles Up mid-single digits % (reclassified 2014 actuals)
Snowmobiles Down low-single digits %
Motorcycles Up 55% to 70%
Global Adjacent Markets Up 5% to 10% (reclassified 2014 actuals)
PG&A Up high-teens %
International Down low-single digits %
Total Company sales Up 9% to 12%
Gross profit margin Flat to Up 20 bps
Change in Guidance
Operating expenses (% of sales) About flat
Increased/
Income from financial services Up mid-single digits % favorable
Income taxes 34.75% to 35.25% of pretax income Decreased/
unfavorable
Net income Up 9% to 12% Unchanged
Narrowed
EPS, diluted $7.27 to $7.42 (+9% to +12%)
Solid Growth Expectations
IR May 2015 182015 Gross Profit Margin Guidance
Actual Actual Guidance
METRIC Q1 2014 Q1 2015 FY 2015
Prior period 29.0% 29.1% 29.4%
Production volume/capacity
Product cost reduction efforts
Commodity costs
Currency rates
Higher selling prices
Product mix
New plant start-up costs
Warranty costs
Depreciation/Tooling amortization
Sales promotional costs
Current period 29.1% 28.4% 29.4% to 29.6%
Change +10 bps -66 bps Flat to Up +20 bps
Improvement to gross profit margin % Impairment to gross profit margin % Neutral to gross profit margin %
IR May 2015 19Foreign Currency Exposures for Polaris
F/X Impacts vs. 2014 Actual FY 2015 Expectations*
($ in millions) Q1 2015 (Included in Guidance)
Sales ($32) ($140 - $160)
Gross Profit ($12) ($65 - $75)
Operating Expenses $5 $15 - $17
Other Expense ($9) ($15 - $17)
Pretax Income ($16) ($65 - $75)
*Assumes exchange rates remain in about same range as of the end of Q1. Net income
expectations for 2015 include the impact of existing F/X hedging contracts below.
Open F/X Hedging Contracts as of April 23, 2015
Foreign Currency Hedging Contracts Currency Impact on Net Income
% of Remaining Notional Avg. Exchange Compared to Prior Year Period
Currency 2015 Cash Flow Amounts Rate of Open Q1 2015 Est. Remainder
Foreign Currency Position Exposure (US $ in Thousands) Contracts of 2015
Canadian Dollar (CAD) Long 75% $205,200 $0.79 to 1 CAD Negative Negative
Australian Dollar (AUD) Long 30% $10,700 $0.81 to 1 AUD Negative Negative
Euro (EUR) Long 0% - - Negative Negative
Japanese Yen (JPY) Short 70% $16,900 110 Yen to $1 Positive Positive
Mexican Peso (MXN) Short 70% $28,000 14.3 Peso to $1 Positive Positive
Significant Impact in Q1 2015, Expected to Persist for Remainder of 2015
IR May 2015 20Balance Sheet and Liquidity Profile
$ In millions Fav / (UnFav)
(except per share and rate data) Q1 2015 Q1 2014 2015 Full Year Guidance
Cash $111.0 9% Increase from 2014
Debt / Capital lease obligations $329.1 1% Similar to 2014
Credit facility $500.0 43% Increased $150M from 2014
Factory inventory $629.3 (30%) Improved Turns
Capital expenditures $30.8 (22%) >$250M
Depreciation and amortization $37.1 (32%) Increase about 20% from 2014
Operating cash flow Increase at higher % than net
from continuing operations
$4.2 ($40.5) income
Dividend (per share) $0.53 10% Increase 10% over 2014
Polaris Acceptance receivables $1,221.9 28% About flat with 2014
Retail credit – Approval rate 56% +4%
Rates stable
– Penetration rate 32% +2%
IR May 2015 21LEAN is a Competitive Advantage
Gross Profit Margin
Up to +20 bps
29.4% to 29.6%
29.1% -66 bps
28.4%
Q1 2014 Q1 2015 FY 2015
Guidance
Future Plant Rendering – 600,000 sq ft
Production delays in motorcycles – paint system, new product readiness
Began shipping Indian Scouts very late in Q1
New paint system ramped-up throughout Q1; progress accelerating
Gross Profit Margin in Q1 due to currency and product mix pressures
New LEAN Value Improvement Process (VIP) implemented to improve quality, delivery & cost
Factory inventory up 30% vs. 2014; PG&A, raw materials, mix and acquisitions
Polaris product quality good and improving; #1 in NPS for motorcycles, SxS & ATVs
Challenging Circumstances in Q1
IR May 2015 22Customer Profiles
OFF-ROAD VEHICLES MOTORCYCLES SNOWMOBILES
Avg.
49 43 44 47 52 25 to 55 42
Age
Income ~$100k ~$100k ~$90k ~$90k ~$100-$125k ~$150k ~$90k
Male /
95% / 5% 90% / 10% 90% / 10% 75% / 25% 90% / 10% 90% / 10% 90% / 10%
Female
Primary Mostly Work Mostly Play Work & Play Rec/Trail Cruising Cruising Recreation
Usage Farming/Ranchi Rec/Trail Rec/Trail Hunt Day trips Day trips on & off trail
ng Dunes Property Maint. Utility Around town Around town
Property Maint. Property Hunt Commute Commute
Rec/Trail
Hunt
IR May 2015 23Recent Acquisitions
Timbersled Acquisition Hammerhead Acquisition
Light Utility Adult go-karts
Vehicles MSRP-US
(Gas/Electric) $1,999-$2,799
MSRP-US
$3,499 - $5,499
Youth go-karts
MSRP-US
$1,099 - $1,699
Mountain Horse Conversion Kit
MSRP-US $5,300 - $6,500
New snow category complements mountain Leverage low-cost supplier/manufacturing base
business Expand entry level go-kart / ORV business
Fast growing and profitable Increase emerging market access
New customer base – off-road motorcyclists in Cultural fit - western educated, ORV background
snowbelt
Complementary to Snow Business Builds on Growing Asian Business
IR May 2015 24Safe Harbor Except for historical information contained herein, the matters set forth in this document, including but not limited to management’s expectations regarding 2015 sales, shipments, margins, currencies, net income and cash flow, the opportunities for expansion and diversification of the Company’s business and the Company’s guidance on earnings per share from continuing operations are forward-looking statements that involve certain risks and uncertainties that could cause actual results to differ materially from those forward-looking statements. Potential risks and uncertainties include such factors as product offerings, promotional activities and pricing strategies by competitors; manufacturing operation expansion initiatives; acquisition integration costs; warranty expenses; foreign currency exchange rate fluctuations; environmental and product safety regulatory activity; effects of weather; commodity costs; uninsured product liability claims; uncertainty in the retail and wholesale credit markets; performance of affiliate partners; changes in tax policy and overall economic conditions, including inflation, consumer confidence and spending and relationships with dealers and suppliers. Investors are also directed to consider other risks and uncertainties discussed in our 2014 annual report and Form 10-K filed by the Company with the Securities and Exchange Commission. The Company does not undertake any duty to any person to provide updates to its forward-looking statements. The data source for retail sales figures included in this presentation is registration information provided by Polaris dealers in North America and compiled by the Company or Company estimates. The Company must rely on information that its dealers supply concerning retail sales, and other retail sales data sources and this information is subject to revision. IR May 2015 25
You can also read