EUROCASH Empowering modern retail entrepreneurs - Grupa Eurocash

Page created by Terry Owens
 
CONTINUE READING
EUROCASH Empowering modern retail entrepreneurs - Grupa Eurocash
EUROCASH
Empowering modern retail entrepreneurs
EUROCASH Empowering modern retail entrepreneurs - Grupa Eurocash
Eurocash Group – executive summary

     NO. 1. WHOLESALE DISTRIBUTOR IN POLAND
     with 27% market share & the biggest (3bn Pln) FMCG ecommerce platform

                               DYNAMICALLY ENTERING INTO RETAIL
                               already no. 7 with objective to become no. 3 retail chain in Poland

     WITH INNOVATION AND BUSINESS DEVELOPMENT PROJECTS DELIVERING RESULTS
     addressing digitalization, personalization & automation needs

                  AS THE DOMINANT SMALL FORMAT & PROXIMITY STORE OPERATOR
                  supported by globally changing trends & consumer habits

                                                                                                     2
EUROCASH Empowering modern retail entrepreneurs - Grupa Eurocash
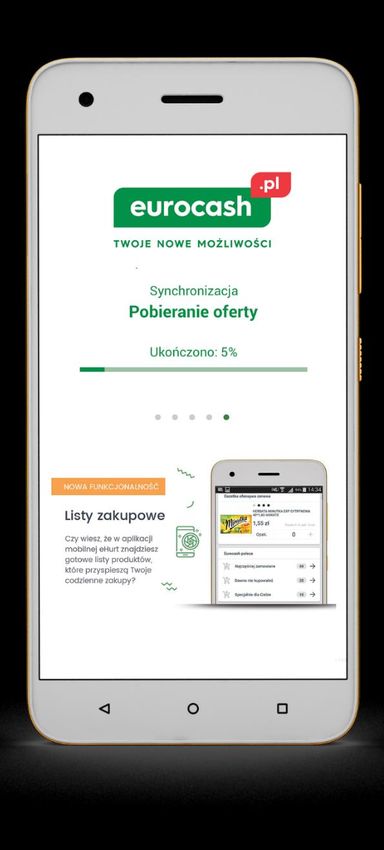
Eurocash Group: steady strategy execution to build 2nd biggest purchasing
 power

     Eurocash Group sales evolution (PLN bn)                                                        Ranking of FMCG distributors & retailers (sales, PLN bn)
                                                                            25             Biedronka                                                      48
                                                                                                                                      17             32
                                                                      23
22
                                                                                           Eurocash
                                                                                                                                           19
                                                                                                                                                25
20
                                                            20 20                        (Pro-Forma)                7
                                                                                                                                      16
                                                                                                 Lidl                         11
                                                                                                                5
18
                                                  17 17                                        Tesco                           11
                                                                                                                              10
16                                                                                                                        9
14                                                                                          Kaufland                      8   10
                                                                                                                5
12                                                                                                                            10
                                             10                                              Auchan
                                                                                                                              10 11
10
                                         8                                                                                    10
                                                                                           Carrefour
 8                                  7                                                                             6           9
                                6                                                                                     7
 6
                        3   5                                                            Intermarche
                                                                                                          3
                                                                                                              5
                                                                                                                                       2017
 4                                                                                                                    7
            2     2                                                                           Żabka        4
 2    1                                                                                                             7
 0                                                                                 Metro (Makro C&C)                  7                2013
                                                                                                                          9
     2003 2004 2005 2006 2007 2008 2009 2010 2011 2012 2013 2014 2015 2016 2017
                                                                                               Dino
                                                                                                              5
                                                                            Pro                           1,7
                                                                                                                                       2009
                                                                           Forma                          3
     Source: Company data                                                                    Selgros      3
                                                                                                          3
                                                                                                                    Source: RZ500

                                Building scale and purchasing power to bring competitiveness to small stores

                                                                                                                                                               3
EUROCASH Empowering modern retail entrepreneurs - Grupa Eurocash
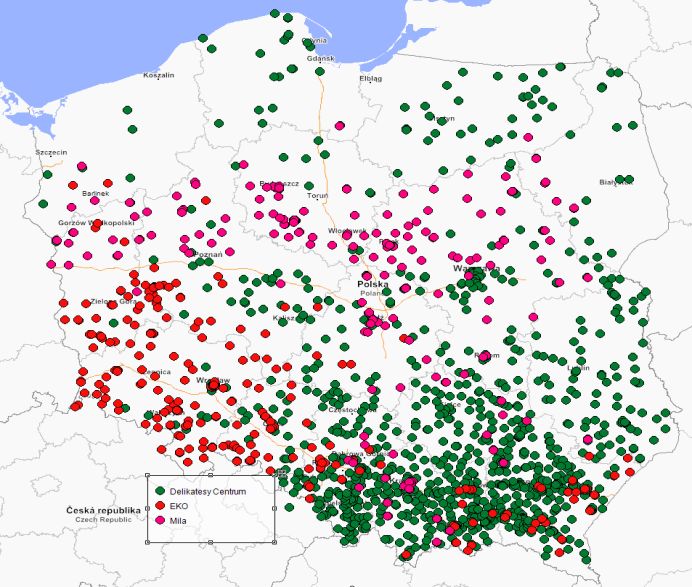
Poland is a place for proven concepts of small stores
Demographics: small towns, small living quarters, daily shopping nearby assure mom & pops stores half of the market

    Percentage of population living in cities/rural area                  Share of distribution channels in food sales in Poland
                                                                          LTM July 2018, %

                                                                         32,8%                                 42,0%
  Rural                   28%
  Cities 0-20K                                   40%                                                                      Small Format
  Cities 20-50K                                                                                                           Supermarkets 300-2500
  Cities 50-100K                                                                                                          Hypermarkets 2500+
                         8%
  Cities 100K+                                                                                                            Discounters
                                                                                  9,8%
                              11%
                                       13%                                                15,4%

  60% of Poles live in villages & small towns  Small living quarters have limited space to store food

                                                     As a result, Poles shop almost every day
                                                                                                                                   Source: GUS, Nielsen

                                                                                                                                                    4
EUROCASH Empowering modern retail entrepreneurs - Grupa Eurocash
Food market growth
Small format stores accelerating their growth

Food market growth by channels                                             Food market growth by small format channels
(YTD Sep 2018, YoY)                                                        (YTD Sep 2018, YoY)

                                                                                                                                                13,2%
                                                                                                   12,2%
8,8%                                                                        9,4%
     7,8%
                                                               6,3%
                                                                                                                                           4,2%
                                      3,4%
                                                                                 2,0%

                                            0,8%          1,2%
                  0,1%                                                                        -0,5%                       -0,9%
                       -0,4%                                                                                       -5,2%
Discounters    Hypermarkets 2500+ Supermarkets 300-2500   Small Format

                      YTD 2017      YTD 2018                             Small Supermarkets Convenience 40-100   Small Grocers -40     Specialized & Others
                                                                               100-300

 Food sales in Total Poland increased by 5.3%, while in Small Format stores increase was of 6.3%

                                                                                                                 Source: Nielsen, Total Poland, All Food   5
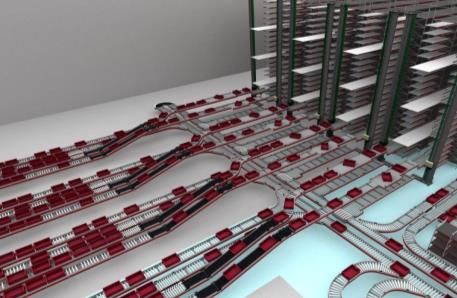
EUROCASH Empowering modern retail entrepreneurs - Grupa Eurocash
Inflation
      Small Format stores sales growth accelerated with lower inflation than other segments

       % Food basket inflation
       (YoY, YTD Sep 2018)
                                                                                            Food inflation by categories

                                                                                                    Large format categories                                          Small format categories
  4,4%
                                           1.7% difference                                    9,8%
                3,1%          3,1%                               3,3%
                                                                                                                  7,2%
                                          2,7%
                                                    2,2%                      2,1%                                                                                                                        Food average
                                                                                                         4,0%                               3,4%
                                                                                                                         3,3%                                                                                3,0%
                                                                                                                                2,3%                   2,0%         2,5%
                                                                                                                                                                           1,2%      1,2%        1,1%

Discounters Hypermarkets Supermarkets Small Format    Small     Convenience Small Grocers
               2500+       300-2500                Supermarkets   40-100         -40                                                                                                                                       -2,8%
                                                                                             Fats       Fruits   Dairy   Food   Meat     Bread and   Coffee &   Tobacco    Fish   Beverages Alcohol incl. Vegetables   Sugar,
                                                     100-300                                                                              Cereals      Tea                                     Spirits,                sweets,
                                                                                                                                                                                            Wine Beer                   jams
Source: Own estimation based on Nielsen

                                                                                                                                                                                                         Source: GUS
                                                                                                                                       2018 (I-VI)    2018 (I-IX)

        Eurocash inflation much below the market average:

        wholesale prices in Delikatesy Centrum: -1.0%, retail prices +0.8% in 9M 2018 YoY

                                                                                                                                                                                                                       6
EUROCASH Empowering modern retail entrepreneurs - Grupa Eurocash
Wholesale: No. 1 distributor in Poland
Building scale and purchasing power to bring competitiveness to small stores

                                                                                                     Wholesale market share
    Dedicated distribution platforms covering
             different store profiles
                                                                        • Local sub-wholesalers
                                                                        • Producers own distribution                                       Eurocash
                                                                        • Specialized & categories not

                                                          Generalists
           25%                           Cash&Carry                       covered by Eurocash                                               Group
             4,3
          Sales (PLN bn)                                                                                                                     27%
                                          Eurocash                                                       Others 51%
           25%                           Distribution
             4,4

          13%                              Alcohol
                                                                                                                                                  Makro - FMCG
                           Delivery

                                         Distribution
              2,3                                                                                                                                  (C&C) 6%

                                                          Specialized
                                      Tobacco & Impulse                                                                                        Selgros (C&C)
           32%                           Distribution                                                                                                4%
              5,7                                                                                                                          PT Dystrybucja
                                                                                                                                                (T) 4%

            5%                             HoReCa                                        PHUP Gniezno
                                                                                                                                Distribev (A) 3%
                                                                                                                              Bać-Pol 2%
             0,8                                                                            (T) 1%    Alti (A) 1%

                                                                                                                                                  T- Tobacco;
                                                                                                                                                  A-Alcohol,

                                                                                                                                                           7
EUROCASH Empowering modern retail entrepreneurs - Grupa Eurocash
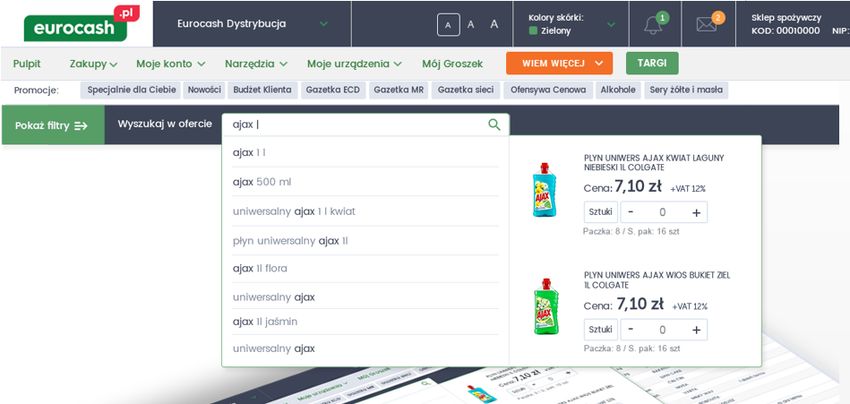
Wholesale sales dynamics
  Wholesale segment supported by increased competitiveness of small format stores
  Wholesale sales evolution by formats                                              C&C LFL
  (9M 2018 YoY)

            11%         3%        7%         -1%        10%                6%                                                                                   3,8%
                                                                                      3,6%
                                                                49                           2,6%                                                            2,7%
                                                        31
                         93        283       -16                                                                                                         1,5%
                                                                                                0,7%
             338                                                                         1,3%           0,0%                                 0,3% 0,3%
                                                                                                                                                     -0,4%
                                                                                                                            -1,3%
                                                                                                                -2,2%
                                                                         13 377
                                                                                                                    -3,5%       -3,6%
 12 599                                +778m                                                                -2,7%
                                       +6.2%                                                                            -4,0%               -4,6%
                                                                                                    -4,9%
                                                                                                                                    -5,2%

Wholesale Distribution Cash&Carry Tobacco   Alcohol    Food     Other   Wholesale
9M 2017                                               Service           9M 2018

   Wholesale accelerated growth from 4.6% in 2Q 2018 to 6.9% in 3Q 2018

   C&C LFL in 3Q 18 at +3.8% and 2.8% in 9M 2018 - best performance in last 5 years.

   ECD sales to franchisees (Lewiatan, PSD, Euro Sklep, Groszek) increased by 11.9% in 3Q and 10.3% in 9M YoY

                                                                                                                                                                    8
EUROCASH Empowering modern retail entrepreneurs - Grupa Eurocash
Wholesale: eCommerce FMCG - globally unique, Poland’s biggest
A revolution that ensures ongoing competitiveness of the independent market
and gives opportunity to integrate wholesale assets

Today: Eurocash Distribution                                           Smart business decisions
Tomorrow : all wholesale                                               Module "In Your Neighbourhood"
Alcohol Distribution, Tobacco, Cash&Carry, Others                      Demographic data of consumers from the shop area,

   3 bn                          85
                                                                       preview of promotional leaflets of local competitors,
                                                                       information about the best-selling products in the
                                             %                         neighborhood.

                                of Eurocash Distribution               Section "I Know More"
     B2B
     e-commerce sales           customers order via                    Over 1000 professional articles, legal advice, personnel
                                electronic channels
                                                                       management, information on products advertised on TV,
                                                                       advice on the display of products.

                                                                       Time saving
                                                                       Intelligent, shopping lists based on advanced algorithms.
                                                                       The fastest on the market, "learning" of the user, product
                                                                       search engine.

                                                                       Mobility
                                                                       The first mobile application on the market
                                                                       supporting store management.

                                                                                                                                    9
EUROCASH Empowering modern retail entrepreneurs - Grupa Eurocash
After many years of growth we are now able to focus on profitability
150 M PLN by 2020 - identified potential for cost reduction

                                      WHOLESALE                                                     RETAIL
       Head Office                      EC C&C                  Logistics: ECD Merger with ECA     Retail Head Office
     cost optimization                restructuring                    then ECS impulse            cost optimization

    ~60m PLN                     ~10m PLN                            ~40m PLN                    up to ~40m       PLN
                                                                          (2019-2020)                   (2020)

  9M 2018 EBITDA* evolution
  (PLN m)

      257
                -6.9%                      +21.6%      291                                                Improvement
                              239
                                                                                                          of Wholesale
                 -17.8m
     2,09%                    1,90%
                                           +52m       2,18%                                                  EBITDA
    9M 2016               9M 2017                     9M 2018

                                                                                                                         10
Retail: 1st nationwide proximity supermarket chain in Poland
Entering retail through market consolidation, followed by operational integration, with LT objective to become no. 3 retailer in Poland

                                                                               Ranking of retailers (2017 sales, PLN bn)                                    EV/Sales

                                   7.4 bn PLN 1 527 stores                              Biedronka                                             48            39% (JMT)
                                                                                               Lidl                    16
                                                        538
                                        3,1                                  LT             Tesco                 11                                        36% (TSCO)
                                                                Own       objective
                                                                                           Auchan                 10

                                                                                         Kaufland                 10

                                                                                         Carrefour                10                                         22% (CA)
                                                        989
                                        4,3
                                                                                Delikatesy Centrum            7                                                 ?
                                                                                                              consolidated 5.1
                                                              Franchise                     Żabka             7                                              62% (PE)
                                        Retail Sales      Number                      Intermarche             7
                                        (PLN bn)          Of Stores
                                                                                              Dino        5                                             114% (DIN, IPO)
                                                                                             Netto    3
       Acquisitions               +5 bn PLN            +900 stores
                                                                                         E.Leclerc    3
                                  > Retail Sales          > By 2023                      Stokrotka    3                                                     49% (PE)
        Green Field
                                                                                       Polomarket     2
                                       2-3Y integration to ensure
      Franchise Chain                    standardized business                        Piotr i Paweł   2
                                                                                                                            Profi (Romania)                 68% (PE)
                                         with unified processes
                                                                                                                            Average                           49%

                                                                                                                                 *PE- Private Equity deal           11
Retail: Consistently investing in the future position
Bumps on the road are expected, but potential is huge and Eurocash has proven record for executing challenging business plans

          Selling area (k sqm)                   Sales revenues (PLN bn)                                                 Polish peers EBITDA Margin (2017 or 2016)

                            394                                        7,4
                +66%                                      +60%
                                                                                                                                                           8,5%
         237                                      4,6
                                                                                                                            7,2%
                                                                                        6,3%                                                                         6,6%
                                                                                                                                        5,9%      6,2%

         2016                 2017                2016                 2017
                                                                                                    4,5%
                        incl. EKO&Mila                           incl. EKO&Mila

          No. of stores                          Sales per sqm (k PLN)
                          1 527                 20,1                                                        2,1%
         1 086 +41%
                                                                     18,1

                                                                                        2016        2017       3Q 2018     Biedronka   Kaufland   Żabka    Dino      Netto
         2016               2017                2016                2017
                      incl. EKO&Mila                                                           Eurocash Retail
                                                              incl. EKO&Mila

                                                                                  INTEGRATION:

                              STORES REMODELING                                HO & OPERATIONS                    SALES                         EXPANSION
                                                                                                                  DEVELOPMENT                      ACCELERATION
     EKO – 183 stores (Sept),191 (Oct 2018)     Mila start in 2019

  2017                                   2018                    2019                                   2020                                        2021

                                                                                                                                                                         12
Projects: delivering innovative form of category development
Each start-up was unprofitable in initial phase, but nowadays gives competitive advantage and profits

                     FRESH PROJECT                                FAKTORIA WIN                                WHISKY
                     Break even point in 3.5 years                Reinvented wine category                    Total market has been recently developed
                                                                  in small stores                             mainly by small format stores
  Further potential for growth:
       Increase of Delikatesy Centrum penetration                                                                        Whisky market share
                                                                   Example how to bring large
       Development to Lewiatan, Gama, Euro Sklep, Groszek        format category to small stores         33%35%                2017    2018 YTD
                                                                                                                                                        30%32%
       Expansion with own retail chain
                                                                                                                          19%17%         17%16%

      Fresh Project sales evolution (PLN m)                       Small Format stores market share
                                                                                                         Discounters    Hypermarkets Supermarkets Small Stores

                                                            156                               34.7%
                                                137   146
                                          132                                                              Whisky sales dynamics in 2018 (July YTD)
                                  121
                             98
                        83                                                       30.6%
                57                                                  29.6%                                17%                                               14%
          45
   35
                                                                                                                           3%              3%

 1Q 2016 2Q     3Q      4Q 1Q 2017 2Q     3Q    4Q 1Q 2018 2Q        2013         2015          2017   Discounters     Hypermarkets    Supermarkets    Small Stores

                                                                                                                                             Source: Nielsen

                                                                                                                                                               13
Projects: innovative store concepts
Other start-ups at initial phase, impacting short-term EBITDA, with high future potential
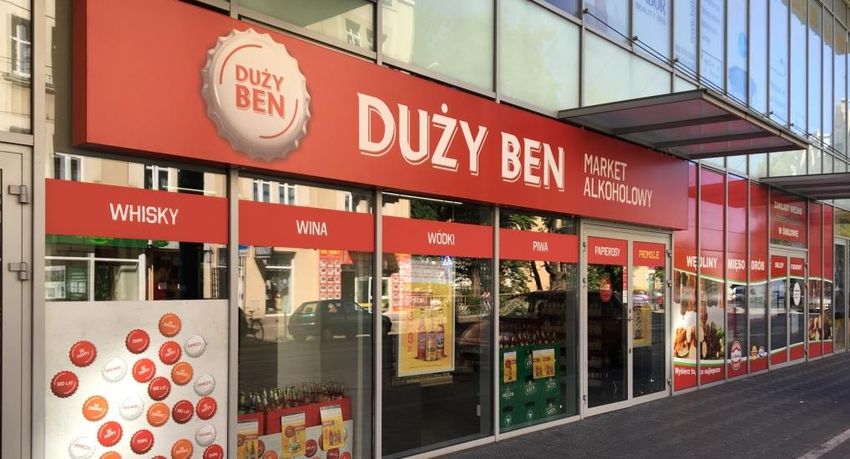
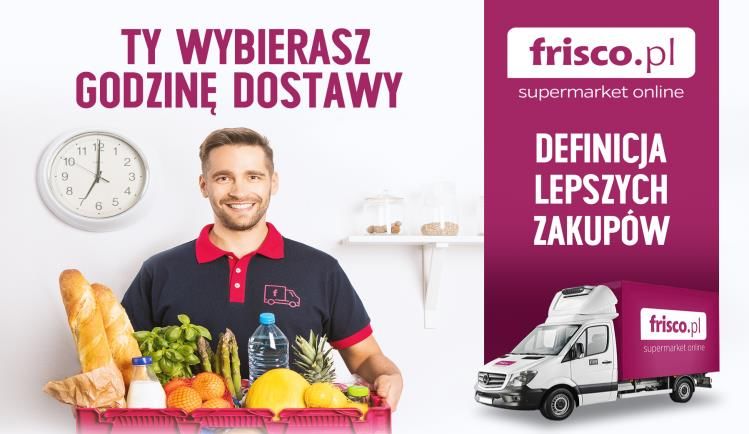
  FRISCO.PL                                                                          DUŻY BEN
    B2C eCommerce Warsaw market leader with app. 40% annual growth                     Proven concept of liquor store – category with Eurocash purchase power

    Development with Delikatesy Centrum to bring stock-up mission to small stores      20 stores: 12 own, 10 franchise and agency

    Fully automated warehouse to be tested as a potential for duplication              Nationwide roll-out initiated with initial clusters development

     in wholesale & retail logistics

                                                                                                                                                                  14
Changing consumer habits are opportunity for small stores in Poland
Proximity and small stores will get even more importance having access to Eurocash innovations

                  Big Shopping                                                                                       Small Shopping
          61%                                                                                                                                                                   73%
                    58%
    55%                                        55%                                                                                                     65%
                          44%                                                                                                                                            51%
                                         38%
                                                                                                                              36%
                                                            23%                                                                                 24%
                                                                   12%                              15%
                                                                                              4%                       7%

                                                                                            Hypermarkets             Supermarkets              Discounters              Small Stores
   Hypermarkets    Supermarkets          Discounters        Small Stores
                                                                                                                 Unexpected need           Daily routine shopping
                      Special Occasion   Stocking Up
                                                                                                   Source: GfK. Q:In which store do you most often perform given types of shopping missions?
                                                                                                                                                                                            .

                                                        Thanks to digitalization, automation and e-commerce growth
                                                  SMALL STORES MAY TAKE OVER BIG SHOPPING FROM LARGE CHAINS

          Growing consumption of F&V,                                         Food: eco, organic,                                         Growing share
          ready meals; less bread, meat, sugar                                veg, regional, exotic                                       of pensioners

                       Growing disposable income                                    e- and m-commerce as standard

                                                              Consumer change from passive to active                                                                                15
Eurocash Group – executive summary

     NO. 1. WHOLESALE DISTRIBUTOR IN POLAND
     with 27% market share & the biggest (3bn Pln) FMCG ecommerce platform

                               DYNAMICALLY ENTERING INTO RETAIL
                               already no. 7 with objective to become no. 3 retail chain in Poland

     WITH INNOVATION AND BUSINESS DEVELOPMENT PROJECTS DELIVERING RESULTS
     addressing digitalization, personalization & automation needs

                  AS THE DOMINANT SMALL FORMAT & PROXIMITY STORE OPERATOR
                  supported by globally changing trends & consumer habits

                                                                                                     16
APPENDIX
9M 2018 Results

                  17
I. Executive Summary

01    SMALL STORES ACCELERATING
      with sales dynamics at +6,3% in 9M 2018 YoY

02    WHOLESALE                                03 RETAIL
      STRONG GROWTH                                 INCREASED ASSET BASE
      with EBITDA + 52m PLN (+21.6%)                with integration impacting profitability

      FRESH ROLL-OUT AT BREAK EVEN                  PAY UP DISPOSAL AGREEMENT
04    with 452m PLN sales                      05   5.8m PLN EBITDA (2017)
      in 9M 2018 (+101m PLN)                        at a price of 110m PLN (in. earn-outs)

     STRONG IMPROVEMENT IN WHOLESALE, PREPARING GROUND FOR RETAIL

                                                                                               18
III. Wholesale Segment – accelerating the growth
9M 2018: +778m PLN sales and +52m PLN EBITDA increase

9M 2018 Sales of goods evolution                     9M 2018 EBITDA evolution
(PLN m)                                              (PLN m)

                                                                                      +21.6%    291
               +2.8%               +6.2%   13 377                  -6.9%
     12 252            12 599                              257
                                                                             239       +52m
                                   +778m
               +347m                                               -17.8m

                                                                                               2,18%
                                                          2,09%
                                                                            1,90%

     9M 2016           9M 2017             9M 2018       9M 2016            9M 2017            9M 2018

 Strong performance in 9M 2018 with sales +6.2%, EBITDA +21.5% and EBIT +32.7% YoY.

 Cost pressure covered by improved efficiency.

                                                                                                         19
III. Retail – increased asset base, ongoing integration
Integration affecting short-term retail results

9M 2018 Sales of goods evolution                                        9M 2018 EBITDA evolution
(PLN m)                                                                 (PLN m)
                                                     3 622
                                                     pro forma

                                         +41%
                                        incl. Mila
                                                      3 032                                 +15.6%     106
               +44.3%                                                               91
                             2 564
                                                                                               +14m               -40.5%
    1 795       +768m
                                          +18.3%                                                                              63
                                                                                  5,09%
                                         +461m                                                                      -43m
                                                                                                       4,12%

                                                                                                                             2,07%

   9M 2016                   9M 2017                 9M 2018                      9M 2016             9M 2017               9M 2018

 Sales increase driven by M&A. Consolidated 2018 Mila sales 466 m PLN (345m in 3Q 2018)

 Delikatesy Centrum LFL in 9M 2018 + 2.7% wholesale and +0.5% retail. 3Q 2018: -0.3% wholesale and -2.0% retail

 M&A impacting EBITDA with ongoing integration incl: stores remodeling (183 DC stores), Head Office integration, pricing and assortment
   policy standardization.

                                                                                                                                       20
III. Projects – investments in the future growth
Fresh Project reached break even point in 3Q 2018

9M 2018 Sales of goods evolution                                               9M 2018 EBITDA evolution
(PLN m)                                                                        (PLN m)

                                                                                    9M 2016               9M 2017         9M 2018
                                           +111m          506
                 +225m          395

                                                                                                                          -6,41%
      170
                                                                                         -26              -9,95%
                                                                                                 -13m
                                                                                                                    +7m    -32
    9M 2016                  9M 2017                    9M 2018                     -15,26%                -39

 Fresh Project with 452m PLN sales in 9m 2018 (+101m) reached break even in 3Q 2018.

      Most relevant for Delikatesy Centrum positioning and competitiveness.

 Duży Ben & Kontigo – moved into proven franchise system.

      Duży Ben: 15 stores with 4 in franchise / agency model

                                                                                                                                    21
IV. 9M 2018 financial summary
     Strong sales increase driven by wholesale segment

                                                        % of Sales     % of Sales
PLN m (Normalized*)        9M 2017        9M 2018                                 Y/Y Change
                                                         9M 2017        9M 2018
                                                                                                     Sales driven mainly by wholesale segment
                                                                                                       (+778m PLN) and consolidation of Mila
Net sales (total)          15 659         17 032                                          9%
                                                                                                       (+466m PLN).
Gross profit                1 814          2 073          11,6%          12,2%           14%
                                                                                                     Gross Margin increase mainly by

EBITDA normalized*           259            265           1,7%            1,6%            2%           consolidation of Mila.

                                                                                                     Normalized EBITDA increased by 6m PLN,
One-off costs*               114              3
                                                                                                       driven by wholesale segment, and off-set by
EBITDA reported*            144,8          261,8          0,9%            1,5%           81%           EKO & Mila integration.

                                                                                                     Depreciation driven by retail segment.
EBIT normalized*            126,0          115,0          0,8%            0,7%           -9%

Profit before tax                                                                                    Net Profit affected by increased effective tax
                             99,9           82,0          0,6%            0,5%           -18%
normalized*                                                                                            rate due to changes in law.

Net profit normalized*       75,1           58,7          0,5%            0,3%           -22%

                         * 2018 results normalized by costs of Mila M&A, 2017 by add. VAT payment

                                                                                                                                                       22
IV. EBITDA* performance by segments
Core business results strong improvement, off-set by 2017-18 M&A

9M 2018 EBITDA development by segments
(PLN m)

                                 52                           43                      7

                                                                                                            13

                       Profit increase in most
                        businesses (ECD, EC
          259                                                                                                                     262
                        C&C, ECA, Food
                        Service)                                              Fresh Project at      Provision for
                       Wholesale sales                                        break even point       employees bonuses,
                        development                                           Duży Ben roll-out      compliance (incl.
                        outperform total food          EKO & Mila
                                                                               with franchise and     GDPR), IT, Quality
                        market                           impacting results
                                                                               agency model           Control

Eurocash Group 2017        Wholesale                         Retail               Projects                 Other           Eurocash Group 2018

                      * 2017 results normalized by costs of add. VAT                                                                             23
IV. Cash Flow
        LTM Operating CF at 138% EBITDA

PLN m                          3Q 2017   3Q 2018   9M 2017   9M 2018
                                                                              Cash conversion cycle                                                      Mila effect
                                                                              (after IFRS 15)

Net operating cash flow          112       115       284       301      40        31            31         28      30          30            27              24
                                                                        20
Net profit (loss) before tax     49        37        (14)      79                 25                               24          24            24
                                                                                                23         21                                                20
                                                                         0
Depreciation                     43        54        133       150
                                                                        -20
Change in working capital        33        21        174       83                (21)           (21)      (22)
                                                                        -40                                       (27)        (23)          (25)            (24)
Other                            (13)       4        (9)       (11)                                                                                         (69)
                                                                        -60                               (71)
                                                                                 (76)           (75)                          (77)          (76)
                                                                                                                  (81)
Net investment cash flow         (81)      (37)     (285)     (415)     -80

Net financial cash flow          (79)      (74)      (81)      64      -100
                                                                                Q1 2017         Q2         Q3      Q4        Q1 2018         Q2              Q3
Total cash flow                  (48)      (0)       (82)      (54)
                                                                                 Receivables           Stock     Cash conversion           Liabilities

         Strong cash generation sustained in 9M 2018.
         Consolidation of Mila changing rotation of each WC component but with no impact on total Net WC rotation.

                                                                                                                              *12M – ostatnie 12 miesięcy      24
IV. Net debt vs. LTM EBITDA**
Healthy and declining leverage thanks to strong cash generation

Net Debt* vs. 12M EBITDA in 3Q 2018

                                                                                                                                               1,90
                                                                                                                                                               1,67

  1,36                                                                                                         1,29
                      1,10                             1,11                                                                                      0,93x
                                                                                       1,02
                                                                                                                                                                        0,71x

                                                                                                                                                    335
                                                                                                                                                 excl. M&A
                                                                                                                                                                        258
                                                                                                                                                                    excl. M&A

431   584        441         486                 419          464                 361         370           363      468                 360        685      363        608
  1Q'17                 2Q                               3Q                              4Q                   1Q'18                            2Q                  3Q
                                           LTM EBITDA (PLN m)                      NET DEBT (PLN m)           NET DEBT / EBITDA

 Net Debt decrease by 77m PLN 3Q 2018

                 *NET DEBT - the sum of long and short term loans, borrowings and financial liabilities less cash and cash equivalents
                 **Adjusted for one-off item – 114 m PLN potential VAT liability payment done in Aug 2017
                                                                                                                                                                                25
IV. PayUp disposal to Polskie ePłatności
Finalization upon receiving consent from antimonopoly office

      Maximum price:
                                                                           2015        2016       2017

      PLN 110 m                              Sales Revenues
                                             (before IFRS15)
                                                                            220         329        440
      (depends on earn-outs)
                                             EBITDA                         0,8         4,1        5,8
                                             EBITDA %                      0,3%        1,2%       1,3%
      Estimated maximum net profit
                                             EBIT                           -2,1        0,3        0,7
                                             EBIT %                        -1,0%       0,1%       0,2%
      PLN 102 m

      Long-term cooperation                                    Eurocash Group will focus on its core
      agreement                                                business

                                                                                                         26
Eurocash generates cash to keep investing for future competitiveness
 Cash generative business model funds M&A and innovation for long-term even in recent tough business context
        Operational Cash Flow* vs. EBITDA*                                                                                            Cash Conversion (in days)

          93%         100%          137%        135%              60%         206%           74%          163%                 0,0
1 200                                                                                                                250%
                                                                                   978
1 000                                                                                                                200%      -5,0                                                                        Eurocash:
 800                                     670                                                                                                     -5,8
                                                                                                              589    150%
                                                      542                                                                     -10,0                                                                        Ability to generate
 600                               490                                       476
                                                402             412                        440    324
                                                                                                        361          100%                               -11,1                                              cash necessary to
 400
         231   216   266   266                                        246                                                     -15,0   -12,4                             -13,2
                                                                                                                     50%
                                                                                                                                                                                                           invest into future
 200
                                                                                                                              -20,0                             -17,2                   -17,6              growth
   0                                                                                                                 0%                                                         -19,4
          2010        2011          2012         2013             2014        2015          2016          2017
                                                                                                                              -25,0                                                                -22,0
                                  EBITDA              Operating cash flow            OCF/EBITDA                                       2010       2011    2012   2013    2014     2015    2016      2017

         Eurocash EBITDA margin %
         vs. gross salary and inflation in PL                                                                                                    New Projects EBIT (PLN m)

                                                                                                                                                        2015             2016               2017           New initiatives impact
 5,0%                                                                             4,5%        4,4%                    5,0%                   0                                                             short term profitability
                      4,3%                                                                                    3,9%
 4,0%
                                         3,7%                         3,7%
                                                                                                                      4,0%
                                                                                                                                         -10                                                               but are investment
           3,0%
                       2,7%
                                     3,0%                                                                                                -20                                                               into future
 3,0%                                             2,4%             2,4%           2,3%                                3,0%                              -19
                                                                                              2,1%                                       -30                                                               competitiveness of our
        2,6%                                       2,0%                                                       1,6%
 2,0%                                                                                                                 2,0%               -40                                                               clients
                       0,9%
           0,8%                                                                                               2,0%
 1,0%                                                                                                                 1,0%               -50
                                     -0,2%                                                                                                                               -43
 0,0%                                             0,9%                                                                0,0%               -60                                                -53
-1,0%                                                              0,0%                                               -1,0%
                                                                                  -0,9%       -0,6%
-2,0%                                                                                                                 -2,0%                                                                                Clear potential to
           2010        2011          2012         2013             2014           2015        2016            2017                                                                                         increase profits
                           Eurocash EBITDA margin %                Gross Salary             CPI (Inflation)

 We kept investing despite unfavorable macro trends and growing costs of innovative projects
                                                                                                                                                                                * 2017 adjusted by one-off items, VAT issue   27
Disclaimer
    This presentation and the associated slides and discussion contain forward-looking statements. These statements are naturally subject to
    uncertainty and changes in circumstances. Those forward-looking statements may include, but are not limited to, those regarding capital
    employed, capital expenditure, cash flows, costs, savings, debt, demand, depreciation, disposals, dividends, earnings, efficiency, gearing,
    growth, improvements, investments, margins, performance, prices, production, productivity, profits, reserves, returns, sales, share buy
    backs, special and exceptional items, strategy, synergies, tax rates, trends, value, volumes, and the effects of Eurocash S.A. merger and
    acquisition activities. These forward-looking statements are subject to risks, uncertainties and other factors, which could cause actual
    results to differ materially from those expressed or implied by these forward-looking statements. These risks, uncertainties and other factors
    include, but are not limited to developments in government regulations, foreign exchange rates, oil and gas prices, political stability,
    economic growth and the completion of ongoing transactions. Many of these factors are beyond the Company's ability to control or predict.
    Given these and other uncertainties, you are cautioned not to place undue reliance on any of the forward looking statements contained
    herein or otherwise. The Company does not undertake any obligation to release publicly any revisions to these forward-looking statements
    (which speak only as of the date hereof) to reflect events or circumstances after the date hereof or to reflect the occurrence of unanticipated
    events, except as maybe required under applicable securities laws. Statements and data contained in this presentation and the associated
    slides and discussions, which relate to the performance of Eurocash S.A. in this and future years, represent plans, targets or projections.

                                     For more information please contact:
                                                                Cezary Giza
                                                           Investor Relations Director

                                                           cezary.giza@eurocash.pl
                                                            mobile: +48 693 930 415

                                                                                                                                             28
You can also read