2021 Midyear Retail Utah Market Report - Newmark Grubb ...
←
→
Page content transcription
If your browser does not render page correctly, please read the page content below
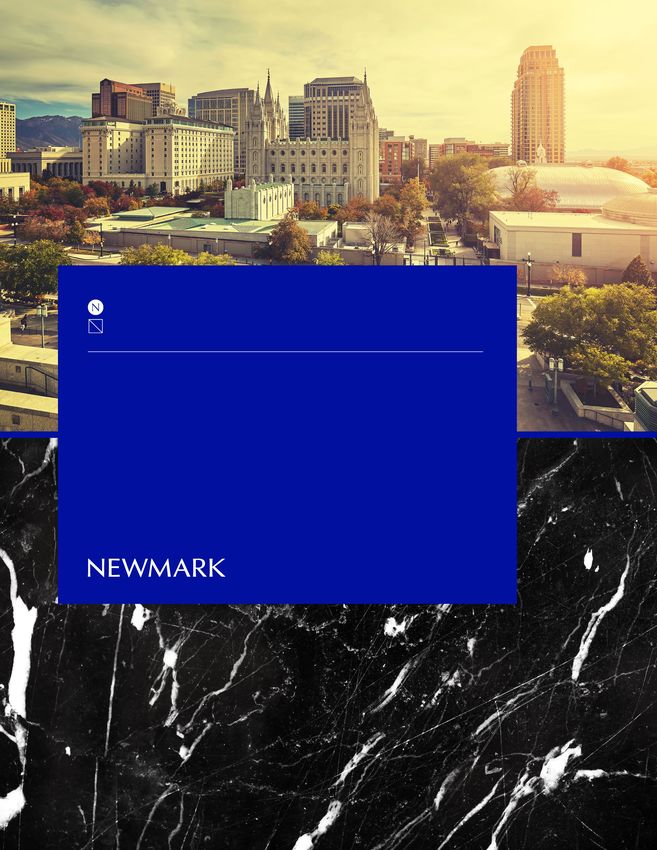
RESEARCH l 2021

      2021 Midyear Retail
      Utah Market Report

nmrk.com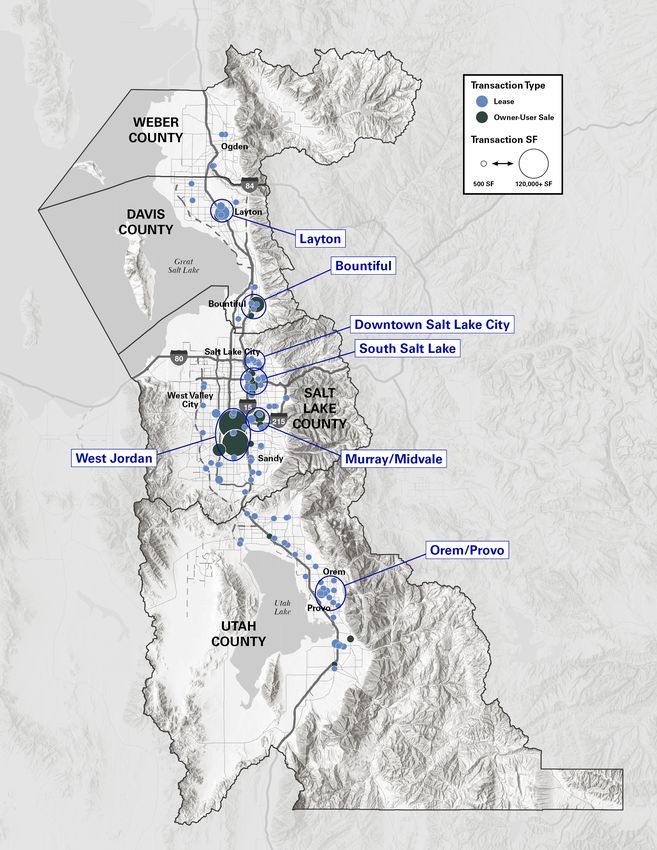
RESEARCH DEPARTMENT:
Rich Lachowsky – Director of Operations/Research
Amelia Yates – Research Manager
Adam Juhl – Research Coordinator

MARKETING DEPARTMENT:
                                                   All information contained in this publication is derived from sources that are deemed to be reliable. However,
Tami Goodwin – Marketing Manager                   Newmark has not verified any such information, and the same constitutes the statements and representations only of
                                                   the source thereof, and not of Newmark. Any recipient of this publication should independently verify such information
Brady Anderson – Senior Graphic Designer           and all other information that may be material to any decision that recipient may make in response to this publication,
                                                   and should consult with professionals of the recipient's choice with regard to all aspects of that decision, including its
Morgan Jensen – Junior Graphic Designer            legal, financial, and tax aspects and implications. Any recipient of this publication may not, without the prior written
                                                   approval of Newmark, distribute, disseminate, publish, transmit, copy, broadcast, upload, download, or in any other
                                                   way reproduce this publication or any of the information it contains. This document is intended for informational
Allen Greenwell – GIS Manager                      purposes only and none of the content is intended to advise or otherwise recommend a specific strategy. It is not to be
                                                   relied upon in any way to predict market movement, investment in securities, transactions, investment strategies or
Michelle Packer – GIS Technician                   any other matter.
Utah Accolades

                                                           U.S. News & World
            #1                 Best State Economy
                               (2021)                      Report

                                                           Rich States,
            #1                 Best Economic Outlook
                               (14th Year in a Row)        Poor States

            #2                 Most Startup Activity
                               (2021)                      WalletHub

            #3                 States for Doing Business
                               (2021)                      CNBC

Utah in the News
Salt Lake Tribune – “The outdoors is Utah tech firms’ No. 1 recruiting
tool” (July, 2021)
Nearly 80% of those that have located to Utah said outdoor recreation was an important
fact for relocation to the state.

Deseret News – “Facebook data center operational as construction
continues” (July, 2021)
Facebook’s data center starts operations in Eagle Mountain in first phase as the $1 billion
project is set to occupy nearly 1.5 million square feet at completion.

Fox News – “Mountain View Corridor connects to SR 201, alleviating
commute” (June, 2021)
The west side roadway in Salt Lake County connects to an east-west freeway for the first
time, extending the corridor 21 miles.
Utah by the Numbers

                                                             2021 TOTAL                                   2010-2021      ANNUAL JOB   PERCENT WITH
                                                            POPULATION                                   POPULATION       GROWTH      BACHELOR’S OR
                                                                                                       ANNUAL GROWTH     (MAY 2021)      HIGHER
                                                                                                            RATE

  United States
  of America
                                                       333,934,112                                                0.7%     9.0%         33.6%

  State of Utah                                            3,370,531                                              1.8%     7.7%         35.1%

  Wasatch Front                                            2,536,728                                              1.8%     7.7%         36.9%

  Weber County                                               266,966                                              1.3%     9.5%         25.3%

  Davis County                                               360,016                                              1.4%     9.5%         38.6%

  Salt Lake County                                         1,207,807                                              1.4%     7.1%         36.6%

  Utah County                                                701,939                                              2.8%     7.6%         41.9%

Source: EsriBusiness Analyst Online (2021), Bureau of Labor Statistics (2021), American Community Survey (2021)
Retail
WASATCH FRONT MARKET OVERVIEW
Written by: Adam Juhl, Research Coordinator
As the U.S. economy continues to recover from the effects of the
pandemic, the Wasatch Front has seen a healthy uptick in commercial real
Quick Stats
estate activity across all product types. Although retail has bounced back Year-
BPS/%
Last 12 Months Over-Year
nicely from of the second half of 2020, the pandemic accelerated trends Change
Change
that were already beginning to make their presence known prior to its
Direct Vacancy Rate 4.3% ▼ -40 BPS
onset. The meteoric rise in ecommerce, paired with the inability of
consumers to leave home, led to retailers either closing doors completely Net Absorption SF 706,111 ▲ 623.6%
or adapting to an online presence without the need for a brick-and-mortar
No. of Lease Trans. 193 ▼ -15.4%
space. Over the last 12 months, leased square footage has dropped over
40%, with a total of 698,526 square feet leased. Although it looks like Leased SF 698,526 ▼ -40.4%
retail may be trending upward due to a drop in vacancy (4.3% at midyear No. of Owner-User Sale Trans. 42 ▲ 16.7%
2021) and a rise in net absorption (706,111 square feet), this is likely due
to landlords and tenants putting space on the market sometime in 2020 due Owner-User Sold SF 612,292 ▲ 6.9%
to economic uncertainty and have since pulled it off, resulting in lower No. of Investment Sale Trans. 50 ▼ -33.3%
leasing activity however, also indicating that the closures and downsizes of
retailers are slowing down. Price-Weighted Avg. Cap Rate 6.0% ▼ 70 BPS
Total Investment Dollar
$162.5 M ▼ -48.5%
Essential retailers that experienced success throughout the pandemic have Volume
continued that growth with the addition of new locations and expansions. Last 12 Months and Prior Year: 06/01/2020-05/31/2021, 06/01/2019-05/31/2020.
Demand for standalone drive-through space has remained high. A bright Source: Newmark Research
spot for retailers is in fast casual dining, such as the popular Tex-Mex
restaurant Chipotle. With the continued fall in leasing activity, inversely, owner-user sales have increased. There was a total of 42
owner-user sale transactions in the past year, up 16.7% from the previous year. This resulted in over 600,000 square feet transacted
in sales along the Wasatch Front. This trend is likely to continue heading into the second half of the year, with banks offering
competitive interest rates and companies looking for more control over their spaces.
Heading into the second half of 2021, interest from investors will likely remain dampened compared to activity prior to the onset of
COVID-19, and uncertainty regarding consumer confidence remains. The total number of investment sale transactions fell by 33.3%
and total investment dollar volume took the biggest hit over the last year, down nearly 50% year-over-year, coming in at $163
million. If investors are willing to take a chance in retail, they are going to be paying premium prices on a per-square-foot basis.
Single tenant properties increased to $648.74/SF from $620.62/SF at the end of 2020, with multi-tenant increasing 30.2% for the
same time frame. Single-tenant price-weighted average cap rates have remained level at 5.5% and remain in high demand from
investors, while multi-tenant saw a 10-basis-point increase during the first half of 2021. These consistent cap rate levels are largely
due to the lack of demand for retail investment opportunities, and investors being extremely cautious and taking less risks when it
comes to placing capital in retail properties.
© Newmark 2021. All Rights Reserved Newmark Utah Midyear Report 2021 IMidyear 2021 Active Retail Areas – The Wasatch Front
© Newmark
Source: 2021. All
Newmark Research Rights Reserved Newmark Utah Midyear Report 2021 IRetail Wasatch Front Market Overview
NET ABSORPTION SF AND DIRECT VACANCY RATE
1,000,000 6.3%
750,000 5.0%
Direct Vacancy Rate
Square Feet
500,000 3.8%
250,000 2.5%
- 1.3%
(250,000) 0.0%
H2 2017 H1 2018 H2 2018 H1 2019 H2 2019 H1 2020 H2 2020 H1 2021
Net Absorption SF 721,890 853,690 830,425 20,181 (25,905) (108,957) (66,974) 773,085
Direct Vacancy Rate 4.0% 4.1% 3.9% 4.1% 4.4% 4.7% 4.9% 4.3%
Source: CoStar
ACHIEVED AVERAGE LEASE RATES PSF (NNN)
$35.00
$29.00
$23.00
$17.00
$11.00
$5.00
2014 2015 2016 2017 2018 2019 2020 H1 2021
Overall $17.28 $14.80 $17.67 $17.60 $16.70 $18.11 $16.37 $21.33
0 - 4,999 SF $22.89 $23.26 $23.18 $23.87 $24.10 $25.08 $26.32 $30.07
5,000 - 9,999 SF $17.89 $13.12 $17.22 $17.89 $14.72 $14.09 $17.22 $14.53
10,000 - 19,999 SF $10.32 $20.53 $13.56 $13.42 $15.23 $11.83 $10.95 $11.38
20,000 - 39,999 SF $11.77 $11.15 $11.44 $11.26 $11.21 $8.50 $9.56 $9.93
40,000+ SF $12.00 $9.35 $10.50 $12.70 $7.44 $10.04 $10.47 -
All average lease rates are square foot weighted averages and are grossed down to a NNN yearly PSF equivalent. All lease transaction data includes renewals.
Source: Newmark Research
© Newmark 2021. All Rights Reserved Newmark Utah Midyear Report 2021 IRetail Wasatch Front Market Overview
MIDYEAR 2021 LEASE OVERVIEW BY LEASED SF
20,873
6%
0 - 4,999 SF
101,172 5,000 - 9,999 SF
29%
180,042 10,000 - 19,999 SF
51%
20,000 - 39,999 SF
48,355
14%
All lease transaction data includes renewals.
Source: Newmark Research
ACHIEVED AVERAGE OWNER-USER SALE PRICES PSF
$350.00
$280.00
$210.00
$140.00
$70.00
$0.00
2014 2015 2016 2017 2018 2019 2020 H1 2021
Overall $153.02 $169.55 $184.35 $187.04 $192.84 $163.77 $257.11 $195.28
0 - 4,999 SF $225.46 $222.78 $254.43 $254.99 $266.22 $224.50 $313.53 $276.55
5,000 - 9,999 SF $93.47 - $156.21 $167.25 $100.60 $152.80 $151.34 $189.61
10,000 - 19,999 SF $79.37 $84.40 $94.15 $94.47 $126.48 $148.44 $99.71 -
20,000 - 39,999 SF $84.53 $45.99 $16.83 $43.31 $147.87 $144.92 $90.35 $138.99
40,000+ SF $41.70 $58.94 $13.10 $39.62 $36.20 $57.40 $23.98 $50.05
All owner-user sale data excludes investment sales.
Source: Newmark Research
© Newmark 2021. All Rights Reserved Newmark Utah Midyear Report 2021 IRetail Wasatch Front Market Overview
OWNER-USER SOLD SF
500,000
445,808
400,000
329,495
300,000
240,699 243,062
223,301
192,224
200,000
166,484
141,650
100,000
0
H2 2017 H1 2018 H2 2018 H1 2019 H2 2019 H1 2020 H2 2020 H1 2021
All owner-user sale data excludes investment sales.
Source: Newmark Research
UTAH RETAIL INVESTMENT PRICE-WEIGHTED AVERAGE CAP RATES
AND ACHIEVED SALE PRICES PSF
10.0% $750.00
8.0% $600.00
Price-Weighted Average Cap Rate
Average Sale Price PSF
6.0% $450.00
4.0% $300.00
2.0% $150.00
0.0% $0.00
H1
2014 2015 2016 2017 2018 2019 2020
2021
Single Tenant Price-Weighted Average Cap Rate 6.5% 6.8% 6.7% 5.8% 6.4% 6.1% 5.5% 5.5%
Multi-Tenant Price-Weighted Average Cap Rate 7.4% 7.2% 7.7% 7.6% 7.2% 6.9% 7.1% 7.2%
Single Tenant Achieved Sale Price PSF $322.46 $395.32 $383.54 $441.17 $446.78 $549.32 $620.62 $648.74
Multi-Tenant Achieved Sale Price PSF $259.22 $259.92 $276.41 $321.02 $278.41 $231.85 $276.17 $359.46
Investment sale data includes all investment sales for the state of Utah with a sale price of $800,000 and above and excludes owner-user sales.
Source: Newmark Research
© Newmark 2021. All Rights Reserved Newmark Utah Midyear Report 2021 IRetail Wasatch Front Market Overview
UTAH RETAIL INVESTMENT SALE TRANSACTION DOLLAR VOLUME, MILLIONS
$ 500.0
$ 400.0
$ 300.0
Millions
$ 200.0
$ 100.0
$ 0.0
H2 2017 H1 2018 H2 2018 H1 2019 H2 2019 H1 2020 H2 2020 H1 2021
Total $180.0 M $368.1 M $195.0 M $269.1 M $168.7 M $146.6 M $119.6 M $42.9 M
Single Teant Dollar Volume $38.2 M $87.5 M $128.1 M $85.7 M $76.7 M $35.4 M $64.7 M $27.5 M
Multi-Tenant Dollar Volume $141.9 M $280.6 M $67.0 M $183.4 M $92.0 M $111.2 M $54.9 M $15.3 M
Investment sale data includes all investment sales for the state of Utah with a sale price of $800,000 and above and excludes owner-user sales.
Source: Newmark Research
© Newmark 2021. All Rights Reserved Newmark Utah Midyear Report 2021 IRetail Wasatch Front Market Overview Midyear 2021 Notable Lease Transactions Building/Address Tenant SF City Layton Hills Mall Dick’s Sporting Goods 46,555 Layton The Family Center at Orem Autozone 20,873 Orem 237 S. 2200 W. Caliber Collision 16,100 Springville I-15 Marketplace Wallaroo’s Furniture & Mattresses 12,000 Salt Lake City 5670 S. Redwood Rd. Aaron Rents 10,500 Taylorsville 2978 S. State St. Lakehouse Studios 8,890 South Salt Lake Layton Crossing Burn Boot Camp 7,475 Layton Olympus Hills Utah Tumbling Academy 7,000 Millcreek 1750 W. Traverse Pkwy. Farr Better Pets 6,500 Lehi Rockwell Ridge ‘Bout Time Pub & Grub 5,405 Bluffdale 10660 S. State St. Sunday’s Best 4,400 Sandy 4682 S. 5600 W. 7-Eleven 4,191 West Valley City 9th & 9th Retail The Crack Shack 3,360 Salt Lake City 1758 W. 5400 S. Local Greek 2,291 Taylorsville 1283 N. University Ave. Chipotle 2,850 Provo Source: Newmark Research © Newmark 2021. All Rights Reserved Newmark Utah Midyear Report 2021 I
Retail Wasatch Front Market Overview

 Midyear 2021 Notable Owner-User Sale Transactions

 Building/Address                               Buyer                SF                City

 6748 S. Redwood Rd.                     The Grace Company          121,956            West Jordan

 1442 W. 9000 S.                         Seoul Trading USA Co.      108,303            West Jordan

 535 S. Main St.                          C-A-L Ranch Stores        50,000             Bountiful

 9032 S. State St.                        Lucky’s Auto Credit        7,834             Sandy

Source: Newmark Research

 Midyear 2021 Notable Utah Investment Transactions

 Building/Address                               Buyer                SF               City

 5470 S. 4220 W.                            JS Service Group        21,160             Kearns

 791 S. Main St.                            Swanson Capital         14,480             Pleasant Grove

 Lehi Crossing                            Milestone Holdings         7,013             Lehi

 The Hut Food Hall                          Wasatch Group            5,100             Provo

 Slim Chickens – Anthem Center          Robert & Adell Hild Trust    5,000             Herriman

  3883 W. 4500 S.                       Trinity Restaurant Group     3,501             Taylorsville

  7-Eleven, 7269 S. Union Park. Ave.     Beshirian Investments       2,976             Midvale

Source: Newmark Research

  © Newmark 2021. All Rights Reserved                                     Newmark Utah Midyear Report 2021 I
Retail Agents

Tony Coop                    Josh Evans                Ted Lacy                   John Owens                     Jonathan Owens
Director                     Associate                 Managing Director          Director                       Director
t 801-578-5528               t 801-746-4770            t 801-746-4712             t 801-578-5567                 t 801-578-5568
tony.coop@nmrk.com           josh.evans@nmrk.com       ted.lacy@nmrk.com          john.owens@nmrk.com            jonathan.owens@nmrk.com

Gabe Philips                  Tyler Roeller            Sherry Schoen              Matt Stephens
Associate                     Managing Director        (Boise, ID)                Senior Managing Director
t 801-578-5571                t 801-746-4738           Senior Managing Director   t 801-746-4752
gabe.phillips@nmrk.com        tyler.roeller@nmrk.com   t 208-870-6933             matt.stephens@nmrk.com
                                                       sherry.schoen@nmrk.com

© Newmark 2021. All Rights Reserved                                                                          Newmark Utah Midyear Report 2021 I
Appendix Retail
Introduction:
This report is a snapshot of Utah’s Wasatch Front retail real estate market. While most agree that the real estate market is best
viewed over long periods of time, we strive to help our clients leverage planning and objectives by providing detailed, timely,
accurate, and comprehensive information. Our goal with the quarterly reports is to reveal trends as they occur. Keep in mind that
with constant market activity and the need to build consistency and accountability in the report, some transactions, and property
availabilities, that surface at the margins of the report dates may be included in a period other than the one you expect. Rest
assured that they are included, however, this underscores the value of taking the longer view. Also, note that the interpretation of
the following report will be greatly enhanced by being familiar with our Methodology and Definitions.
Methodology:
1. Our researchers scour the marketplace daily (internet, phone calls, emails, driving the market) in order to have the most accurate,
complete, and up-to-date information on every retail lease or sale comp in the markets in which we operate.
2. The geographic scope of this report is limited to Davis, Salt Lake, Utah and Weber Counties.
3. Product types are generally consistent with the ICSC shopping center standards.
4. The Midyear 2021 Market Report cut off date is May 31, 2021.
Definitions of Report Terms & Building Types:
• Enclosed Mall – most tenants are in an enclosed mall, although some may have outdoor access or be in buildings outdoors.
• Regional Center – shopping center wherein combined SF of all buildings and tenants is over 350,000 SF, usually with several retail
anchors.
• Community Center – shopping center wherein combined SF of all buildings and tenants is between 100,000 SF
and 350,000 SF, usually with at least two retail anchors.
• Neighborhood Center – shopping center wherein combined SF of all buildings and tenants is between 50,000 SF
and 100,000 SF, usually with at least one retail anchor.
• Anchorless Strip Center – shopping center wherein combined SF of all buildings and tenants is below 50,000 SF, multi-tenant
buildings with no spaces over 10,000 SF and the building is not a pad; also called shop space.
• Free Standing – detached single tenant building without size restriction; not a pad, not in a shopping center. Most commonly
banks, gas stations, restaurants, auto repair shops, car dealerships etc.
• Downtown – usually 1st floor or ground level retail space in office or multifamily buildings downtown; usually without a parking
lot, just street parking.
© Newmark 2021. All Rights Reserved Newmark Utah Midyear Report 2021 ISalt Lake City 376 E. 400 S., Suite 120 Salt Lake City, UT 84111 t 801-578-5588 Davis and Weber Counties 1755 E. 1450 S., Suite 100 Clearfield, UT 84015 t 801-927-2000 Utah County 275 W. 200 N., Suite 203C Lindon, UT 84042 t 801-578-5588 Boise, Idaho 2537 W. State St., Suite 110 Boise, ID 83702 t 208-870-6933 Reno, Nevada 1575 Delucchi Ln., Suite 115 Reno, NV 89502 t 775-825-8000
376 E. 400 S., Suite 120
Salt Lake City, UT 84111
t 801-578-5588

nmrk.com                   All information contained in this publication is derived from sources that are deemed to be reliable. However,
                           Newmark has not verified any such information, and the same constitutes the statements and representations only of
                           the source thereof, and not of Newmark. Any recipient of this publication should independently verify such information
                           and all other information that may be material to any decision that recipient may make in response to this publication,
                           and should consult with professionals of the recipient's choice with regard to all aspects of that decision, including its
                           legal, financial, and tax aspects and implications. Any recipient of this publication may not, without the prior written
                           approval of Newmark, distribute, disseminate, publish, transmit, copy, broadcast, upload, download, or in any other
                           way reproduce this publication or any of the information it contains. This document is intended for informational
                           purposes only and none of the content is intended to advise or otherwise recommend a specific strategy. It is not to be
                           relied upon in any way to predict market movement, investment in securities, transactions, investment strategies or
                           any other matter.
You can also read