MARINE FUEL FACTS - Concawe
←
→
Page content transcription
If your browser does not render page correctly, please read the page content below
MARINE FUEL FACTS

1   BACKGROUND INFORMATION
    1		Background on Shipping
    2		Sources of Atmospheric Sulphur Emissions
    3		Marine Fuel Regulations

2   CURRENT SITUATION,
    ALTERNATIVES AND POSSIBLE OUTCOMES
    1		Refining Impact - Fuel Availability Concerns
    2		Scrubbers and Other Alternatives

3
    3		Timetable and Possible Outcomes

    ENVIRONMENTAL
    AND CLIMATIC IMPACT
    1		Environmental Impact of SO2 emissions
    2		Climate Impact
    3		    Additional Information: Anthropogenic and Natural Sulphate Sources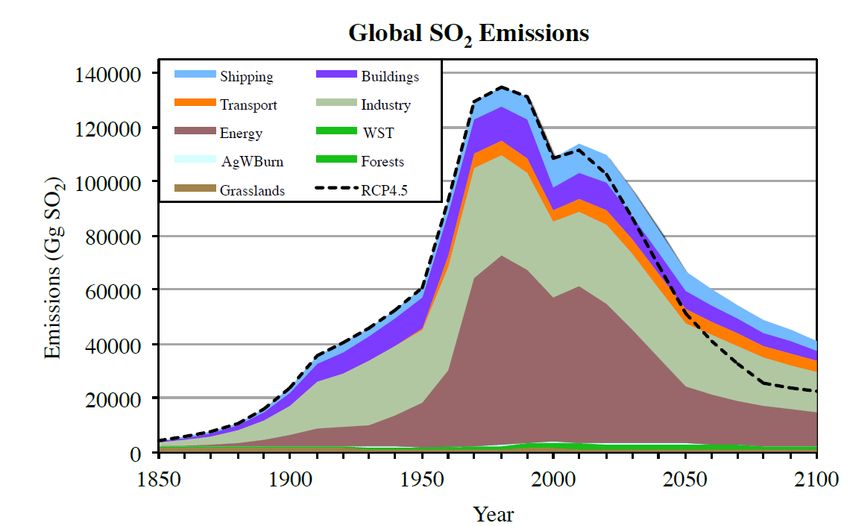
BACKGROUND
INFORMATION

    1		 Background on Shipping
    2		 Sources of Atmospheric Sulphur Emissions
    3		 Marine Fuel Regulations
1 Background Information
1 Background on Shipping
Summary
Around 80% of global trade by volume is carried by sea
Marine Fuel demand: 6.1% of global world oil demand (2012)
Residual Marine Fuel demand: 49.5% of total global residual demand
«Shipping: indispensable to the world»
• Around 80% of global trade by volume and over 70% by value is carried
by sea and is handled by ports worldwide
• More than 50,000 merchant ships are trading internationally
• The world fleet is registered in over 150 nations
Main Flags of Registration World Fleet by Type (% dwt)
– share of world total (% dwt)
Other
Panama 20.13% Ferries & passenger
0.6% 8%
Liberia 11.65%
Chemical tanker
Marshall Islands 10.02%
6%
Hong Kong (China) 8.62% General
Singapore 6.58% cargo
Bulk carries
1% 44%
Malta 4.69% Container
ships
Greece 4.50%
14%
Bahamas 4.33%
China 4.33%
Cyprus 1.92%
Oil tankers
27%
Source: UNCTAD, Review of Maritime Transport 2015, October 2015 Source: IMO 3rd GHG study, MEPC 67/INF.3, July 2014
Note: Due to the rounding, figures may not add up to 100%Marine Fuel Facts | 3
Fuel Consumption by Ship Type (2012)
All other ship types Total Marine Fuel Consumption
8% (2012): 300 Mt
(international + domestic)
Vehicle
3%
Offshore
3%
Cruise Container
4% 22%
Liquefied gas tanker
5%
Fishing
5%
Bulk carrier
Chemical tanker
18%
6%
Ro-Ro and RoPax
6%
General cargo Oil tanker
7% 13%
Sources: IMO 3rd GHG study and BP Statistical Review of World Energy, June 2015
CONCAWE1 Background Information
Marine Fuel Consumption 2012 (Mt/y)
Million tonnes 350
/year Marine Fuel demand:
6.1% of global world oil demand (2012)
300
Residual Marine Fuel demand:
49.5% of total global residual demand
250
200
150
100
LNG — 8 Mt/y
50
MDO — 64 Mt/y
HFO — 228 Mt/y
0
Sources: IMO 3rd GHG study and BP Statistical Review of World Energy, June 2015Marine Fuel Facts | 5
2 Sources of Atmospheric Sulphur Emissions
Summary
Shipping contributes to around 10% of current global man-made SO2 emissions
Projected growth in shipping SO2 emissions is now significantly lower than what was expected in 2008
when the current regulation was adopted
There are also significant natural sources of Sulphur emissions (volcanoes, plankton): three to six times
more sulphate is generated above the oceans from dimethyl sulphide released by plankton than from
SO2 emissions from shipping*
Sulphur is a naturally occurring element, essential for life
Largest man-made sources of global SO2 emissions are land-based:
• In 2005, SO2 emissions from international shipping amounted
to 10% of global anthropogenic emissions
• Land-based emissions projected to decrease substantially in coming decades
(see Global SO2 Emissions graph)
Natural sources of Sulphur emissions are also significant:
• Volcanic emissions
• Biogenic emissions, primarily dimethyl sulfide (DMS) generated by plankton
in the oceans
• Both SO2 and DMS are oxidized to form sulphate aerosols through atmospheric
chemistry processes (see maps in additional information)
Projected shipping emissions are now significantly lower than when the revision
of MARPOL Annex VI was adopted in 2008:
• Improved emission inventory lowered expected growth
* based on data from the 3rd IPCC Assessment Report
CONCAWE1 Background Information
Anthropogenic SO2 Emissions (Mt/y)
140
International Shipping
120 Open Biomass Burning
Africa & Middle-East
100
Australia & New Zealand
80
South & South Asia
60
Russia & CIS
40 Europe
Latin America
20
USA & Canada
1850 1860 1870 1880 1890 1900 1910 1920 1930 1940 1950 1960 1970 1980 1990 2000 2005
Data sources: Smith, Steven J., J. van Aardenne, Z. Klimont, R. J. Andres, A. Volke, and S. Delgado Arias. (2011).
Anthropogenic Sulfur Dioxide Emissions: 1850–2005, Atmospheric Chemistry and Physics, 11:1101–1116 S. J. Smith and T. C. Bond, Two hundred fifty
years of aerosols and climate: the end of the age of aerosols, Atmos.Chem. Phys., 14, 537–549, 2014
Global SO2 Emissions
(100 Gg = 1 Mt)
Source: S. J. Smith and T. C. Bond, Two
hundred fifty years of aerosols and climate:
the end of the age of aerosols, Atmos.
Chem. Phys., 14, 537–549, 2014Marine Fuel Facts | 7
Global Sulphur Emissions to Atmosphere
Million tonnes 60
Sulphur/year
50
40
30 Emission level range
20
10
Note: One tonne of Sulphur to
atmosphere is equivalent to two
tonnes of SO2
0
Data sources: Smith, et al. (2011)
Antropogenic Shipping Biomass Volcanoes Oceans Land biota IPCC 3rd Assessment Report (2001)
(excl. shipping) burning and soils IMO, 3rd GHG report (2014)
Projected Global Shipping SO2 Emissions (Mt/y)
30
2007 IMO projection
(Business As Usual)
25
2007 IMO projection 0,50%
Sulphur global cap 2020
20
IMO 3rd GHG
report actuals
15 Current projection Business
As Usual
Current projection 0,50%
10 Sulphur global cap 2020
5
2005 2010 2015 2020 2025 2030
Data sources: IMO Scientific Group of Experts Report, BLG 12/6/1, 2007
IMO 3rd GHG report (2014), Marine and Energy Consulting Ltd, Outlook for Marine Bunker & Fuel Oil to 2035, May 2014
Concawe inter- and extrapollations
CONCAWE1 Background Information
3 Marine Fuel Regulations
Summary
Bunker Fuel Sulphur is regulated under Annex VI of the MARPOL Convention
The Convention is administered by the Marine Environment Protection Committee
(MEPC) of the International Maritime Organization (IMO)
The Convention foresees reducing the global fuel Sulphur cap
from 3.5% to 0.5% as of 2020, however subject to a review on fuel availability
IMO has initiated the Fuel Availability Review in 2015 and is expected to review
the results at the October 2016 MEPC meeting
Europe has decided unilaterally to implement 0.5% in its Exclusive Economic Zones
(up to 200 nm from the coast) regardless of the forthcoming IMO decision
MARPOL Annex VI Marine Fuel Sulphur Regulation
Global cap Global cap
4.5% Sulphur 3.5% Sulphur
2008 2009 2010 2011 2012 2013 2014 2015 2016
All ECA All ECA All ECA
1.5% Sulphur 1% Sulphur 0.1% SulphurMarine Fuel Facts | 9
International shipping is governed by Conventions administered
by the International Maritime Organization (IMO), a UN body based in London
Annex VI of the International Convention for the Prevention of Pollution
from Ships MARPOL 73/78 covers fuel Sulphur levels
As of March 8, 2016, 86 states have ratified Annex VI,
representing 95.34% of the world's tonnage
IMO’s MEPC maintains MARPOL Annex VI
Global Sulphur Cap
• Mandatory review by 2018 to determine 0.5% Sulphur fuel availability
• IMO’s MEPC to decide whether it will be possible to comply in 2020
IMO has initiated the Fuel Availability Review in 2015
• Steering Committee appointed
• Contractor appointed to perform study (CE Delft)
• Results to be available for discussion at October 2016 MEPC meeting
Supplemental study co-sponsored by several industry bodies
IMO Global cap Global cap
Review 0.5% Sulphur* 0.5% Sulphur*
if compliance
is not possible
by 2020
2017 2018 2019 2020 2021 2022 2023 2024 2025
*Pending October 2016 MFPC meeting review
CONCAWE1 Background Information
Emission Control Areas (ECAs)
Source: Exhaust Gas Cleaning Systems Association, www.egcsa.com
Regional regulations
EU Sulphur in Liquid Fuels Directive
• 0.1% Sulphur at berth since 2010
• 0.5% Sulphur in EU waters effective 2020 (regardless of IMO decision)
California rules – being aligned with IMO
Hong Kong/China: local initiativesMarine Fuel Facts | 11
CONCAWE1 Background Information
CURRENT SITUATION,
ALTERNATIVES AND
POSSIBLE OUTCOMES

    1		Refining Impact - Fuel Availability Concerns
    2  Scrubbers and Other Alternatives
    3		Timetable and Possible Outcomes
2 Current SItuation, Alternatives and Possible Outcomes
1 Refining Impact - Fuel Availability Concerns
Summary
Estimated fuel switch volumes in the range of 2 Mb/d to more than 3 Mb/d
(depending on total demand projection and scrubber/LNG penetration)
Represents an unprecedented step change compared to:
• Annual trend line growth rate for distillate demand: 500 kbd
• Annual trend line decline in residual demand: 150 kbd
• Experience with introduction of 0.1% Sulphur fuel in 2015: 400 kbd
Sound, realistic assessment of fuel availability is key:
• Distillate production, capacity to process residual fuel oil no longer needed
• Impacts on other products
Unprecedented impact of global cap on the refining industry
IEA’s Mid-Term Oil Market Report 2015 expects that 2 Mb/d of fuel oil would need to be
switched to distillate type of fuels, while other sources show even higher switch volume
estimates
Very high switch volume compared long-term distillate growth and fuel oil decline trends:
• Distillate: + 500 kbd/yr
• Fuel oil: - 150 kbd/yr
Critical elements of IMO Fuel Availability Study:
• Realistic forecast of 2020 fuel demand with appropriate high and low cases
• Realistic assessment of scrubber and LNG penetration ahead of 2020
• Solid assessment of general refining and conversion capacities that will be online
by the end of 2019
• Solid global modelling:
▸ C rude outlook and low Sulphur crude opportunities
▸ P roven fuels
▸ N o discontinuity in supply to other petroleum product markets
▸ S urplus fuel oil used as feedstock for conversion units
▸ Interregional trade
▸ A voidance of over-optimisation in aggregated LP modelMarine Fuel Facts | 15
Product Demand Trendline (Mb/d)
40
35
30
Light
25 distillates
20
Middle
15 distillates
10 Fuel oil
5 MD regression
FO regression
1965 1969 1973 1977 1981 1985 1989 1993 1997 2001 2005 2009 2013
1967 1971 1975 1979 1983 1987 1991 1995 1999 2003 2007 2011
Data source: BP Statistical Review of World Energy, June 2015
Petroleum Product Demand Changes (Mb/d)
3.5
3
2.5 Estimation uncertainty
2
1.5
1
0.5
0
Historical annual Historical annual 2015 ECA 2020 global cap
distillate growth fuel oil decline switch volume switch volume
Data sources: BP Statistical Review of World Energy, June 2015
Marine and Energy Consulting Ltd, Outlook for Marine Bunker & Fuel Oil to 2035, May 2014
IEA Mid-Term oil Market report, February 2016
OPEC World Oil Outlook 2015
CONCAWE2 Current SItuation, Alternatives and Possible Outcomes
2 Scrubbers and Other Alternatives
Summary
Production of compliant fuels will involve switching a significant volume of residual fuel
to lower Sulphur distillate type fuels; contribution of LNG expected to be small by 2020
The Convention allows use of exhaust gas scrubbers as an alternative compliance method
• Proven technology, economically viable (new and retrofit, though retrofit not possible
on all ships)
• Several types available: open loop, closed loop, hybrid
• Some local restrictions apply to scrubber effluent and some on-going discussion
in EU on the acceptability of scrubber wash water discharges
• Scrubbers offer overall GHG benefit – net CO₂ reduction of 9 Mt/y compared to removing Sulphur in
European refineries
MARPOL Annex VI requires ships to use fuels with a maximum Sulphur content
• Equivalent compliance methods can be used when approved by Administrations
Exhaust Gas Cleaning Systems (EGCS, also called “scrubbers”) are being used as
equivalent method
• Initial interest in scrubbers from ship owners was limited
▸ See results December 2014 survey European Chamber of Shipping Association
(ECSA)
• EnSys/Navigistics estimated that as of the first half of 2016 some 350 ships had
installed or ordered scrubbers
Several commercially proven scrubber designs:
• Sea Water Scrubber (open loop)
• Fresh Water Scrubber with alkaline reactant (closed loop)
▸ Can operate with zero discharge for a limited time
• Hybridscrubbers can alternate between open and closedloopmodes
Overall energy benefits:
• Considerable CO₂ emission savings can be achieved by scrubbing
▸ The scrubber case would avoid a 17 Mt/y increase in refinery CO2 emissions
▸ Partially offset by 8 Mt/y increase CO2 emissions from scrubber energy need
▸ Net saving of 9 Mt/y (source Concawe Report 1/13R)
Acceptability and technology choice considerations:
• For retrofitting a ship: available space, loss of cargo space, age, stability
• Effluent impact on environmentMarine Fuel Facts | 17
▸ O n-going discussion in EU on the acceptability of scrubber wash water discharges
(in particular when operating in coastal waters and harbours) and on the status of effluents
under the Water Framework Directive
▸ Several measurement campaigns are underway on ships operated with scrubbers
in EU and North America waters
Compliance Method(s) for ECA 0.1% Sulphur Requirements
97.4%
100%
80%
60%
40%
20% 15.4% 15.4%
2.6%
0
Compliant Fuel of 0.1% Scrubbing LNG Methanol
Sulphur content Technology
Data source ECSA
Effect of On-Board Scrubbers on EU Refinery CO2 Emissions
Refinery 165
CO2emissions
(Mt/a)
160
155
17 Mt/a
150
Without scrubbers
145
With scrubbers
140
135
130
2008 2010 2015 2020 2025 2030 Data source
Base Case CONCAWE report 1/13R
CONCAWE2 Current SItuation, Alternatives and Possible Outcomes
3 Timelines and Possible Outcomes
Summary
Earliest possible decision point will be at October 2016 MEPC meeting
MECP will review the results of the IMO Fuel Availability Study and any comments submitted
by IMO Member States and/or Observer Organisations
Regulation 14.10 of Annex VI only foresees two possible outcomes:
• Implementation of the 0.5% Sulphur requirement in 2020 (base case)
• Postponement of the implementation date until 2025
May Draft Report CE Delft available
2016
June Steering Committee comments
2016
July Final Report CE Delft available
2016
August Steering Committee Report to MEPC
2016
October MEPC Review of Fuel Availability Study
Possible decision on implementation date
2016
Next meeting:
Mid- Further discussion and decision making in case
2017 no decision was made in October 2016 meetingMarine Fuel Facts | 19
April 2016 MEPC meeting agreed “in principle” to take the decision at the
October 2016 MEPC meeting
MEPC will review the results of the IMO Fuel Availability Study and any
comments submitted by IMO Member States and/or Observer Organisations
Regulation 14.10 of Annex VI only foresees two possible outcomes:
• Implementation of the 0.5% Sulphur requirement in 2020 (base case)
• Postponement of the implementation date until 2025
Decision will be made by the IMO Member States that have ratified MARPOL
Annex VI
Regulation 14.10
The Parties decide whether
it is possible for ships
to comply withthe 0.5% Sulphur
requirement as of 2020
YES NO
Implementation date Implementation date
of 2020 is confirmed is deferred till 2025
CONCAWE2 Current SItuation, Alternatives and Possible Outcomes
ENVIRONMENTAL
AND CLIMATIC IMPACT

     1		Environmental Impact of SO2 Emissions
     2		Climate Impact
     3		 Additional Information: Anthropogenic
     		 and Natural Sulphate Sources
3 Environmental and Climatic Impact
1 Environmental Impact of SO2 Emissions
Summary
Contribution to air quality on shore decreases rapidly as ships move away from shore
Concentration of sulphate aerosol that reaches land from a ship 25 nm away from shore
is only about 1/10th of concentration from a ship in the harbor
Cost-effectiveness analysis on basis of benefits' analysis as used for EU air policy shows that only
emission reductions close to shore (Marine Fuel Facts | 23
Sulphate PM2.5 Concentration (μg/m3 per kt SO2) at Lisbon Centre (F) Versus
Distance from Shore & Designation of Zones Within 200 nm
Concentration
(SIA_PM2.5µg/m3)
1
SIA_PM2.5µg/m3
0.9
0.8
Zone Average
0.7
200 nm Average
0.6
12 nm
0.5
0.4 25 nm
0.3
50 nm
0.2
0.1
100 nm
0
200 nm
0 50 100 150 200
Nautical miles from F
Source: Aeris re-analysis of Lisbon Ship trajectory study undertaken for Concawe by the Swedish Meteorological and Hydrological Institute,
soon to be published.
Relative Impact of Shipping Emissions as a Function of Distance from Shore
1
Atlantic Coast / Celtic Sea
0.8
0.6
0.4
0.2
0
Source: Aeris Europe, SMARTER
population weighted modelling analysis,
>12 nm 12-25 nm 25-50 nm 50-100 nm 100-200 nm
February 2016
CONCAWE3 Environmental and Climatic Impact
2 Climate Impact
Summary
Removal of Sulphur in refineries around the globe will amount to at least
30 million tonnes CO2/ years – equivalent to 3% increase in global shipping emissions
Sulphate has a significant climate cooling effect – this will be lost when the global cap
is introduced
Global shipping CO₂ emissions represented 2.6% of total CO₂ emissions
(IMO 3rd GHG study, MEPC 67/INF.3, July 2014)
Climate impact is also affected by other pollutants emitted
– Short Lived Climate Forcers (SLCFs)
• E.g. Black Carbon and methane have a warming effect
• Sulphate aerosols have a cooling effect on the climate
• Longer term warming effect of CO₂ will dominate
hipping is assessed to have an overall cooling effect when integrated
S
over a 20 years period
• Warming effect only when integrating over a 100 years period
Reducing the global Sulphur cap to 0.5% will affect climate impact in two ways:
• Increased GHG from the global refining industry to desulphurise refinery streams
and convert heavy residue to lighter fractions
▸ C oncawe analysis for Europe estimates increase at 7.5 Mt CO₂
▸ G lobally increase of 30 Mt/y can be expected
▸ This would be equivalent to a 3% increase in global shipping CO₂ emissions
(2012 basis)
• Short-term cooling effect will essentially be eliminatedMarine Fuel Facts | 25
Shipping Climate Impact - 20 and 100-year time horizon
0.6
0.4
0.2
Temperature impact (mk)
0
-0.2 Aerosol Cloud Lifetime Effect (ACL)
-0.4 SO2
-0.6
NOX
-0.8
CO2
-1
-1.2 net
Shipping 20 years Shipping 100 years
Data source: G. Myhre, D. Shindell, et al., 5th IPCC Assessment - Anthropogenic and Natural Radiative Forcing, 2013
Step-Wise Evolution of Total CO2 Emissions from EU27+2 Refineries
Demand 2025-2030
Demand 2020-2025 Quality-related
Non-ECA bunker 0.5% Sulphur Demand-related
Demand 2015-2020 7.5 Mt/y
ECA bunker 0.1% Sulphur
Non-road Diesel 10 ppm Sulphur 8 Mt/y
Inland Waterway GO 10 ppm Sulphur
Demand 2010-2015
ECA bunker 1% Sulphur
FQD PAH 8%
Demand 2010
Base case - 2008
140 145 150 155 160 165
Source: CONCAWE report 1/13R – Oil refining in the EU in 2020, with perspectives to 2030, available at www.concawe.org
CONCAWE3 Environmental and Climatic Impact
3 Additional Information :
Anthropogenic and Natural Sulphate Sources
Anthropogenic Sulphate Production Rate
Source: Penner, J.E. et al., IPCC 3rd Assessment report, Aerosols, their Direct and Indirect Effects, 2001
Annual average source strength in kg km−2 hr−1
(a) the column average H2SO4 production rate from anthropogenic sources
(b) the column average H2SO4 production rate from natural sources
(DMS and SO2 from volcanoes)Marine Fuel Facts | 27
Natural Sulphate Production Rate
Data source: Penner, J.E. et al., IPCC 3rd Assessment report, Aerosols, their Direct and Indirect Effects, 2001
CONCAWEConcawe Boulevard du Souverain 165, B-1160 Brussels, Belgium Telephone : +32-2 566 91 60 Telefax: +32-2 566 91 81 info@concawe.org www.concawe.org
You can also read