Airborne Monitoring of Sulphur Emissions from Ships in Danish Waters - 2019 Campaign Results
←
→
Page content transcription
If your browser does not render page correctly, please read the page content below
Airborne Monitoring of
Sulphur Emissions from
 Ships in Danish Waters
       2019 Campaign Results
                           Environmental Project
                           no. 2121

                           January 2020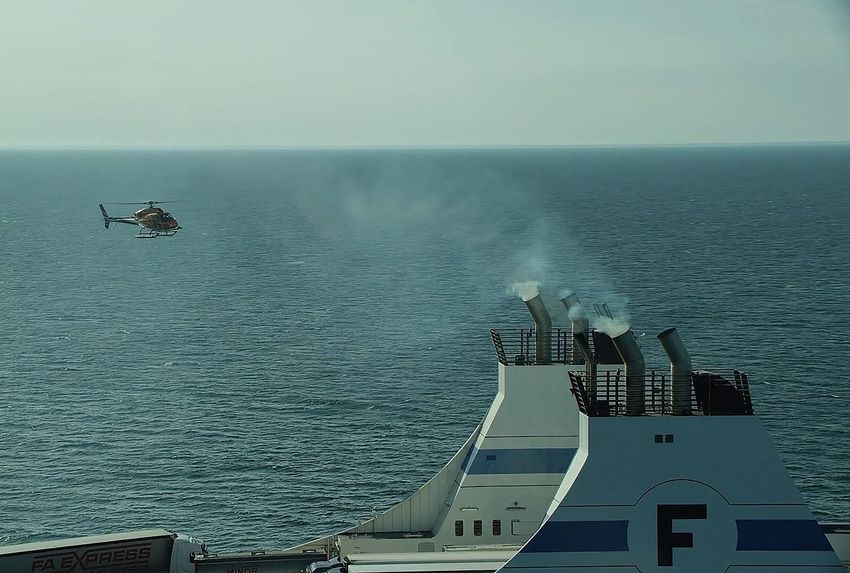
Publisher: The Danish Environmental Protection Agency

        Author: Explicit ApS, www.explicit.dk

        Photos: Explicit ApS

        ISBN: 978-87-7038-157-4

        The Danish Environmental Protection Agency publishes reports and papers about research and development
        Projects within the environmental sector, financed by the Agency. The contents of this publication do not necessarily
        Represent the official views of the Danish Environmental Protection Agency. By publishing this report, the Danish
        Environmental Protection Agency expresses that the content represents an important contribution to the related
        discourse on Danish environmental policy.

        Sources must be acknowledged.

2 The Danish Environmental Protection Agency / Airborne Monitoring of Sulphur Emissions from ships – 2019 Campaign Results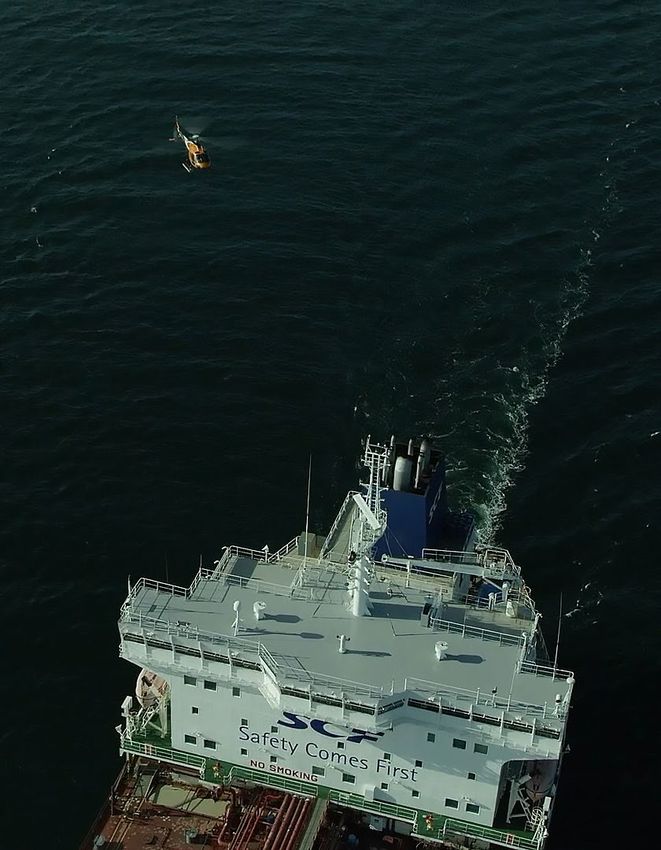
Contents

Summary                                                                                                 5

1.      Operations                                                                                      6
1.1     Measurement methodology and technology                                                          6
1.2     Aircraft platforms                                                                              6
1.3     Operations                                                                                      6
1.4     Other observations                                                                              7

2.      2019 Campaign Results                                                                           9
2.1     Dataset                                                                                         9
2.1.1   Measurement quality                                                                            10
2.2     Observed FSC levels                                                                            11
2.2.1   Distribution of FSC values by cut-off level                                                    12
2.2.2   Distribution of FSC values by vessel type                                                      13
2.2.3   Distribution of FSC values by geographical location                                            14
2.3     Other observations                                                                             14

                 The Danish Environmental Protection Agency / Airborne Monitoring of Sulphur Emissions from ships – 2018 Campaign Results 3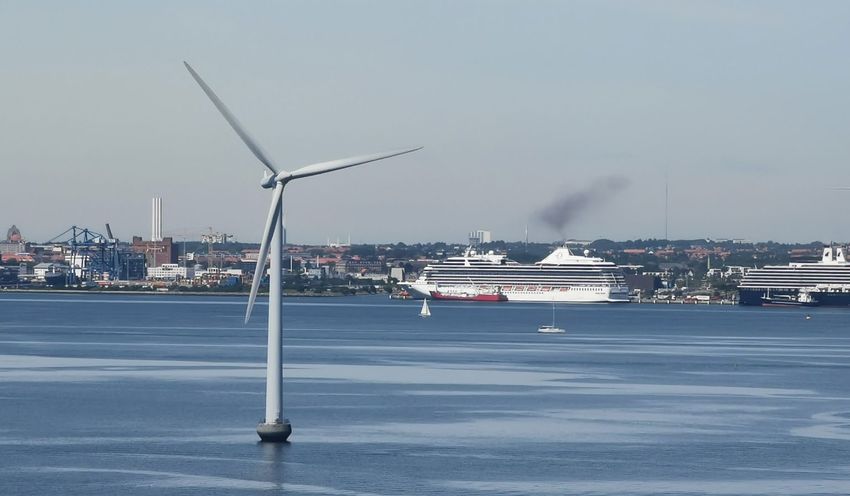
Acronyms / Definitions

        2017 Campaign           DEPA 2017 Airborne Sulphur Monitoring Campaign

        2018 Campaign           DEPA 2018 Airborne Sulphur Monitoring Campaign

        2019 Campaign           DEPA 2019 Airborne Sulphur Monitoring Campaign

        AIS                     Automatic Identification System

        ANNEX VI                MARPOL Annex VI for the Prevention of Air Pollution from Ships

        DEPA                    Danish Environmental Protection Agency

        EMSS                    Explicit Mini Sniffer System

        FSC                     Fuel Sulphur Content

        MARPOL                  International Convention for the Prevention of Pollution from Ships

        RSD                     Relative Standard Deviation

        SECA                    Sulphur Emission Control Area

4 The Danish Environmental Protection Agency / Airborne Monitoring of Sulphur Emissions from ships – 2019 Campaign Results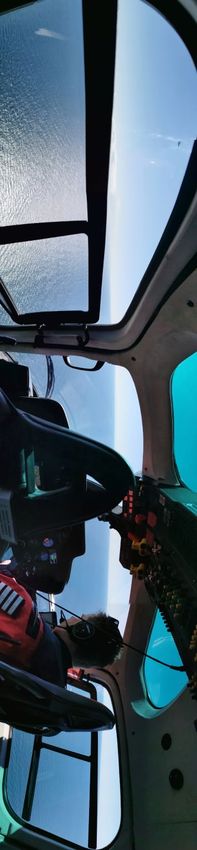
Summary

This report presents the results of the airborne activities to monitor ship sulphur emissions in
Danish waters conducted during 2019 by Explicit ApS on behalf by the Danish Environmental
Protection Agency (DEPA). The activity is part of the Danish Government’s programme to en-
force the sulphur rules under MARPOL Annex VI.

This year’s activities focused on the deployment of the manned helicopters for broader surveil-
lance of maritime emissions using the Explicit Mini Sniffer System.

The main findings of the 2019 report can be summarized as follows:

    •    Of the 615 ships measured during the period March-December 2019, 22 ships (3.6%)
         were found to have substantially elevated fuel sulphur content levels at or above 0.15
         %, the limit at which the instrumentation with 95 % confidence can detect a breach of
         the 0.10 % SECA threshold.
    •    This finding – corresponding to approx. 1:29 ships recorded as non-compliant –
         represents a significant decrease from the level in 2018 (7.3 %) and 2017 (5.4 %).
    •    In particular, no vessels were found with values above 0.64 % FSC which is the first
         year, since airborne surveillance was introduced in Danish waters, where no observa-
         tions reached 1.0 % FSC.
    •    Also notable this year was the significant increase in observations below the 0.10 %
         SECA threshold. More than 70 % of all observations where recorded in the lowest
         part of the FSC spectrum, a significant shift from previous years and a sign of an
         overall improvement in the maritime sulphur emissions in Danish waters.
    •    The introduction of scrubbers on ocean-going vessels also appears to be having a
         positive effect on sulphur emissions with a new ‘peak’ in observations recorded at the
         very lowest end of the FSC spectrum around 0.01 % FSC. While presumably moti-
         vated primarily by the upcoming 2020 global sulphur cap, the introducing of scrubbers
         thus appears to be having a derived positive effect inside the SECA as well.
    •    More clearly than in other years, non-compliance was found to be concentrated North
         of the Great Belt and Øresund bridges in Kattegat and Skagerrak but with no appar-
         ent directional patterns. Similar levels of compliance were found for both inbound and
         outbound ships as well as ships operating locally.

It is the general observation of the surveillance team that ships operating in Danish waters
appear to be increasingly accustomed to airborne sulphur checks, with no negative feedback
received in dialogue with the ships, cementing the preventive impact of the airborne effort.

                    The Danish Environmental Protection Agency / Airborne Monitoring of Sulphur Emissions from ships – 2018 Campaign Results 5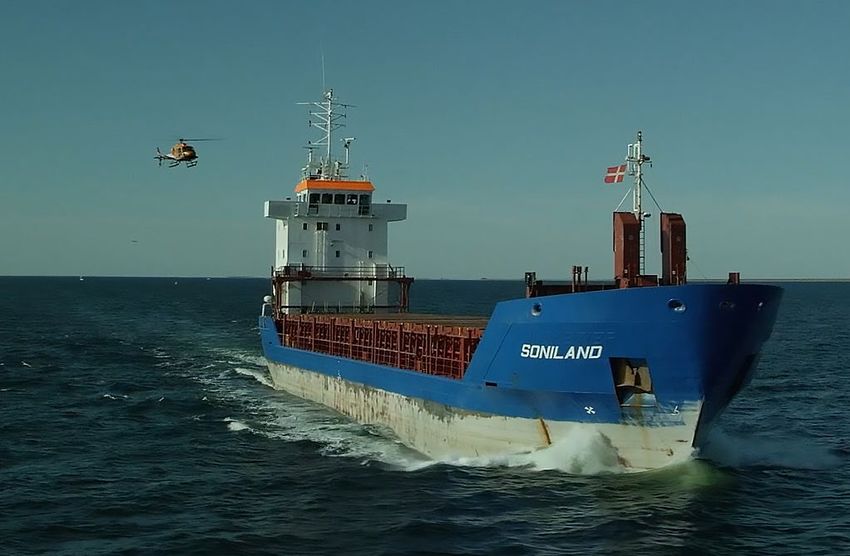
1. Operations

        As in previous years, in 2019 airborne monitoring of sulphur
        emissions was conducted throughout Danish waters using a
        combination of innovative micro sensor technology and manned
        helicopter operations.

        All sulphur deployments in 2019 where conducted by Explicit ApS in collaboration with Charlie
        9 Helicopters ApS as part of the Danish Government’s programme to enforce the sulphur rules
        under MARPOL Annex VI.

        1.1         Measurement methodology and technology

        No changes were made to the sensor technology or analysis methodology compared to the
        setup used in 2017 and 2018. Reference is made to the 2017 Campaign report for details on
        the measurement methodology, instrument and operational setup.

        1.2         Aircraft platforms

        All operations in 2019 were carried out using an Airbus AS355NP twin-engine helicopter (see
        Images A-C). No other aircraft platforms were used.

        As in previous years, the helicopter was equipped with the Explicit Mini Sniffer System in a
        dual configuration, i.e. with two parallel sensor instruments operated in tandem. For more on
        the application of multiple parallel sampling, please see the 2017 Campaign report.

        1.3         Operations
        The distribution of measurements over the full campaign period as well as by hour on the day,
        is presented in Figure 2 and 3 respectively.

        The large number of vessels measured in October was primarily due to a longer back-to-back
        surveillance operation focusing on the waters of the North Sea, Skagerrak and Kattegat. Con-
        versely, no flights were performed in November due to an extended period of bad weather.

6 The Danish Environmental Protection Agency / Airborne Monitoring of Sulphur Emissions from ships – 2019 Campaign Results
Number of ship observations
Month of the year
FIGURE 2. Distribution of measurements by campaign month. Note, the colours indicate FSC
levels. For further see 2.2.
Number of ship observations
Hour of the day (CET)
FIGURE 3. Distribution of measurements by hour interval. Note, the colours indicate FSC
levels. For further see 2.2.
1.4 Other observations
All operations were carried out in according with DEPA instructions. No technical issues were
experienced during missions.
Overall, it is the assessment of the operations team that ships in Danish waters are increas-
ingly accustomed to regular airborne sulphur emissions checks. No observations of hostile or
evasive actions were made in 2019 and few ships used the opportunity to communicate with
the pilot team via maritime radio to clarify the intent of the aircraft on approach.
The Danish Environmental Protection Agency / Airborne Monitoring of Sulphur Emissions from ships – 2018 Campaign Results 7615
ship observations were
collected and analyzed for sulphu
8 The Danish Environmental Protection Agency / Airborne Monitoring of Sulphur Emissions from ships – 2019 Campaign Results2. 2019 Campaign Results
2019 saw a notable shift in the sulphur compliance data with less
ships recorded with highly elevated FSC values compared to pre-
vious years. At the same time, the introduction of scrubbers on
ocean-going vessels appears to be having a positive impact on
the overall maritime sulphur emissions.
2.1 Dataset
The full dataset for the 2019 Campaign consists of 615 independent ship observations. Due to
their frequent operation in Danish waters, some vessels were measured multiple times during
the year, however at a maximum on four occasions.
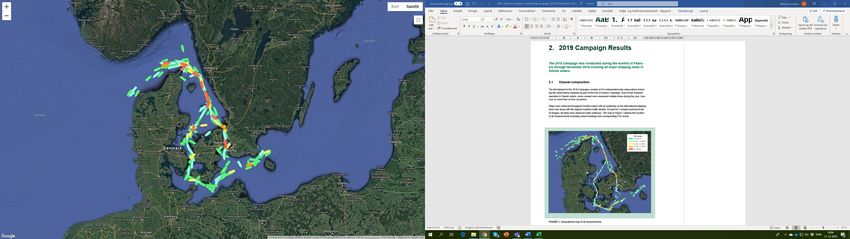
Ships were observed throughout Danish waters with an emphasis on the international shipping
lanes and areas with the highest maritime traffic density. Except for 7 anchored vessels, all
ships were observed while underway. The map in Figure 1 depicts the location of all measure-
ments including vessel headings and corresponding FSC levels.
FSC levels:
≤ 0.100 %
0.101 – 0.129 %
0.130 – 0.149 %
0.150 – 0.179 %
≥ 0.180 %
FIGURE 1. Geographical map of all measurements.
The Danish Environmental Protection Agency / Airborne Monitoring of Sulphur Emissions from ships – 2018 Campaign Results 9All ships were identified based on their AIS signals collected directly from the vessels during
flight. No third-party sources have been used to establish ship ID. A breakdown of the dataset
according to primary vessel type, based on the AIS data, is presented in Table 1.
TABLE 1. Distribution of measurements by vessel type
Type Cargo Tanker Passenger Other Not available Total
Measurements 354 212 27 18 4 615
% of total 57.6 % 34.5 % 4.4 % 2.9 % 0.7 % 100 %
2.1.1 Measurement quality
Overall, the campaign was able to demonstrate – as has been the case all along – a consist-
ently high-quality level. Of the 615 ship observations, 576 measurements (94 %) were classi-
fied as high quality (≥ 6.00 in quality score) according to the systemic quality scoring protocol,
meaning the operational team was able to successfully optimize the sampling position in the
plume to satisfy all sensor requirements.
Unlike the uncertainty, which assigns an error margin to a given FSC output (the lower the
FSC, the higher the uncertainty), the quality score allows users to evaluate the position in the
plume, i.e. the pilot’s ability to successfully capture the exhaust gasses. The higher the quality
score, the better the sampling position was in the plume.
10 The Danish Environmental Protection Agency / Airborne Monitoring of Sulphur Emissions from ships – 2019 Campaign ResultsA breakdown of the quality scores is presented in Table 2. The methodology for the quality
scoring protocol is described in detail in the 2017 Campaign report.
TABLE 2. Distribution by quality scores
Quality score Low (0-3) Medium (3-6) High (>6) Total
Measurements 17 22 576 615
% of total 2.8 % 3.6 % 93.7 % 100 %
2.2 Observed FSC levels
The measurement distribution by FSC level is presented in Figure 4. When analysing the dis-
tribution of the measurements on different FSC levels, the 2019 data corresponds to the pat-
tern observed in previous years with an approximate normal distribution peaking in and around
the 0.10 % regulatory threshold applicable within the SECA.
However, a few notable differences appear in this year’s dataset, most importantly the absen-
ce of any observations above >0.64 % FSC. The lack of gross non-compliance is consistent
with other remote monitoring findings reported by other campaigns and PSC authorities in
2019 and thus not specific to this dataset.
Another notable difference is the significant shift in observations at or below the SECA 0.10 %
FSC threshold. Over the past 3 years, the number of observations in this range (= green ships
on the map) has increased from 48.5 % of the total dataset (2017) to 71.5% this year. Since
there has been no changes in the sensor system or monitoring pattern, this shift can only be
explained by a general improvement in sulphur emissions from ships in Danish waters, a con-
clusion which is further supported by the lowering in ambient sulphur levels in the atmosphere
in and around Denmark reported by DEPA.
1 x RSD
2 x RSD
3 x RSD
SECA threshold: 0.10 %
Number of ship observations
Fuel Sulphur Content (%)
FIGURE 4. Distribution of measurements by measured FSC. Note: The colours indicate differ-
ence in vessel sizes according to their length1. The dotted lines indicate the various compli-
ance cut-off levels for 1xRSD, 2xRSD and 3xRSD respectively.
1
XS = 366m.
The Danish Environmental Protection Agency / Airborne Monitoring of Sulphur Emissions from ships – 2018 Campaign Results 11The data also reveals a significant increase in observations at the lowest end of the spectrum
where a new “peak” around 0.01 % FSC has emerged consistent with the increased use of
scrubbers, particularly on ocean-going vessels preparing for the upcoming 2020 global sulphur
cap of 0.5 % FSC. This finding is supported by visual observations by the flight team who re-
port an increase occurrence of ‘white plumes’. Unlike “normal” exhaust plumes, exhaust gas-
ses that have passed through a scrubber contain high amounts of water vapour which colour
the otherwise invisible emissions white. (An example of this phenomenon can be seen in the
cover image of this report.) The increased use of scrubbers, while presumably motived primar-
ily by the global sulphur cap and not the SECA itself, thus appears to be having a derived posi-
tive impact inside the SECA as well.
Whether the disappearance of the gross non-compliant cases is also linked to the increased
use of scrubbers is harder to conclude. In some cases, scrubbers are undoubtedly helping
ships otherwise struggling with long-lasting residual effects of fuel changeovers to more effec-
tively clean up their emissions. In other cases, the risk of detection may also play a role in
compliance behaviour. Denmark has deployed airborne surveillance of maritime emissions
since January 2015, when the 0.10 % SECA cap was introduced, and so ships operating here
are increasingly aware of the regular airborne ‘sulphur checks’ increasing the preventive effect
of these checks.
This year’s overall distribution profile shows a median FSC value of 0.083 % with a peak value
at 0.100 % FSC. This result is in line with the previous reported levels and goes to confirm that
the data shows no immediate bias vis-a-vis known bunkering patterns.
A breakdown of the distribution is presented below. Where relevant, the data is compared to
the results of the 2017 and/or 2018 Campaigns.
2.2.1 Distribution of FSC values by cut-off level
As shown in Figure 4, the threshold at which a measurement can be deemed to breach the
regulator compliance threshold of 0.10 % FSC, depends on the RSD uncertainty applied to the
measurement. The higher the RSD applied, the stronger the probability that the measurement
is in fact above the SECA threshold. In Table 3, all measurements are grouped according to
their RSD level.
TABLE 3. FSC distribution by level of uncertainty
FSC RSD Colour Measurements % of total
≤ 0.100 % N/A 440 71.5 %
0.101 – 0.129 % N/A 127 20.7 %
0.130 – 0.149 % 1 x RSD 26 4.2 %
0.150 – 0.179 % 2 x RSD 9 1.5 %
≥ 0.180 % 3 x RSD 13 2.1 %
Total 615 100 %
At the 95% coefficient level (2xRSD) – the recommended level used when interpreting fuel
analysis results according to ISO 4259 – the number of vessels measured with elevated FSCs
indicating non-compliant fuel was 22 or 3.6 % of the total. This is a significant decrease from
12 The Danish Environmental Protection Agency / Airborne Monitoring of Sulphur Emissions from ships – 2019 Campaign ResultsVisibility of ship exhaust plumes
While exhaust plumes under normal cruising operations are not visible typically – not even if they contain high levels of sulphur – sometimes certain procedures such as
engine startup, maneuvering, etc. can cause residuals from the combustion process to be released to the air creating a clearly visible smoke trail. This is however not neces-
sarily an indication of sulphur non-compliance, but is most often caused by particulate matter or other exhaust substances.
last year where 7.3 % of all observations where found to be ≥ 0.15 % FSC, but less of a differ-
ence from 2017 where 5.4 % of vessels were found to be ≥ 0.15 % FSC. For ship observations
≥ 0.18 % FSC, the share has fluctuated over the past three years from 2.7 % (2017) to 3.9 %
(2018) to 2.1 % recorded in 2019. The exact cause of the year-of-year change is unknown and
may likely be due to annual fluctuations.
2.2.2 Distribution of FSC values by vessel type
In table 4, the FSC distribution is broken down by vessel type focusing only on cargo and
tanker ships. These represent more than 90 % of the total dataset while the number of pas-
senger and other types have been omitted due to their low number of measurements.
TABLE 4. FSC distribution by vessel type and level of uncertainty
FSC RSD Colour Cargo Tanker
No. % of total No. % of total
≤ 0.100 % N/A 244 69.9 159 75.0
0.101 – 0.129 % N/A 79 22.3 38 17.9
0.130 – 0.149 % 1 x RSD 17 4.8 8 3.8
0.150 – 0.179 % 2 x RSD 6 1.7 3 1.4
≥ 0.180 % 3 x RSD 8 2.3 4 1.9
Total 354 100 212 100
The Danish Environmental Protection Agency / Airborne Monitoring of Sulphur Emissions from ships – 2018 Campaign Results 13While tankers in the past two years have shown a slightly higher occurrence of non-compli-
ance than cargo ships, this picture has changed in 2019. This year, only 3.3 % of tanker ob-
servations where found to be non-compliant (≥0.15 % FSC) compared to 4 % of cargo ships.
This is a significant change from 2018 when 9.2 % of all tankers where found to display non-
compliance.
Whether the shift is due to a permanent change in the emissions patterns, or simply caused by
annual fluctuations, is too early to tell without more data track record. Continued surveillance
will help determine the endurance of some of these changes.
A year-on-year comparison of the FSC values ≥ 0.15 % is shown in Figure 5.
10%
% of observations
8%
6%
4%
2%
0%
2017 2018 2019 2017 2018 2019 2017 2018 2019
All Cargo Tankers
0.15 - 0.179 % FSC ≥ 0.180 % FSC
FIGURE 5. Observations with FSC values at or above 0.15 % FSC as a percentage share of
the total number of measurements in a group (all, cargo or tankers).
2.2.3 Distribution of FSC values by geographical location
In a change from previous years, in 2019 all cases of non-compliance except for one observa-
tion were found North of the Great Belt and Øresund bridges, as illustrated on the map in Fig-
ure 1. This year, the tendency towards more non-compliance in Kattegat and Skagerrak is
thus clearer.
While the Northern waters this year showed a higher risk of non-compliance, no clear direc-
tional patterns were observed. Non-compliance is found just as frequently with vessels head-
ing outbound towards the North Sea as inbound from the North Sea or with vessels operating
within the surveyed area.
2.3 Other observations
Like last year the 2019 Campaign also collected indicative data on vessel NOX emissions.
While NOx emissions are not a subject to this report, the data has been provided to DEPA for
possible further analysis. The full dataset has further been polluted with built-year in order to
enable a future NOx analysis according to tier-levels.
No other observations have been made regarding the dataset. For details on the operations,
please see chapter 1.
14 The Danish Environmental Protection Agency / Airborne Monitoring of Sulphur Emissions from ships – 2019 Campaign ResultsAirborne Monitoring of Sulphur Emissions from Ships in Danish Waters - 2019 Campaign Results This report has been written by the Danish Environmental Protection Agencys (DEPA) hired player Explicit. Explicit is hired by DEPA to survey ships exhaustings plumes from ships for Sulphur by sniffing (reading) the content of Sulphur in these gasses. It has been done to detect if ships are in compliances with the Danish legis- lations of Sulphur content in ships fuels. Readings from the content of Sulphur in the plumes can indicate if there are breaches in the legislations concerning the maximum Sulphur content in ships fuels. The work described in the report is a part of DEPA’s inspection task on this field. This report present the results for the campaign for the year of 2019 and how the sur- vey has been carried out. The survey contains of 615 measured ships from the period of March to December. Denne rapport er skrevet af Miljøstyrelsens hyret aktør Explicit. Explicit er hyret af Miljøstyrelsen til at overvåge skibes udstødningsgasser for svovl ved måling. Det fo- retages for at detektere om skibe overholder de danske regler mht. svovlindhold i skibsbrændstoffer. Svovlindholdsmålingerne fra røgfanerne kan indikere om der sker overtrædelser af lovgivningen mht. svovlindholdet i skibsbrændstoffer. Arbejdet der er beskrevet i rapporten er en del af Miljøstyrelsens tilsynsopgave inden for området. Rapporten præsenterer resultater for 2019 kampagnen hvor overvågningen er foreta- get. Overvågningen indeholder 615 målte skibe for perioden marts til december. Annual report presented by Explicit ApS in relation to EU tender no. 2017/S-069-130508. Contact to Explicit: Bettina Knudsen, COO / CMO bkn@explicit.dk Phone: +45 28 14 59 33 The Danish Environmental Protection Agency Tolderlundsvej 5 5000 Odense C www.mst.dk
You can also read