Data Report - Report No. 2008-03 Historical datasets of dugong (Dugong dugon) observations in the Kimberley region of Western Australia.
←
→
Page content transcription
If your browser does not render page correctly, please read the page content below

Data Report – Report No. 2008-03

        Historical datasets of dugong (Dugong dugon)
       observations in the Kimberley region of Western
                           Australia.

                     David K. Holley1 and R.I.T Prince2
1
    Centre for Marine Ecosystems Research, Edith Cowan University.
2
 Wildlife Research Centre, WA Department of Environment and
Conservation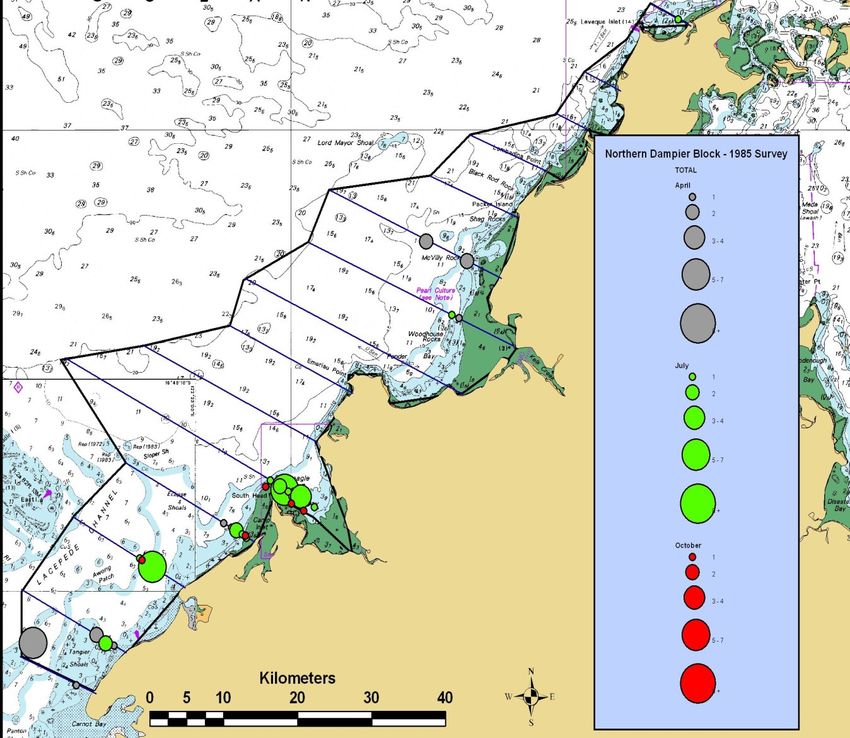
INTRODUCTION ................................................................................................. 2
     Background ....................................................................................................... 2
     Research Need and Objective ............................................................................ 3
   METHODOLOGY ................................................................................................ 4
     1984 Assessment Surveys and 1985 Strip Transect Series.................................. 6
     1996 -2007 Incidental Observation Records ....................................................... 7
   RESULTS ............................................................................................................. 8
     1984 Assessment Surveys .................................................................................. 8
     1985 Strip Transect Series ................................................................................. 8
     1996 -2007 Incidental Observation Records ......................................................14
   CONCLUSION AND RECOMMENDATIONS ...................................................22
   REFERENCES .....................................................................................................23

Table 1:Summary table adapted from Prince (1986) of dugong observations from a pilot
study throughout the West Kimberley in 1984. .......................................................... 8
Table 2: Summary table of numbers and densities of observed dugongs within each
west Kimberley survey block by survey month. ......................................................... 9

Figure 1: Dugong management units for Western Australia incorporating the study
areas (units 4 and 5) for which historical dugong data have been collated. ................. 5
Figure 2: Total observed dugongs by survey month within 80 Mile Block south of
Broome. .................................................................................................................. 10
Figure 3: Total observed dugongs by survey month within Southern Dampier Block
north of Broome. ..................................................................................................... 11
Figure 4: Total observed dugongs by survey month within Northern Dampier Block
north of Broome. ..................................................................................................... 12
Figure 5: Total observed dugongs by survey month within Lacepede Islands Block
north of Broome. ..................................................................................................... 13
Figure 6a-6l: Coastwatch observations for the year 1996. ........................................ 14
Figure 7a-7l: Pooled 1997-2007Coastwatch observations for the month of January. 18

                                                              1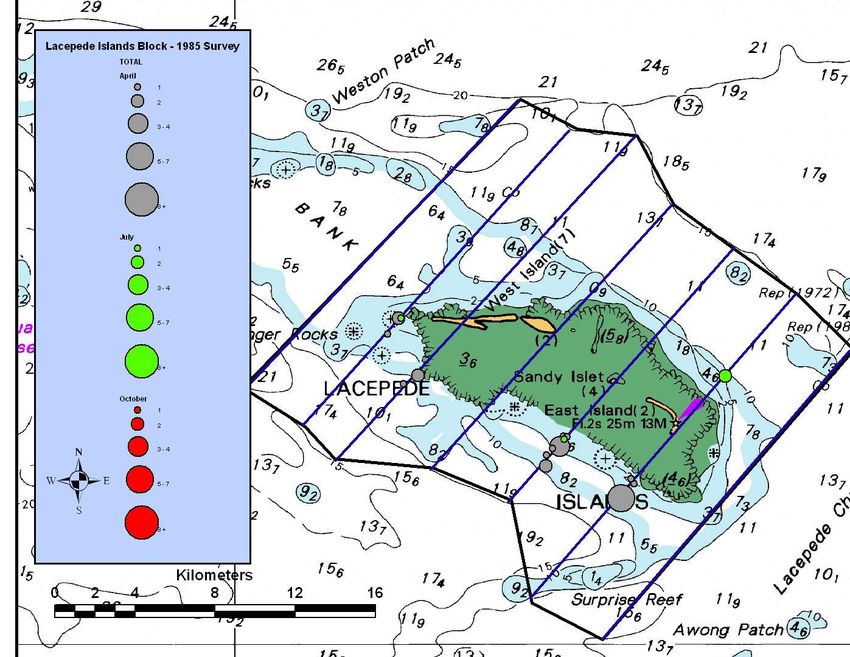
INTRODUCTION

Background

The dugong (Dugong dugon), a large marine vertebrate herbivore, occurs throughout
Western Australian waters from Shark Bay through the Kimberley and into the
Northern Territory. This species is regarded both as an important Keystone species
from an ecological perspective (Marsh et al. 1999) and an important cultural species for
many Indigenous communities. Given the extensive coastline of WA and the
historically limited threatening activity that dugongs have traditionally been exposed to,
WA represents an important location for the species’ conservation, on both national and
international levels. The recent development of a Management Plan for dugongs at a
state level (DEC 2007) is the latest of templates (e.g. Marsh et al. 1999, 2002) for the
synthesis of existing research and datasets as well as a pro-forma for the identification
of future research needs. These documents highlight the importance of WA as a whole
for dugong conservation, but also illustrate the need to understand the distribution and
abundance of populations throughout the State as well as their level of
interconnectedness.

Population abundance estimates of dugongs which have been determined to date in WA
have been calculated from aerial surveys in Shark Bay, Exmouth Gulf and Ningaloo
Reef (Marsh et al., 1994; Preen et al., 1997; Gales et al., 2004; Holley et al., 2006;
Hodgson 2007). The only additional survey to have been conducted outside of these
locations was undertaken in 2000 and covered the Pilbara region from Exmouth Gulf
to the southern limit of the Kimberley region (Prince et al. 2001) (Fig 1.).

Given the importance of the Shark Bay and Exmouth populations, monitoring of these
regions has occurred every five years, since 1989. Five years is considered the
minimum time needed to identify large scale fluctuations (Marsh et al. 1994). Shark
Bay, a World Heritage Listed Area incorporating a Marine Park, is particularly
important for dugong conservation with a recently estimated population of ~ 10,000
dugongs at a density of between 0.65 and 0.95 / Km2 (Hodgson 2007). Shark Bay has
minimum threatening activity and relatively clear water allowing good sighting of
dugongs and, as a result, much of the dugong research and associated funding within
WA has been focussed on this location.

By contrast for the Kimberley region of WA, which is known from Indigenous
knowledge and anecdotal reports as an important location for dugongs within WA
(Prince, 1986; Marsh et al. 2002; DEC 2007), there are no dugong abundance estimates
or distribution data. The remoteness of the region, large tidal variation and water
turbidity make aerial surveys, the standard method for determining population
abundance estimates and distribution patterns, difficult. The strong cultural attachment
of the many Indigenous peoples of the region to the dugong has resulted in deep
cultural knowledge of where dugongs occur at different times of the year. However,
anecdotal information suggests that even traditional knowledge has gaps on dugong
distribution at times when they are not visible and there is an inconsistent picture of
animal density due to fluctuations in numbers of animals seen and hunted from year to
year.

                                            2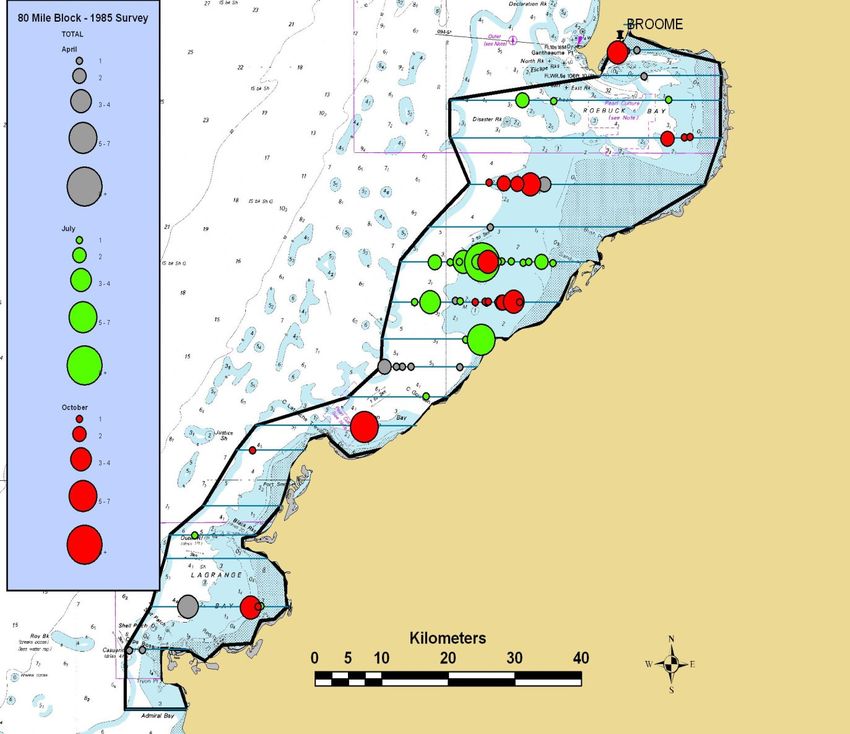
Research Need and Objective

Many sections of the northern WA coastline have become heavily industrialised in the
last three decades particularly throughout the Pilbara region where offshore and
onshore oil and gas exploration and processing facilities are abundant. There have been
recent moves to develop similar industry along the Kimberley coast to access the
Browse Basin, a 140,000 Km2 offshore gas field approximately 300km off the
Kimberley Coast. This has resulted in extensive debate and the need to define the
natural values of this region, which is considered to be one of the world’s most
ecologically diverse (WWF 2008).

Given the remoteness of the Kimberley and the costs involved in undertaking research
programs in this region, desktop studies of unpublished data are a valuable first step in
defining natural values. While unpublished dugong distribution and abundance datasets
may not be standardised or provide the capacity for detailed analysis they can provide
useful historical snapshots with which to focus future research needs.

This data report reproduces hard copy format maps and summary data collected in two
programmes:

1. Estimates of dugong abundance and distribution in the West Kimberley region
   collected during preliminary assessment surveys conducted by Dr RIT Prince in
   1984 and a series of strip transect aerial surveys throughout 1985; and
2. A longitudinal dataset of incidental observations from 1996-2007, covering both the
   west and east Kimberley collected by the Australian Customs Service.

The strip transect surveys and incidental observation datasets have been entered into a
GIS framework with associated metadata. A full description of the methodologies used
in the collection of these datasets as well as the processes involved in incorporating
them into a GIS framework are listed below.

                                            3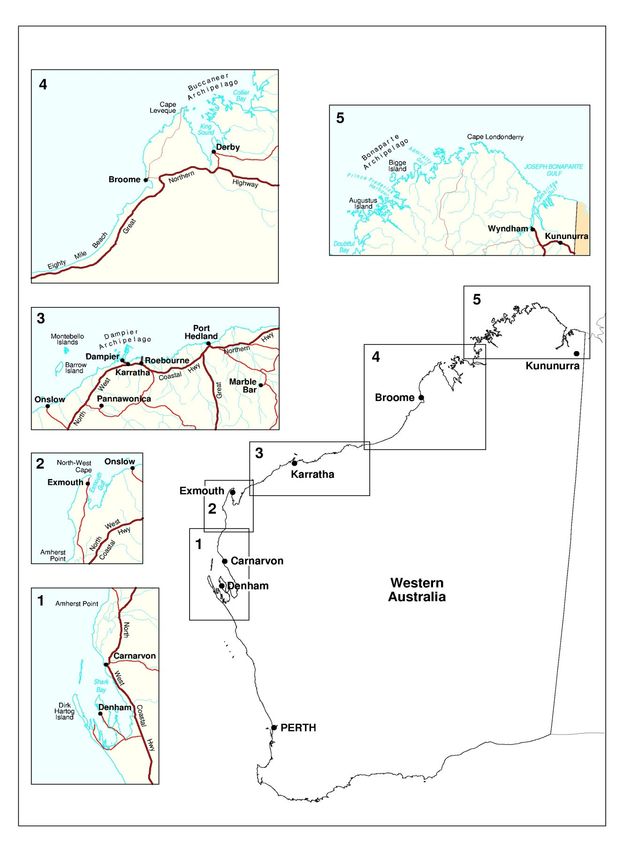
METHODOLOGY

This data report is comprised of two components as defined by each dataset listed
below;

   1) 1984 assessment survey and 1985 Strip Transect Series
   2) 1996-2007 Incidental Observation Records

These surveys represent the only attempts to quantify the Kimberley dugong population
to date and although there are inherent problems in the acquiescence of data, described
below, they represent an important dataset of baseline dugong distribution throughout
the Kimberley.

Region Description – For the purposes of this report the Kimberley region will be
divided into two section corresponding to Management Units 4 and 5 (Fig.1), as
defined in the Dugong Management Program for WA 2007-2016 (DEC 2007).

                                           4
Figure 1: Dugong management units for Western Australia incorporating the study areas (units 4
and 5) for which historical dugong data have been collated.

                                               5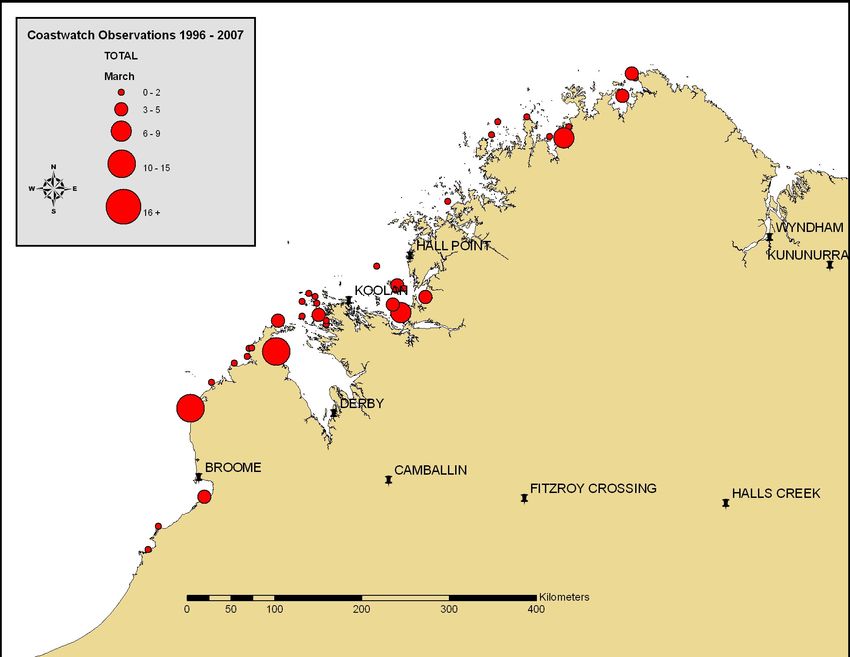
1984 Assessment Surveys and 1985 Strip Transect Series

This series of surveys represents the first attempt to quantitatively assess dugong
distribution and abundance throughout the west Kimberley region. The 1985 survey
was divided into two sections:

   •   The southern section, which extended from LaGrange Bay to Broome (Fig. 2);
       and
   •   The northern section, which commenced just north of Broome and extended to
       Cape Leveque including the Lacepede Islands and into King Sound (Figs. 3-6).

The 1984 surveys were longshore surveys ranging from Exmouth Gulf through to the
WA/NT border and were a pilot program for the development of the 1985 survey
program. Full methodology and results for these surveys are accounted for in Prince
(1986), however a summary of results relevant to this report for the West Kimberley
region are presented in Table 1. No raw data was available for digitisation for these
preliminary surveys.

1985 Strip Transect Series

For all sections two flights were conducted during each of April, July and October
resulting in a total of 12 flights. Each flight within each survey area was replicated,
with transects flown perpendicular to the coast at a height of 275m and speed of 90
knots. Distances between transects varied as did the lengths of transects as flights were
generally made to a point where visibility restricted the sighting potential. Observations
were conducted by a single observer with markers delineating a strip on the water
surface equivalent to 400m wide. Flights were conducted during neap tides to maximise
sighting potential. Aside from dugong observation other megafauna, such as dolphins
and turtles, were also recorded, but for the purposes of this report only dugong sightings
are described.

Survey limitations

Given that the year of the survey preceded the establishment of standardised
methodology (Marsh and Sinclair, 1989) and that flight lines, extent of transects, and
that exact positioning of sightings were estimated during flights, overall accuracy of
data is limited. In addition, for the majority of flights only one observer was present
recording all above listed information as well as observing therefore negating any mark
recapture component. Buckland et al. (2001) advise against this form of sampling for
determining population abundance with any abundance estimate likely to be extremely
negatively biased. Therefore, no effort is made here to provide estimate of population
abundance from the west Kimberley region, the observations recorded represent direct
counts of total number of dugongs seen.

                                            6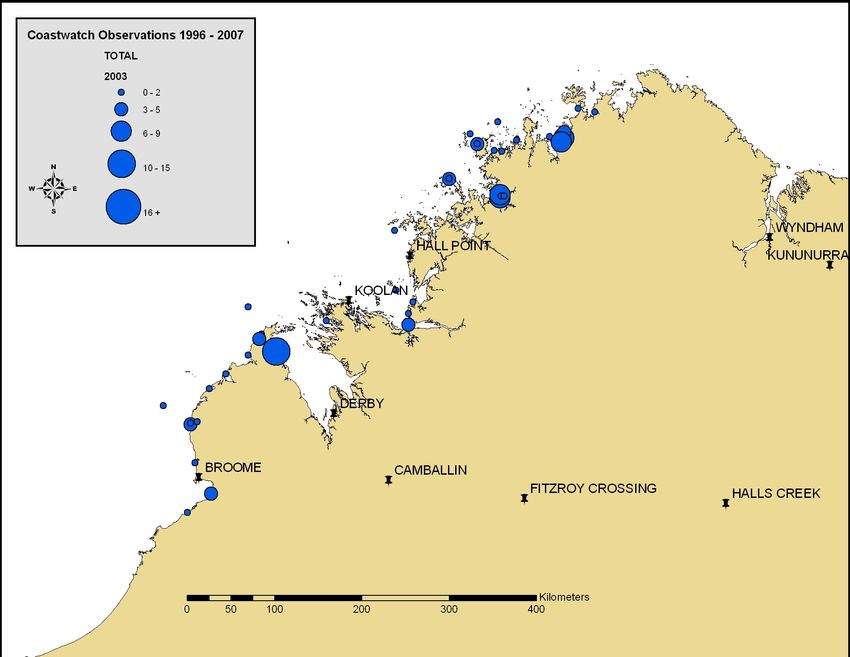
GIS Representation

During conduct of the survey transect lines, times of sightings along each individual
transect and details of observations were recorded on copies of the relevant nautical
charts of the survey area as well as in field notes by the observer. When digitising these
observations the positions as marked on the maps were correlated with the relevant
field notes and the positions were plotted in the GIS package ArcGIS 9 onto a .tiff file
of the relevant chart in the datum WGS 1984. Along with sighting locations, total
numbers of dugongs seen as well as the ratio of adults to calves, transect id, date of
survey and the block location were recorded in the attribute file.

For clarity, survey flights which were conducted north of Broome were separated into
blocks. These blocks as labelled are; Southern Dampier (SD) - from Broome north to
Red Bluff, Northern Dampier (ND) - Red Bluff to Cape Leveque, Lacepede Islands
(LP)– covering all these islands and adjacent reef platforms, and King Sound (KS) –
Easton Point to Carlisle Head incorporating Sunday Island. As no dugongs were
observed in the King Sound block no further analysis was conducted. All transects
south of Broome were included in a single block called 80 Mile Block (80M). Block
areas and transect lengths were defined within a Mercator projection. In order to
determine dugong density within the survey boundaries, transect areas were calculated
based on the perceived height of the aircraft, transect length and survey strip width.

1996 -2007 Incidental Observation Records

This dataset comprises records of dugongs observed during regular Australian Customs
Coastwatch flights throughout northern Australia. Security restrictions prevent the
provisioning of flight details, however Customs has provided the dates latitude and
longitude and number and description of dugongs as seen during these flights. The
dataset was collected between 1996 and 2007 and extends from Shark Bay WA through
to Cairns QLD and into the Torres Strait. For the purposes of this report only
observations between 80 Mile Beach and the Northern Territory border were examined.

Survey Limitations

Given the paucity of information on flight paths, heights, duration and numbers of
observers due to security restrictions, this dataset could only be viewed as direct
observations and no inference being drawn on numbers of dugongs observed by year or
by month given that the survey effort will have differed with each flight undertaken.

GIS Representation

This dataset was provided by Customs in a spreadsheet format, which was subsequently
imported into ArcGis 9 and converted into a shapefile format. Observational data was
then represented by year and by month (Figs. 6a -6l and 7a-7l).

                                            7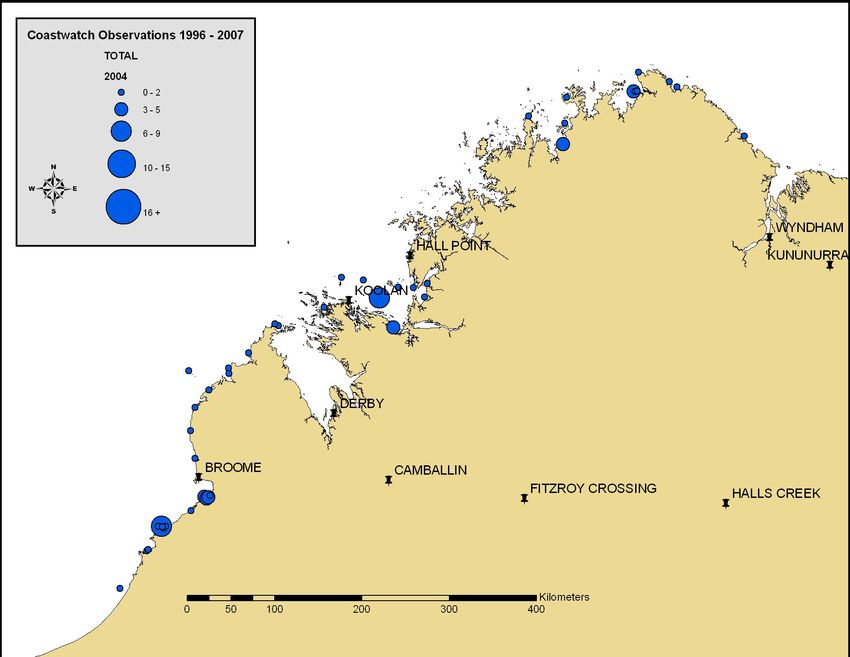
RESULTS
1984 Assessment Surveys

Table 1 lists a summary of observations from these surveys in the regions that were
surveyed in greater detail in 1985.

Table 1:Summary table adapted from Prince (1986) of dugong observations from a pilot study
throughout the West Kimberley in 1984.

REGION                    DATE                    TOTAL DUGONGS            FLIGHT TIME
                                                  SEEN                     (minutes)
Cape Bossut-Broome        July                    11 Adults                65
Broome – Cape             July & August           46 Adults 7 Calves       216
Leveque
Roebuck Bay               August                  29 Adults 2 Calves       97

1985 Strip Transect Series

Listed below is a summary of the flight details and number of dugongs observed over
the entire survey period. Table 2 summarises each flight by block and by month with
calculated densities of each location. Figures 2,3,4 and 5 graphically illustrate the
distribution of dugongs by month and total observed within each block.

Survey Dates -          Admiral Bay – Broome;
                          Survey 1 - 13&20 April
                          Survey 2 - 11&13 July
                          Survey 3 - 07&09 October

                        Broome – Swan Island;
                          Survey 1 - 15&16 April
                          Survey 2 – 12&14 July
                          Survey 3 – 08&10 October

Total transects flown - 66

Total approximate length of transects – 1117.5Km

Total approximate area surveyed – 448.26 Km2

Total number of dugongs observed – 221

Total number of adult dugongs – 187

Total number of calves - 34

                                              8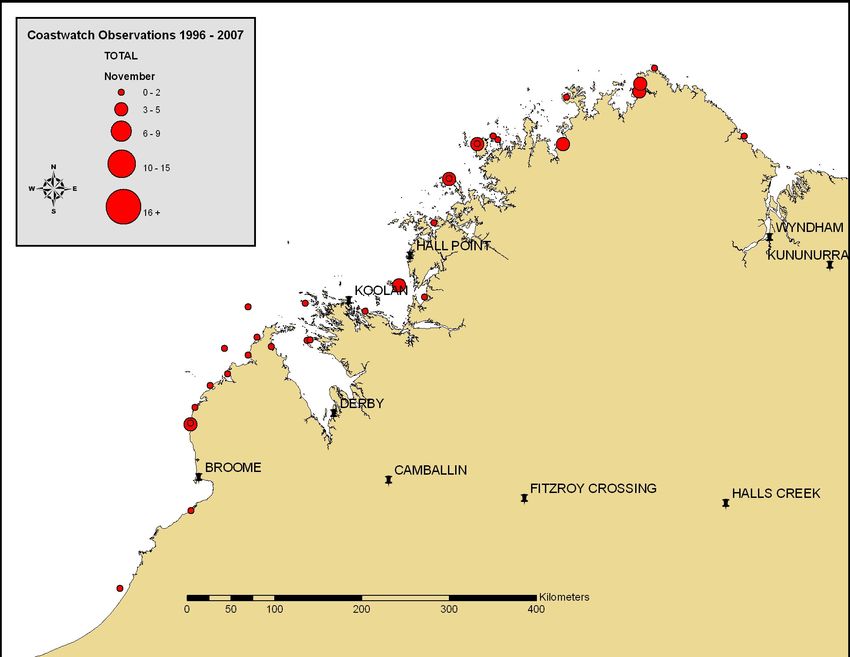
Table 2: Summary table of numbers and densities of observed dugongs within each west
Kimberley survey block by survey month.

Block Survey         Month       Flight    Observed      Total     Density     Overall
      Area                                 Numbers                             Density
      Km2

                     April       (a)       11            18        0.07        0.11
                                 (b)       7                       0.04
80M      157.12      July        (a)       48            56        0.31        0.36
                                 (b)       8                       0.05
                     Oct         (a)       9             45        0.06        0.29
                                 (b)       36                      0.23
                     April       (a)       13            15        0.18        0.21
SD       72.01                   (b)       2                       0.03
                     July        (a)       2             9         0.03        0.12
                                 (b)       7                       0.1
                     Oct         (a)       1             3         0.01        0.04
                                 (b)       2                       0.03
                     April       (a)       5             10        0.04        0.09
                                 (b)       5                       0.04
ND       111.80      July        (a)       13            31        0.12        0.28
                                 (b)       18                      0.16
                     Oct         (a)       5             5         0.04        0.04
                                 (b)       0                       0
LP                   April       (a)       14            25        0.25        0.45
         55.64                   (b)       11                      0.2
                     July        (a)       1             4         0.02        0.07
                                 (b)       3                       0.05
                     Oct         (a)       0             0         0           0
                                 (b)       0                       0

                                                9
Figure 2: Total observed dugongs by survey month within 80 Mile Block south of Broome.
10Figure 3: Total observed dugongs by survey month within Southern Dampier Block north of
Broome.
11Figure 4: Total observed dugongs by survey month within Northern Dampier Block north of
Broome.
12Figure 5: Total observed dugongs by survey month within Lacepede Islands Block north of
Broome.
131996 -2007 Incidental Observation Records
The distribution of dugongs as recorded from Customs Coastwatch Flights is
represented in the following series of maps; Figures 6a through 6l show distribution
from years 1996-1997, while figures 7a through 7l represent monthly pooled
observations over the 1996-2007 period.
Figure 6a: Coastwatch observations for the year 1996.
Figure 6b: Coastwatch observations for the year 1997.
14Figure 6c: Coastwatch observations for the year 1998.
Figure 6d: Coastwatch observations for the year 1999.
Figure 6e: Coastwatch observations for the year 2000.
15Figure 6f: Coastwatch observations for the year 2001.
Figure 6g: Coastwatch observations for the year 2002.
Figure 6h: Coastwatch observations for the year 2003.
16Figure 6i: Coastwatch observations for the year 2004.
Figure 6j: Coastwatch observations for the year 2005.
Figure 6k: Coastwatch observations for the year 2006
17Figure 6l: Coastwatch observations for the year 2007.
Figure 7a: Pooled 1997-2007Coastwatch observations for the month of January.
Figure 7b: Pooled 1997-2007Coastwatch observations for the month of February.
18Figure 7c: Pooled 1997-2007Coastwatch observations for the month of March.
Figure 7d: Pooled 1997-2007Coastwatch observations for the month of April.
Figure 7e: Pooled 1997-2007Coastwatch observations for the month of May.
19Figure 7f: Pooled 1997-2007Coastwatch observations for the month of June.
Figure 7g: Pooled 1997-2007Coastwatch observations for the month of July.
Figure 7h: Pooled 1997-2007Coastwatch observations for the month of August.
20Figure 7i: Pooled 1997-2007Coastwatch observations for the month of September.
Figure 7j: Pooled 1997-2007Coastwatch observations for the month of October.
Figure 7k: Pooled 1997-2007Coastwatch observations for the month of November.
21Figure 7l: Pooled 1997-2007Coastwatch observations for the month of December.
CONCLUSION AND RECOMMENDATIONS
Although limited in providing abundance estimates these datasets provide a valuable
framework for the development of additional aerial surveys and tracking studies to best
determine the spatial and temporal distribution of dugongs throughout the Kimberley.
This region represents the only remaining area within Australia that has a large
population of dugongs with no quantitative estimates available.
The undertaking of aerial surveys for dugongs of the region using methodology
developed by Marsh and Sinclair (1989) and Pollock et al. (2006) as used throughout
Australia including Shark Bay and the Pilbara regions should be seen as a necessary
first step. Conducting these surveys with proven methodologies would, by providing
an abundance estimate and distribution pattern for the region, fulfil a number of
requirements at both a State and National level through the provision of data for;
• assessment of development applications and proposals,
• providing a baseline value for determining sustainable hunting levels,
• the development and undertaking of tracking studies to define movements
habitat structure and usage,
• completing the picture in terms of a national abundance estimate and
distribution guide and;
• provide an estimate of other large marine vertebrate populations.
The conduct of these surveys would be a large undertaking and would possibly require
the concurrent use of at least 2 survey teams to cover not only that area as surveyed
during 1985, but the entire region east to the Northern Territory border (Fig 1). These
surveys would need to be timed to occur during the northern Australian dry season on
neap tides, and seek to include members of the local Indigenous communities as
observers.
22REFERENCES
Buckland, S.T., Anderson, D.R., Burnham, K.P., Laake, J.L., Borchers, D.L., &
Thomas, L. (2005) Introduction to distance sampling: Estimating abundance of
biological populations. Oxford University Press, Oxford, UK.
Department of Environment and Conservation (2007) Dugong (Dugong dugon)
Management Program for Western Australia 2007 – 2016.
Gales, N. J., McCauley, R. D., Lanyon, J. M. & Holley, D. K. (2004). Change in
abundance of dugongs in Shark Bay, Ningaloo and Exmouth Gulf, Western Australia:
evidence for large scale migration. Wildlife Research, 31, 283-290.
Hodgson, A.J. (2007) The distribution, abundance and conservation of dugongs and
other marine megafauna in Shark Bay Marine Park, Ningaloo Marine Park and
Exmouth Gulf. Report to Department of Environment and Conservation.
Holley, D. K., Lawler, I. R. & Gales, N. J. (2006). Summer survey of dugong
distribution and abundance in Shark Bay reveals additional key habitat area. Wildlife
Research, 33, 243-250.
Marsh, H. & Sinclair, D.F. (1989). Correcting for visibility bias in strip transect aerial
surveys of aquatic fauna. Journal of Wildlife Management. 53(4): 1017-1024.
Marsh, H., Prince, R. I. T., Saalfeld, W. K. & Shepherd, R. (1994). The distribution and
abundance of the dugong in Shark Bay, Western Australia. Wildlife Research, 21, 149-
161.
Marsh, H., Eros, C., Corkeron, P., and Breen, B. (1999). A conservation strategy for
dugongs: implications of Australian research. Marine Freshwater Research 50: 979-90.
Marsh, H., Penrose, H., Eros, C., and Hughes, J. (2002). Dugong: Status Report and
Action Plans for Countries and Territories. UNEP: 164pp
Mustoe, S., and Edmunds, M. (2008) Coastal and marine natural values of the
Kimberley. WWF, Sydney, Australia.
Pollock K, Marsh H, Lawler I, and Alldredge M. (2006). Modelling availability and
perception processes for strip and line transects: an application to dugong aerial
surveys. Journal of Wildlife Management 70:255-262.
Preen, A. R., Marsh, H., Lawler, I. R., Prince, R. I. T. & Shepherd, R. (1997).
Distribution and abundance of dugongs, turtles, dolphins and other megafauna in Shark
Bay, Ningaloo Reef and Exmouth Gulf, Western Australia. Wildlife Research, 24, 185-
208.
23Prince, R.I.T. (1986) Dugong in Northern Waters of Western Australia – 1984.
Department of Conservation and Land Management Western Australia Technical
Report No.7. vi +38pp. (Dept. Cons. Land Management : Perth)
Prince, R.I.T., I.R. Lawler and H.D. Marsh. (2001). The distribution and abundance of
dugongs and other megavertebrates in Western Australian coastal waters extending
seaward to the 20m isobath between North West Cape and the DeGrey river mouth,
Western Australia, April 2000. Report for Environment Australia.
24You can also read