Comparison of the shear behavior in graphiteepoxy composites evaluated by means of biaxial test and off-axis tension test
←
→
Page content transcription
If your browser does not render page correctly, please read the page content below
Science and Engineering of Composite Materials 2021; 28: 215–222
Research Article
Juan Carlos Marín and Alberto Barroso*
Comparison of the shear behavior in graphite-
epoxy composites evaluated by means of biaxial
test and off-axis tension test
https://doi.org/10.1515/secm-2021-0022 concentration in the transition between the straight and
received November 10, 2020; accepted January 12, 2021 curved parts of the boundary geometry of the samples,
Abstract: Characterization of shear behavior in composite which explain some premature failures of the samples.
materials remains a not fully solved problem. In the last This premature failure could be avoided with tabs extended
fifty years, many different approaches have been proposed up to the beginning of the central part of the sample.
to solve this problem (rail shear, thin-walled tube torsion, Keywords: composite materials, testing, off axis, cruci-
off-axis tensile, ±45° tensile, Arcan, Iosipescu, asymmetric form samples, mechanical characterization
four-point bend, plate twist, v-notched rail shear, off-axis
flexural, and shear frame), although none of these
approaches have achieved an unquestionable solution.
For this reason, proposals of alternative methods and com- 1 Introduction
parison between different experimental techniques are of
interest. In the present work, the use of cruciform samples The precise mechanical characterization of composite
with the fiber oriented at 45° with respect to the load direc- materials is a basic step for the design of structures
tions, and subjected to tension-compression (creating a made with these materials. In particular, the characteri-
pure shear stress state at the central part of the samples), zation of the shear behavior in composite materials still
is studied. The experimental results of the cruciform sam- remains being a not fully solved problem. In the last fifty
ples have been compared with the off-axis tests (with the years, many different approaches have been proposed to
fiber at 10°) for the same material (AS4/8552), finding a solve this problem (rail shear, thin-walled tube torsion,
good agreement between the shear experimental curves, off-axis tensile ±45° tensile, Arcan, Iosipescu, asym-
especially at the initial part of the curve, where the shear metric four-point bend, plate twist, v-notched rail shear,
modulus is calculated. Nevertheless, the shear strength off-axis flexural, and shear frame), although none of
value obtained by means of the cruciform specimen has these approaches have achieved an unquestionable solu-
shown to be significantly lower than that obtained using tion. For this reason, the proposal of new test methods
the off-axis test. A Finite Element numerical model of the and the comparison of the results with existing available
cruciform specimen has been developed to analyze the procedures are of unquestionable interest.
stress field of the samples. Numerical results have shown The basic idea beyond the shear characterization
that there is a central area of the cruciform specimens where tests is to generate a pure and uniform shear stress state
a pure and uniform shear stress state is developed, which is in the area of the sample where measurements are being
suitable for the evaluation of the shear constitutive law of carried out, in order to directly obtain the shear modulus
the material. It has been observed that there is a (σ22) stress G12 and the shear strength S. It is well-known that a ten-
sion and a perpendicular and equal valued compression
stress state are equivalent to a pure shear stress state at
45°. A way to produce a tension-compression loading
* Corresponding author: Alberto Barroso, Group of Elasticity and state is by using cruciform specimens in biaxial loading
Strength of Materials, School of Engineering, University of Seville, testing machines [1–5]. The idea to use biaxial tests to
Camino de los Descubrimientos s/n, 41092 Seville, Spain,
obtain shear properties appears, for example, in Kennedy
e-mail: abc@us.es
Juan Carlos Marín: Group of Elasticity and Strength of Materials,
et al. [6], but using laminates [90/0]2s and [±45]2s. In the
School of Engineering, University of Seville, Camino de los present work, the use of cruciform specimens, with carbon-
Descubrimientos s/n, 41092 Seville, Spain epoxy unidirectional laminates at 45° with respect to
Open Access. © 2021 Juan Carlos Marín and Alberto Barroso, published by De Gruyter. This work is licensed under the Creative Commons
Attribution 4.0 International License.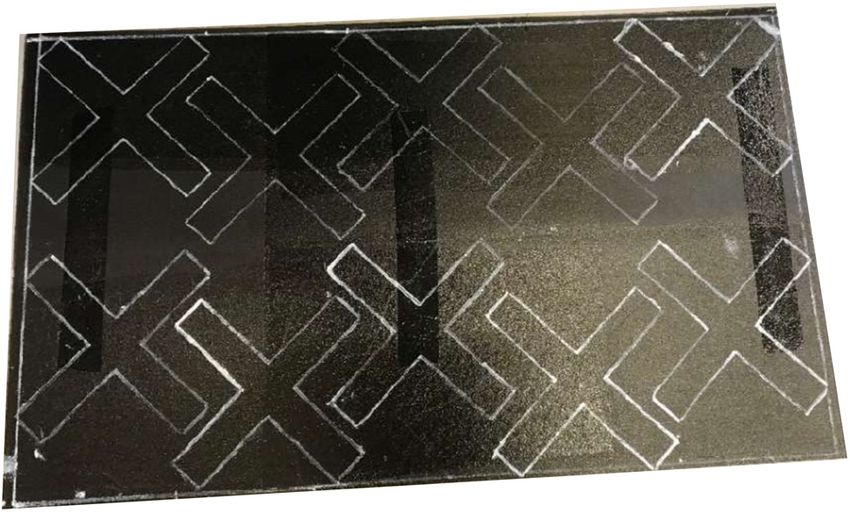
216 Juan Carlos Marín and Alberto Barroso
the loading directions, and subjected to a tension-com-
pression loading state in a biaxial testing machine, is
analyzed.
Experimental results obtained with the cruciform spe-
cimens will be compared (in terms of stiffness and strength
values) with the 10° off-axis tension tests for the same
material [7]. The off-axis test is a widely accepted test
configuration for the shear characterization of composite
materials due to its simplicity, as illustrated by the exten-
sive literature devoted to its study and applications [8–21].
For this reason, the off-axis test has been selected as the
reference configuration to compare with. In particular, the
oblique tabs configuration [18] has been used in the off- Figure 1: Cruciform specimens in the manufactured panel.
axis test, as its efficiency has been demonstrated in pre-
vious works [7,22]. Nevertheless, the off-axis tension test load cells at each loading arm. Longitudinal and trans-
does not produce a pure shear stress state, unlike the versal displacements were measured using an optical
biaxial tension-compression test with cruciform samples. video-extensometer. Figure 4b shows the white lines (hori-
zontal and vertical) in the central part of the samples,
used as a reference for the displacement measurements
with the video-extensometer. Room temperature and rela-
2 Material and test coupons tive humidity during the tests were 22°C and 50%, respec-
preparation tively. All tests have been carried out with control in force,
using a loading rate of 10 N/s.
A graphite-epoxy composite denominated AS4/8552 and Each one of the tests was loaded until complete
manufactured by HEXCEL Composites has been used in failure, with the tension load along the vertical axis
the present work. This material is the same as the one and the compression applied along the horizontal direc-
used in the off-axis tests which will be taken as reference tion. Figure 5 shows, for one of the tested samples
values to compare with [7]. A rectangular panel 500 × (sample #2), (a) the initial stage of the test, and (b) the
300 mm2 has been manufactured using 4 plies of unidir- final stage, with the failure of the specimen. Although a
ectional pre-preg at 0°, giving rise to a final thickness of
the cured panel of 0.85 ± 0.02 mm. The panel has been
cured in an autoclave, using a vacuum bag, at 180°C and
7 bar. From this panel, cruciform specimens were obtained
at 45° as schematically shown in Figure 1.
The test coupons were first cut using a diamond disc
and were finally machined to get the final geometry
(depicted in Figure 2), using a milling drill.
The dimensions were selected in accordance with the
characteristics of the biaxial testing machine used in the
tests. The arm ends of the samples were reinforced with
tabs made of a glass fiber laminate to avoid premature fail-
ures at the machine jaw grips. The tabs were bonded using
an adhesive curing at 180°C (SAFRAN). The final configura-
tion of the cruciform specimens is shown in Figure 3.
3 Experimental tests
Tests were carried out in a biaxial testing machine (Figure 4a),
with mechanical jaw grips (Figure 4b), and with independent Figure 2: Sample’s geometry and dimensions (in mm).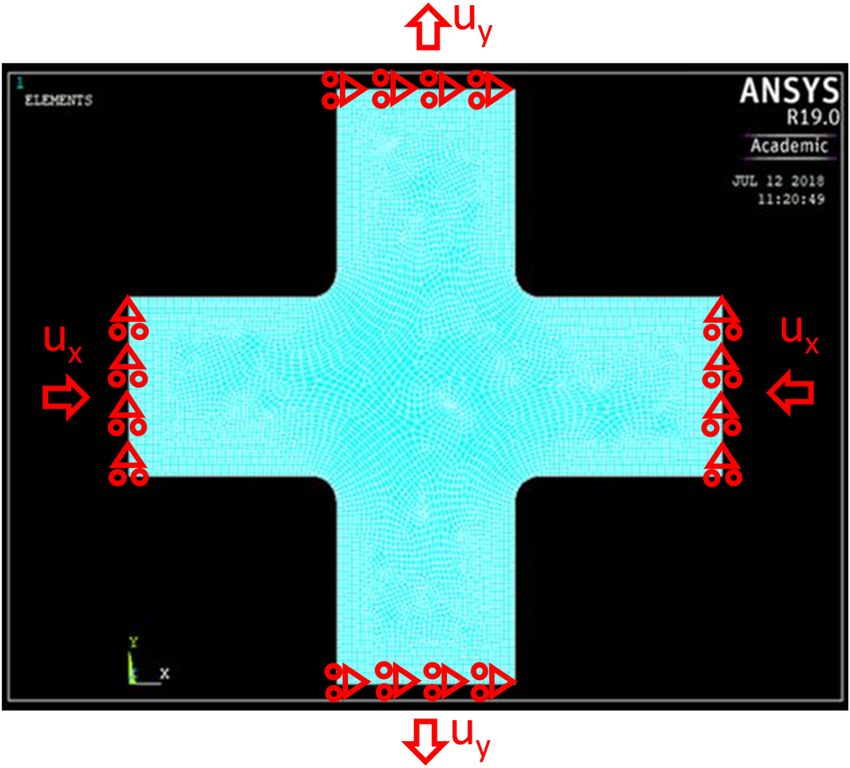
Comparison of the shear behavior in graphite-epoxy composites 217
longitudinal normal stress at each loading arm vs the
absolute value of the longitudinal normal strain asso-
ciated to the compression loading arm. It can be observed
that the values for the tensile loading direction are
approximately equal to those associated to the compres-
sion loading direction, which guarantees the desired pure
shear stress state at the central area of the sample.
From the measured longitudinal normal stresses, the
shear stress σ12 in the orthotropic axis of the material (45°
with respect to the loading arm directions) is directly
obtained. The shear strain in orthotropic axis can be
also easily obtained by simple subtraction of the vertical
(εy) and horizontal (εx) longitudinal normal strains.
γ12 = εy − εx (1)
Figure 7 shows σ12 vs γ12 obtained from the tests of
samples 3, 4, 5, 6, and 7. Results for sample 2 could not be
used, due to a failure with the recording of the video-
Figure 3: Cruciform samples ready to be tested. extensometer device, and sample 1 broke while clamping
it to the machine jaws. An initial linear behavior can be
observed in the plots in Figure 7, which allows the mea-
detailed description of the failures will be given later, in surement of the shear modulus G12 of the material. After
Figure 5b failure initiates at the transition between the this initial linear behavior, the typical nonlineal behavior
straight and the curved part of the sample, where some associated to this materials tested in shear is observed,
stress concentration appears, as it will be discussed later, with higher dispersion than in the linear part of the
in the numerical part of the work. curves. Finally, a more horizontal behavior is developed,
From each one of the tests, loading values for each associated to the final failure process of the samples.
loading arm, as well as the vertical and horizontal elon- Table 1 shows the shear modulus values G12 measured
gations of the white marks at the central area of the using the initial linear part of the curves, together with
sample, were recorded. Figure 6 shows the absolute the average value as well as the standard deviation.
Figure 4: Biaxial testing machine: (a) general view, (b) detail of the gripping system.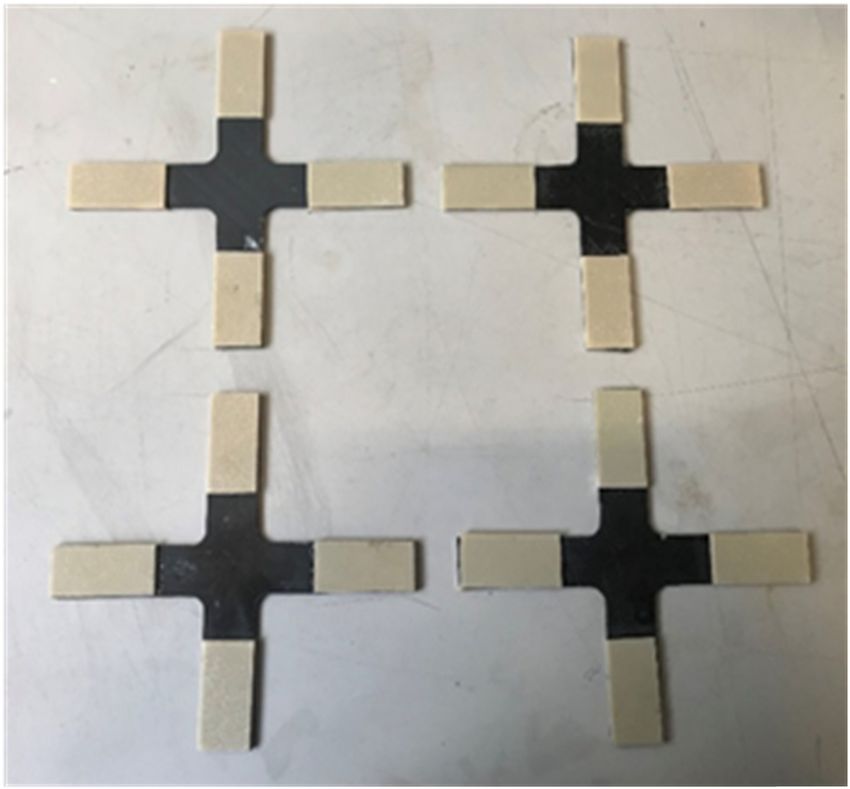
218 Juan Carlos Marín and Alberto Barroso
Figure 5: (a) Initial and (b) final stage of the biaxial test of sample #2.
Shear strength values for each sample are simply
obtained as the value of the shear stress (σ12) at the
instant of failure. Table 2 shows the strength values
(S = σ12_max) for each specimen, together with the average
as well as the standard deviation.
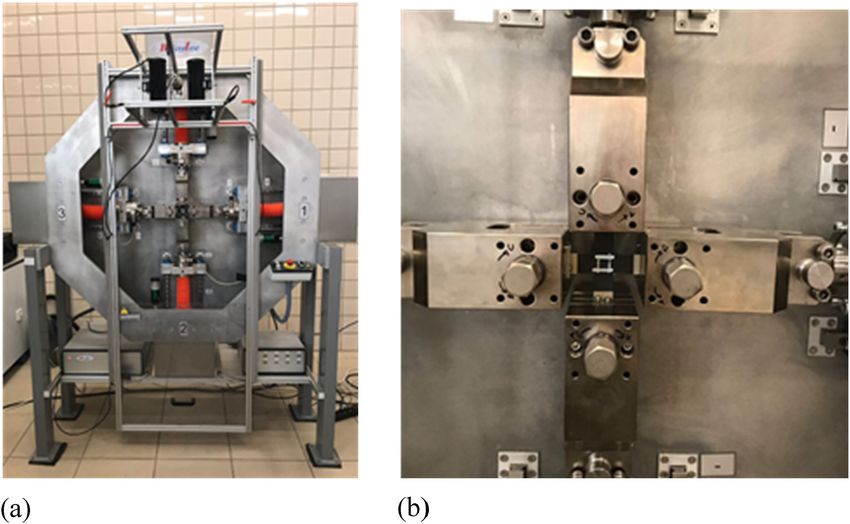
Figure 8 shows the failures of all the tested speci-
mens, all failures having in common the transition point
from the straight loading arms and the curve part of the
specimen and the failure along the central part of the
sample. In particular, samples 3 and 5 exhibited a second
failure, parallel to the initial failure plane, probably
motivated by the dynamic effects of the first failure. No
buckling effects have been observed in the horizontal
(compression) arms.
Samples 3 and 5 (in Figure 8) have the same failure
mode than the rest of samples. In the particular case of
Figure 6: Example of the absolute values of the longitudinal normal
stresses vs absolute value of the horizontal compression strain for a sample 3, there is a simultaneous failure at both stress
particular test. concentration points (top-right and bottom-left) of the
simple. In the case of sample 5, the energy released after
the first failure, combined with the extremely brittle
behavior of the samples, has made part of the sample
to fall completely from the coupon. That is the reason
why part of the sample does not appear in the Figure 8.
4 Results analysis
In order to check the suitability of the biaxial tension-
compression test using cruciform specimens, results for
the shear modulus and shear strength will be compared
with experimental results obtained using the off-axis test
Figure 7: Experimental curves (σ12 vs γ12) for samples 3–6. (10°) with oblique tabs for the same material system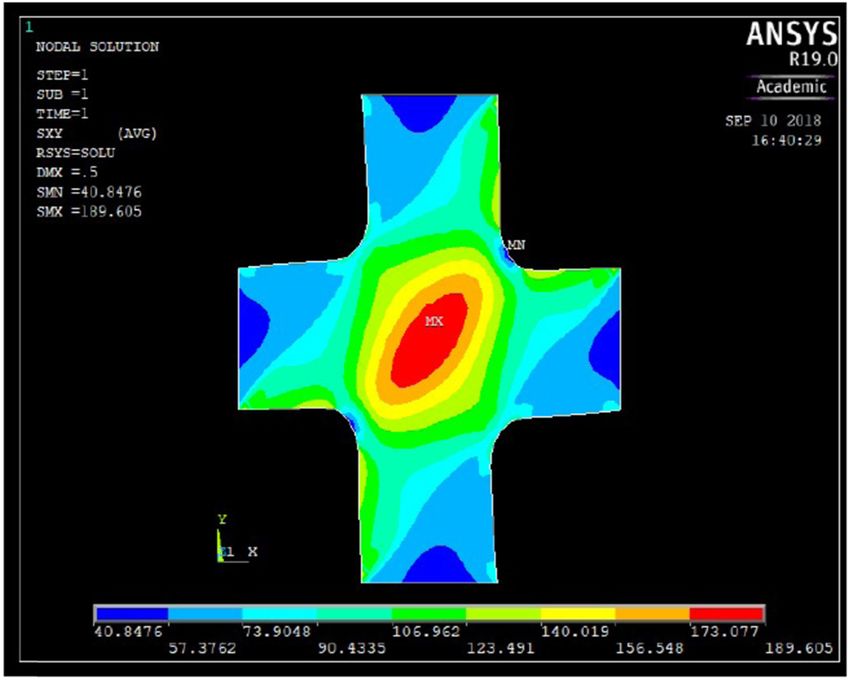
Comparison of the shear behavior in graphite-epoxy composites 219 Table 1: Experimental measured values of the shear modulus G12 Specimen number 3 4 5 6 7 Average value STD G12 (GPa) 5.393 4.747 5.347 4.224 4.512 4.845 0.514 Table 2: Experimental shear strength values for the tested samples Specimen number 2 3 4 5 6 7 Average value STD σ12_max (MPa) 26.756 28.462 25.050 31.554 25.234 27.700 27.459 2.412 (AS4/8552) [7]. Figure 9 shows the experimental curves configuration, fact that the authors associate to the strain σ12 vs γ12 from both the biaxial tests (in blue) and off-axis measurements carried out with the video-extensometer. tests (in red). In the initial part of the curves, both test The shear strength values obtained with the biaxial configurations show a similar linear behavior, with higher test and the cruciform specimens are much lower than dispersion for the biaxial configuration and slightly higher those obtained with the 10° off-axis tension test, as can values of the shear modulus for the biaxial configura- be clearly observed in Figure 10. tion (G12 = 4.845 GPa) compared to the results for the off- The extremely brittle nature of failure in this type of axis 10° configuration (G12 = 4.423 GPa). For higher stress samples makes the test results (a) to have a high sensi- values, the dispersion of the curves increases for both test tivity to local stress concentrations appearing in the configurations, being more apparent for the biaxial test sample geometry, and in consequence, (b) to have a Figure 8: Failures of the biaxial test samples.
220 Juan Carlos Marín and Alberto Barroso
Figure 9: Comparison of the shear tests curves, for the evaluation of
the shear modulus (G12) using the biaxial test with cruciform spe-
cimens and the off-axis 10° test.
Figure 11: Finite element mesh of the model.
machine (Figure 11). Mechanical properties of the mate-
rial were taken from reference [7]: E11 = 125.159 GPa, E22 =
8.112 GPa, G12 = 4.423 GPa, ν12 = 0.3.
Figures 12–14 show the contour plots of the (σ12, σ11,
and σ22) stress components, respectively. In Figure 12, a
reasonable uniform shear stress state is observed at the
central part of the specimen, and the measurements
therein can be, then, reasonably well-related to the shear
Figure 10: Comparison of the shear tests curves, for the evaluation behavior of the material, in terms of stiffness.
of the shear strength (σ12_max) for both test configurations.
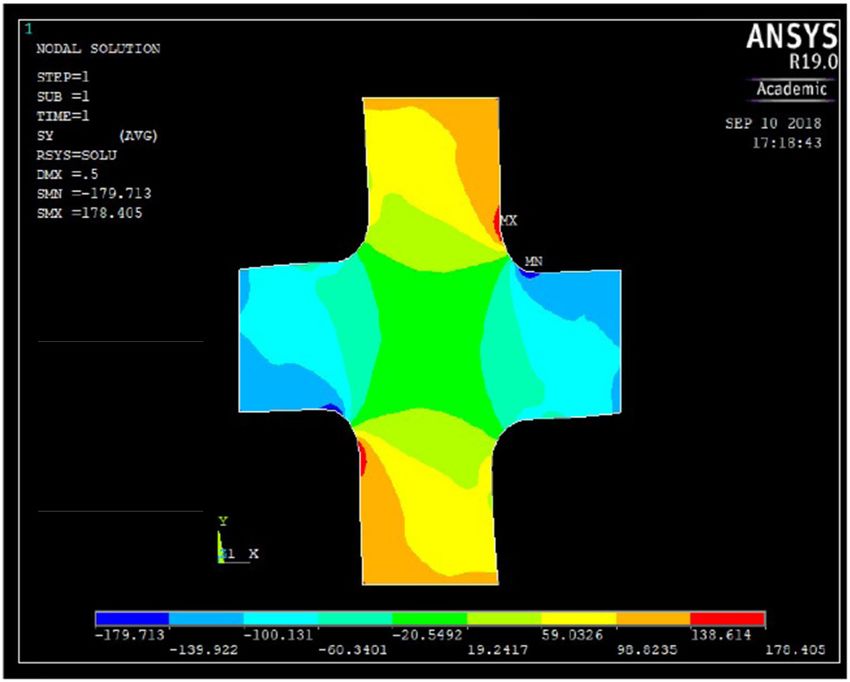
In terms of the shear strength behavior, Figure 14
shows σ22 concentrations at the transition area between
higher dispersion in the strength results (as shown the straight and the curved part of the specimen boundary
in Figure 9) when compared to other test procedures (at the central part of the coupon). This stress concentration
(off axis).
This fact indicates that the stress values at the instant
of failure cannot be associated to the shear strength of the
material, and that there must be a premature failure not
associated with the shear stress state in the central part of
the specimen. In order to try to corroborate this, a Finite
Element model of the cruciform specimen under biaxial
loading has been developed.
The numerical model was done with the commercial
Finite Element code ANSYS 19.0, using SHELL63 ele-
ments, with 4 nodes and 6 degrees of freedom per node.
Figure 11 shows the mesh of the model. Displacement
boundary conditions were prescribed at the arm ends
of the cruciform geometry, with equal values, positive
(elongation) in the vertical arms and negative (contrac-
tion) in the horizontal arms. In the horizontal (vertical)
arms, vertical (horizontal) displacements have been pre-
scribed to simulate the gripping system of the testing Figure 12: σ12 contour plot in the cruciform coupon.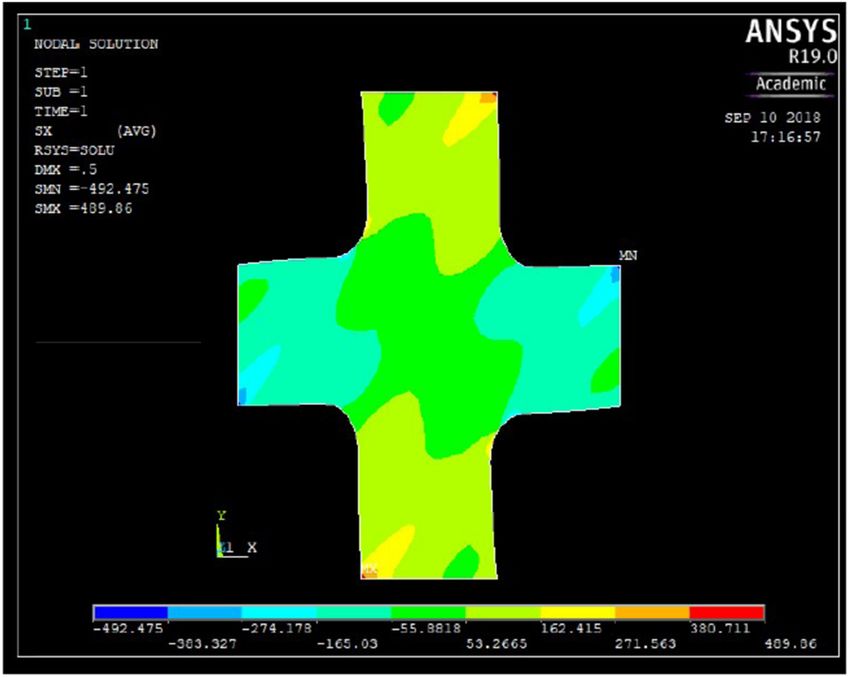
Comparison of the shear behavior in graphite-epoxy composites 221
sample. In any case, both alternatives make the prepara-
tion of the sample more difficult.
5 Conclusion
In the present work, graphite-epoxy (AS4/8552) cruci-
form coupons (with the fiber oriented at 45° with respect
to the loading directions) have been used to obtain the
mechanical properties in shear (stiffness and strength),
by means of a biaxial tension-compression test. The spe-
cimens have been machined from a unidirectional lami-
nate, with the coupon geometry oriented at 45° with
respect to the fiber direction. Biaxial tension-compres-
Figure 13: σ11 contour plot in the cruciform coupon. sion tests have been carried out to experimentally obtain
the σ12 vs γ12 curves. Experimental results have been com-
pared with the results for the same material obtained by
seems to be responsible for the observed premature failure the standard 10° off-axis tension test, finding a good
in the experimental tests, location where the tensile strength agreement between both procedures in the initial part
perpendicular to the fiber direction (Yt) is reached. This of the curves where the shear modulus is obtained, although
strength value (Yt) is significantly lower than the shear it seems that the use of mechanical extensometers gives
strength (S). In the same line, failure locations coincide, lower dispersion values when compared with the results
at the boundaries of the samples, with this transition using the video-extensometer. Nevertheless, strength values
zone, as can be observed in Figure 8. Two potential solu- obtained with the cruciform specimen show to be much
tions alternatives, see ref. [23], to allow the use of these lower than those obtained with the 10° off-axis tension
specimens for reliable strength measurements would be: test. The brittle behavior of the material together with the
(a) to use longer tabs, reaching almost the central part of presence of some local stress concentrations in the cruciform
the specimen, or (b) to use double curvature specimens to specimens has made some premature failures to appear
diminish the σ22 stress concentrations at the specimen which has affected the strength results. To analyze these
boundaries and allow the failure to be initiated by the observations, a numerical Finite Element model for the
shear stress component σ12 at the central part of the biaxial configuration has been developed. Numerical results
confirm the existence of a pure and uniform shear stress
state at the central part of the sample which allows the
stiffness characterization to be performed with this test con-
figuration. The concentration of the σ22 stress component
has also been observed, which would justify the premature
failure observed in the specimens. Thus, the use of the cruci-
form specimen is adequate for the shear modulus determi-
nation as it provides a better scenario for the shear measure-
ment under study (pure shear and uniform state in the
central part of the sample), but needs some geometrical
modifications (tab reinforcements, or double curvature) to
allow the strength measurements to be carried out in a reli-
able way.
With the experimental evidences observed in the pre-
sent work, the biaxial test configuration is a suitable test
configuration to characterize the shear behavior in com-
posite materials, due to the fact that a pure and uniform
shear stress state is produced in the central part of the
Figure 14: σ22 contour plot in the cruciform coupon. sample, where measurements are carried out. The problems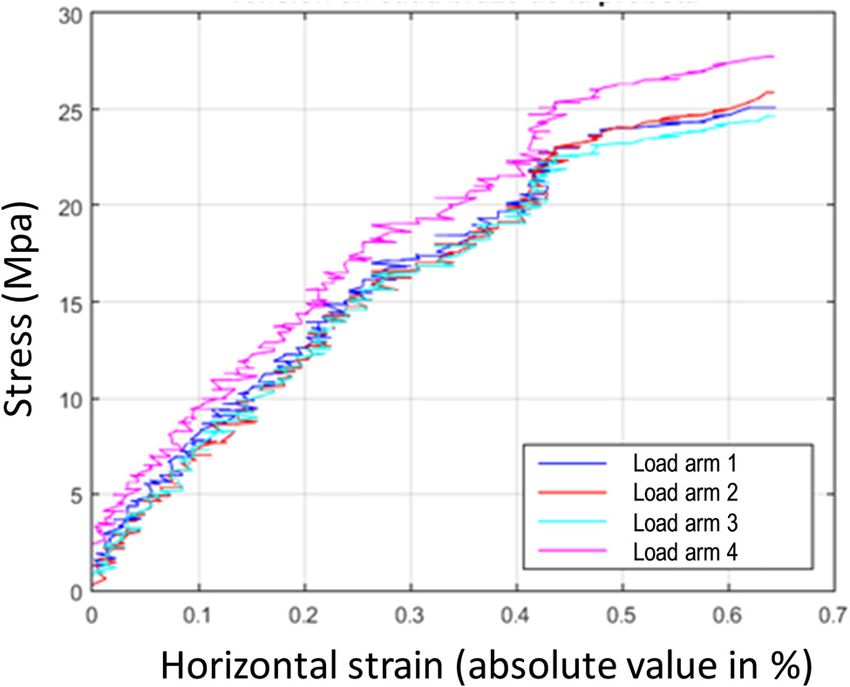
222 Juan Carlos Marín and Alberto Barroso
associated with the premature failure of the samples oblique end-tabs: theoretical and experimental studies. Comp
when obtaining the shear strength of the material seem Sci Tech. 2019;178:11–25.
to be easily solvable by a simple modification of the geo- 8 Pagano NJ, Halpin JC. Influence of end constraint in the testing of
anisotropic bodies. J Compos Mater. 1968;2(1):18–31.
metry of the reinforcement tabs.
9 Wu EM, Thomas RL. Off-axis test of a composite. J Compos Mater.
It is expected that once these premature failures are 1968;2(4):523–6.
avoided, the shear strength values would correspond to a 10 Rizzo RR. More on the influence of end constraint on off-axis
more realistic strength value of the material, as it is pro- tensile test. J Compos Mater. 1969;3:202–19.
duced in a pure shear stress state. 11 Richards GL, Airhart TP, Ashton JE. Off-axis tensile coupon
testing. J Compos Mater. 1969;3:586–9.
12 Pipes RB, Cole BW. On the off-axis strength test for anisotropic
Acknowledgments: This research was supported by the materials. J Compos Mater. 1973;7:246–56.
Spanish Ministry of Education, Culture and Sports (Project 13 Chamis CC, Sinclair JH. Ten-deg off-axis test for shear properties
MAT2016-80879-P). in fiber composites. Exp Mech. 1977;17(9):339–46.
14 Chang BW, Huang PH, Smith DG. A pinned-end fixture for off-axis
testing. Exp Tech. 1984;8(6):28–30.
Conflict of interest: Authors state no conflict of interest.
15 Pindera MJ, Herakovich CT. Shear characterization of unidirec-
tional composites with the off-axis tension test. Exp Mech.
1986;26(1):103–12.
16 Cron SM, Palazotto AN, Sandhu RS. The improvement of end-
References boundary conditions for off-axis tension specimen use.
Exp Mech. 1988;28(1):14–9.
1 Welsh JS, Mayes JS, Key CT, McLaughlin RN. Comparison of MCT 17 Sun CT, Berreth SP. A new end tab design for off-axis
failure prediction techniques and experimental verification for tension test of composite materials. J Compos Mater.
biaxially loaded gass fabric-reinforced composite laminates. 1988;22(8):766–79.
J Comp Mat. 2004;38(24):2165–81. 18 Sun CT, Chung I. An oblique end-tab design for testing off-axis
2 Smits A, Van Hemelrijck D, Philippidis TP, Cardon A. Design of a composite specimens. Composites. 1993;24(8):619–23.
cruciform specimen for biaxial testing of fibre reinforced com- 19 Marín JC, Cañas J, París F, Morton J. Determination of G12 by
posite laminates. Comp Sci Tech. 2006;66(7–8):964–75. means of the off-axis tension test. Part I: review of gripping
3 Ramault C, Makris A, Van Hemelrijck D, Lamkanfi E, Van systems and correction factors. Compos Part A Appl Sci Manuf.
Paepegem W. Comparison of different techniques for strain 2002;33(1):87–100.
monitoring of a biaxially loaded cruciform specimen. Strain. 20 Marín JC, Cañas J, París F, Morton J. Determination of G12 by
2011;47(SUPPL.2):210–7. means of the off-axis tension test. Part II: a self-consistent
4 Vankan WJ, Tijs BHAH, Jong GJ, De Fred HC, Singh NK. Stregth of approach to the application of correction factors. Compos Part A
notched and un-notched thermoplastic composite laminate in Appl Sci Manuf. 2002;33(1):101–11.
biaxial tension and compression. J Comp Mat. 21 Xiao Y, Kawai M, Hatta H. An integrated method for off-axis
2016;50(25):3477–500. tension and compression testing of unidirectional composites.
5 Kobeissi A, Rahme P, Leotoing L, Guines D. Strength character- J Compos Mater. 2011;45(6):657–69.
ization of glass/epoxy plain weave composite under different 22 Barroso A, Marín JC, Mantič V, París F. Premature failures in
biaxial loading ratios. J Comp Mat. 2020;54(19):2549–63. standard test specimens with composite materials induced by
6 Kennedy JM, Barnett TR, Farley GL. Experimental and analytical stress singularities in adhesive joints. Int J Adhes Adhes.
evaluation of a biaxial test for determining in-plane shear 2020;97:102478.
properties of composites. SAMPE Quat. 1992;27(1):28–37. 23 Correa E, Barroso A, Pérez MD, París F. Design for a cruciform
7 Marín JC, Justo J, Barroso A, Cañas J, París F. On the optimal coupon used for tensile biaxial transverse test son composite
choice of fibre orientation angle in off-axis tensile test using materials. Compos Sci Technol. 2017;145:138–48.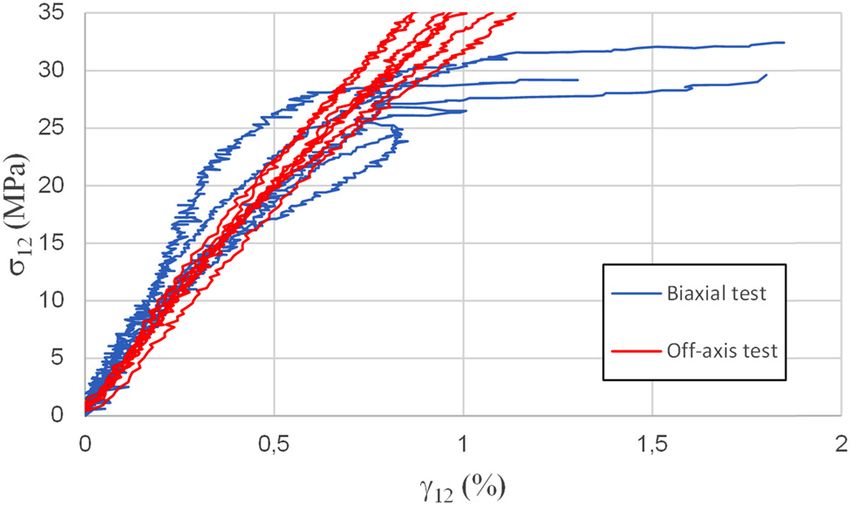

You can also read