Enabling Innovation Getting Started With Sensory Evaluation - University of Nottingham
←
→
Page content transcription
If your browser does not render page correctly, please read the page content below
Enabling Innovation Getting Started With Sensory Evaluation
Introduction

                    I want to do some sensory….

               What do you want to find out ?

               What will you use data for?

               What actions will you take in response to data?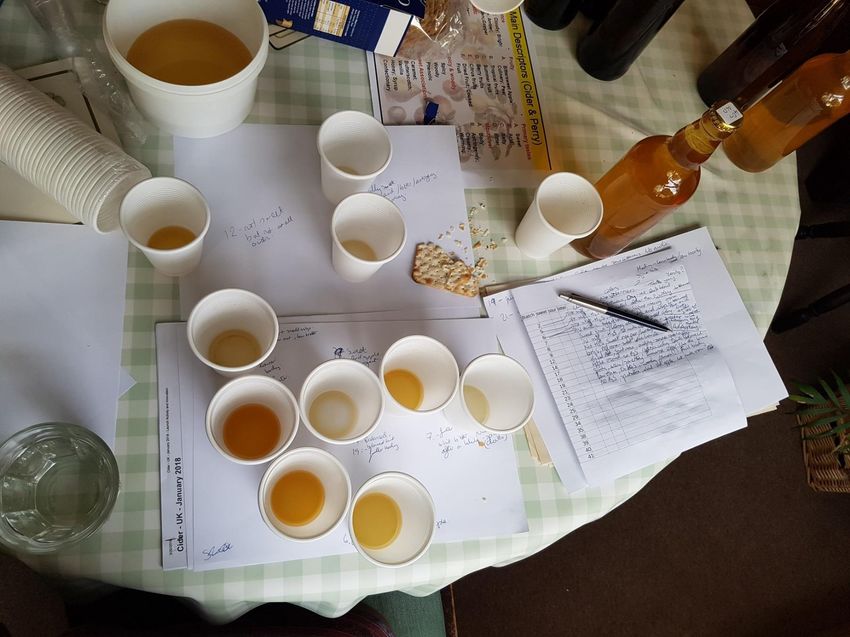
Introduction
     SUBJECTIVE
Opinions                                    Sight

Preferences
Expectations                                Aromas

     SENSORY                                Mouthfeel
    RESPONSES                                   &

   OBJECTIVE                                   Trigeminal
Differences /similarities   Sound   Taste
                                               sensations

Descriptions
Intensity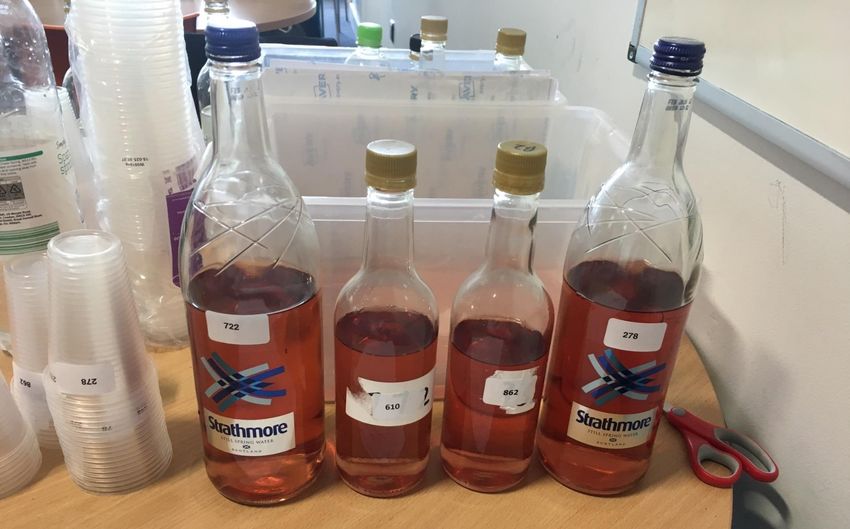
CONSUMERS
                                                       Focus group                                    Benchmarking
                                           Market awareness / competitor analysis                         Test
              Preference Tests
                                                                                                 Preference Tests
New Product Development                                                                     Existing Product
                                               Shelf life determination
(NPD)                                                                                       Development (EPD)
                                                     Discrimination                             Can people notice the change
    Acceptance Tests                                /Descriptive Tests                          Discrimination
                                                                                                          made?      Tests
                                                     FACTORY
                                                     FACTORY
                                                                                    Product Sensory spec

 Purchasing                     Goods in                    Manufacturing process                             Process
              Raw material spec: Sensory
                    parameters                                                                                Control

                                                                          Storage
    Quality Monitoring (QA / QC)                                                                    Descriptive Test
              Product Sensory spec                                         Sales
          Descriptive Tests                                                                           Customer Sensory spec

                                                                     Marketing                    Descriptive Test
         Discrimination Tests

           Difference from                          CONSUMERS
                                                    CONSUMERS                               Label descriptions /advertising
            control tests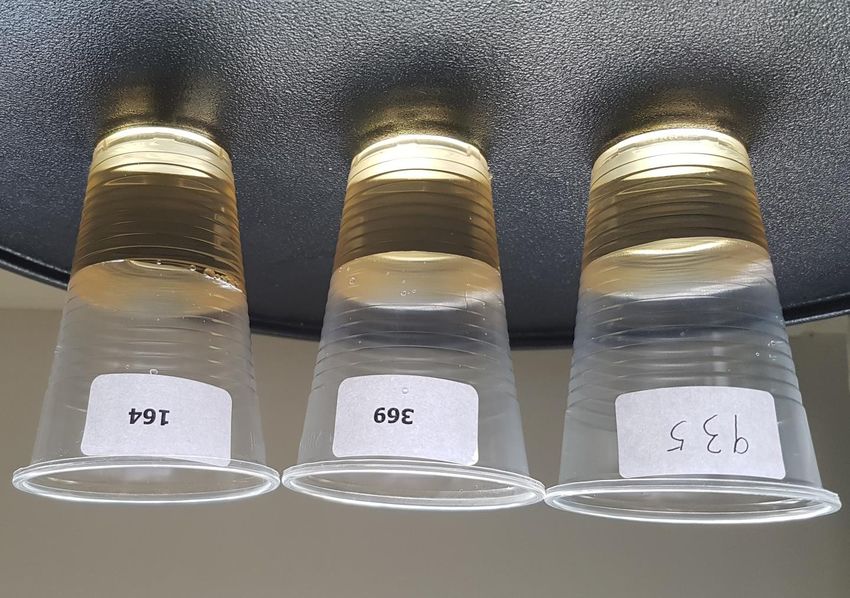
CONSUMERS
                                                         Focus   group
                                                         What are consumer
                                                           expectations?                                     Benchmarking
                                                                                                           How does my product taste
                                                                                                               compared to the
                                             Market awareness / competitor analysis                                 Test
                                                                                                                 competition?
             Which does the consumer
              Preference
                     prefer? Tests                                                                      Which does the consumer
                                                                                                         Preference
                                                                                                                prefer? Tests
New Product Development                                                                             Existing Product
                                                 Shelf life determination
(NPD)                                                                                               Development (EPD)
                                                       Discrimination
                                                      How long before it tastes
                                                                                                        Can people notice the change
   Does the consumer like this
    Acceptance     Tests
     ? And by how much   ?                            /Descriptive Tests
                                                             different?                                 Discrimination
                                                                                                                  made?
                                                                                                                             Tests
                                                       FACTORY
                                                       FACTORY
                                                                                            Product Sensory spec

 Purchasing                        Goods in                     Manufacturing process                                 Process
                Raw material spec: Sensory
                      parameters                                                                                      Control

                                                                                  Storage
                                                                                                              How is my product
    Quality Monitoring (QA / QC)                                                                            Descriptive      Test
                                                                                                            effected by the supply
                                                                                                             chain? ‘Buy backs’
                Product Sensory spec                                               Sales
                                                                                                             Customer Sensory spec
           Discrimination
           Is it consistent to last Tests
                                    batch?
                                                                             Marketing                   How to use sensory as a
                                                                                                          Descriptive
                                                                                                             selling pointTest
                                                                                                                          ?
            How is it different? Informs
             Descriptive       Tests
              root cause analysis.
               Difference
           Is this             fromHold
                   adequate quality?
                 / control   tests
                   release decisions.                 CONSUMERS
                                                      CONSUMERS                                          Label descriptions /advertising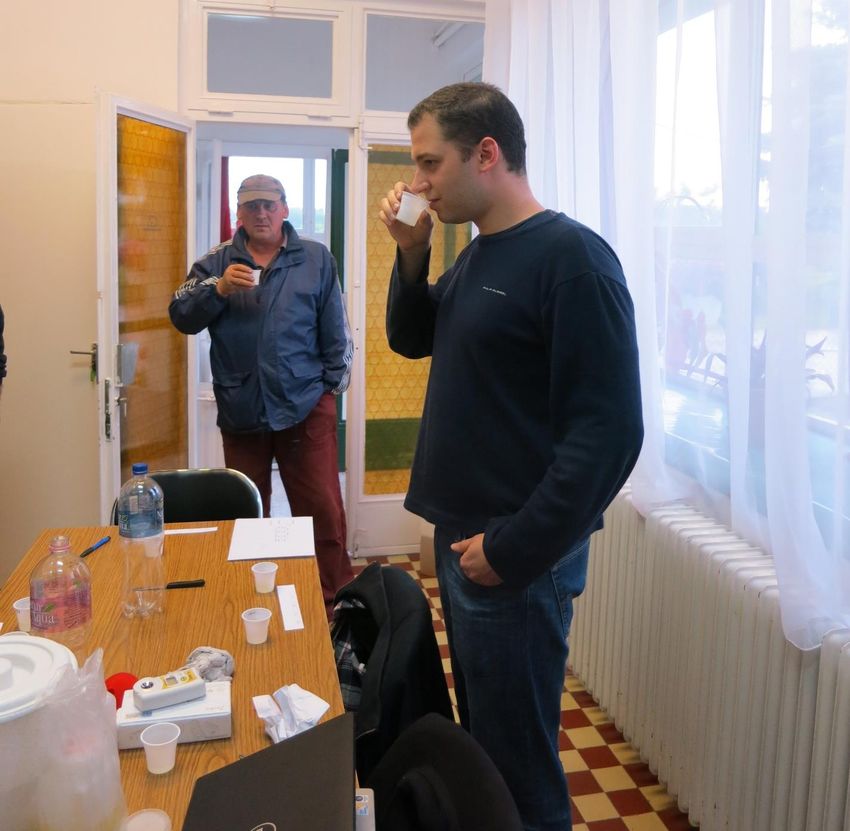
Research & Controlled Studies
Sensory evaluation for SMEs – market awareness

Benchmarking posh
chocolates - Christmas
Market:

Sensory evaluation for SMEs – sorting based on sensory profile

                                             Cider “Napping” –
                                             Dad’s Dining Room
                                             Table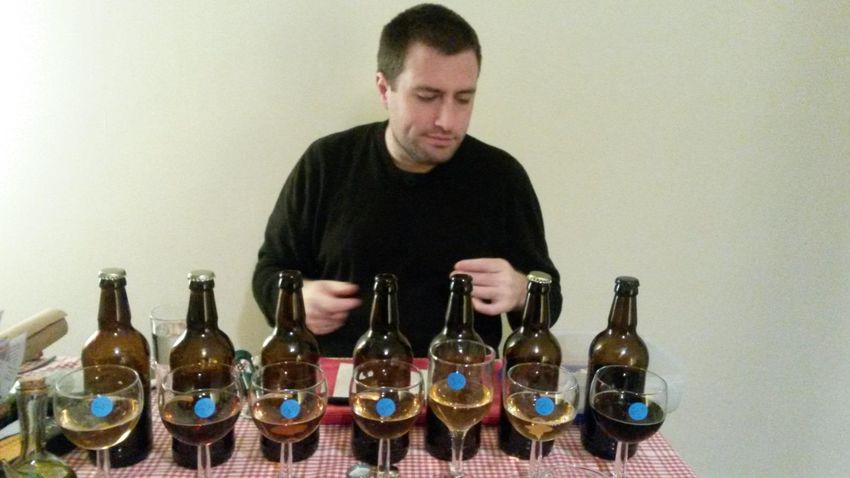
Sensory evaluation for SMEs – looking for a difference

Discrimination Test, Apple Juice - Bramley
Apple Festival Southwell Minister
Sensory evaluation for SMEs – checking there’s no difference

Triangle Test, Botanical
Extracts –

At a grower / supplier’s farm office,
Hungary
Sensory evaluation for SMEs – Descriptive Profile & Ranking Test

                             Part 1: Beer Profiling
                             – Pub in Derby (local
                                     beer drinkers)

Part 2: Beer Ranking
– My Dining Room
Table!
Practical – Basic Taste Recognition You will taste solutions of the basic tastes using store cupboard ingredients. Do not contain: • any of the official allergens as listed in 1169/2011 • alcohol Vegan and vegetarian-friendly. IF THERE IS ANYTHING ELSE YOU DON’T WANT TO CONSUME TELL ME NOW …
Basic Tastes - Recognition Test

Answers

 658

 705

 319

 548

 536

 310
Discrimination Tests – THE TRIANGLE TEST

Scenario: Artisan Elderflower drink

Production Manager: “I can make an efficiency saving by changing the process”.

Owner:               “Great, but won’t that affect the flavour of the drink…. ?”

Technical Manager: “The difference from trial runs is certainly not that huge…”
Golden Rules for Sensory

PEOPLE:

1. Use a group of people to make sensory assessments.

2. Be aware of individual differences in detection / perception.

3. Avoid coffee, mouth wash and smoking 2 hours before assessment.

4. Use palate cleansers:      Samples type tested                               Palate cleanser
                              Most products                                     Still, unchlorinated water (not mineral water).
  (and leave time to palate   Products with strong flavours or tastes           + Plain crackers/ water biscuits. Unflavoured,
   cleanse).                  that might persist                                no salt.
                              e.g.: beer bitterness / spicy food /
                              artificial sweeteners                             For spicy food – milk.
6. Don’t do too many
   samples / have breaks.     Fatty /creamy / oily products                     Slice bland apple (e.g: Gala)

                              Products high in astringency
7. Due diligence –                                                              0.1% pectin solution
                              e.g.: tea (other products high in polyphenols –
   food safety.               cider, rhubarb, cranberry juice)                  Piece of melon
Golden Rules for Sensory
SAMPLES
4. CONSISTENT – size / shape / format / sample container / temperature
5. REPRESENTATIVE of batch / product
ENVIRONMENT
6. Avoid distraction
odours
conferring
7. Get out of factory wherever possible.Golden Rules for Sensory - Sample Presentation
Triangle Test:
Create your own Random 3 digit numbers in
Excel:
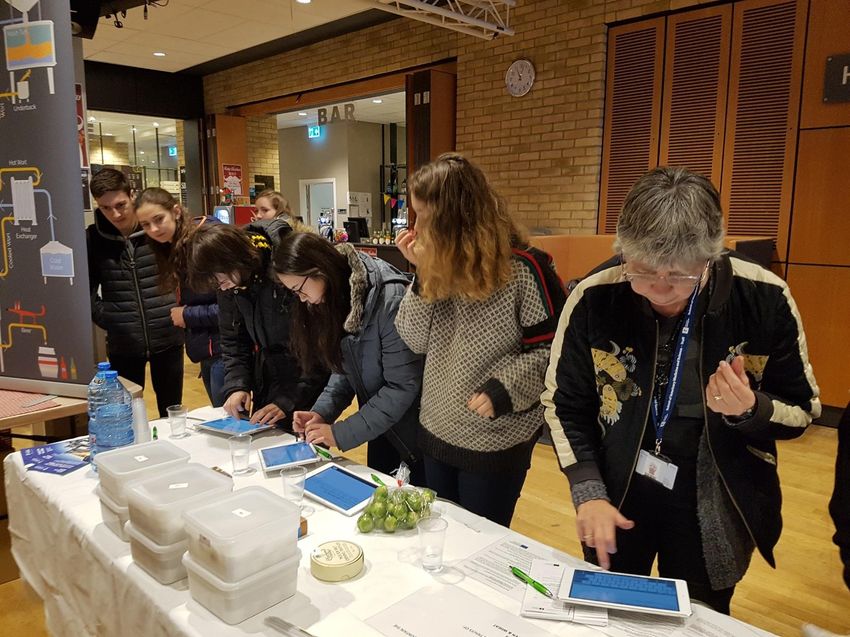
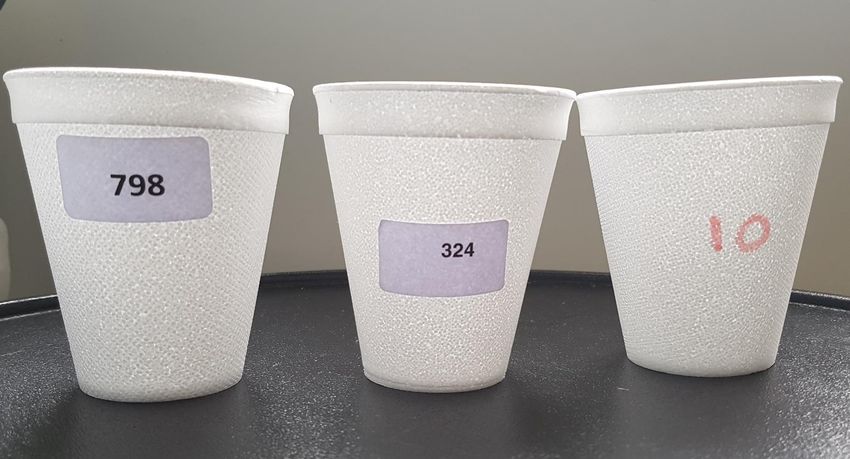
=RANDBETWEEN(1,999)Golden Rules for Sensory - Sample Presentation Labelling is inconsistent, draws attention to one sample.
Golden Rules for Sensory - Sample Presentation

Again different manner of labelling - font, colour, number of digits.
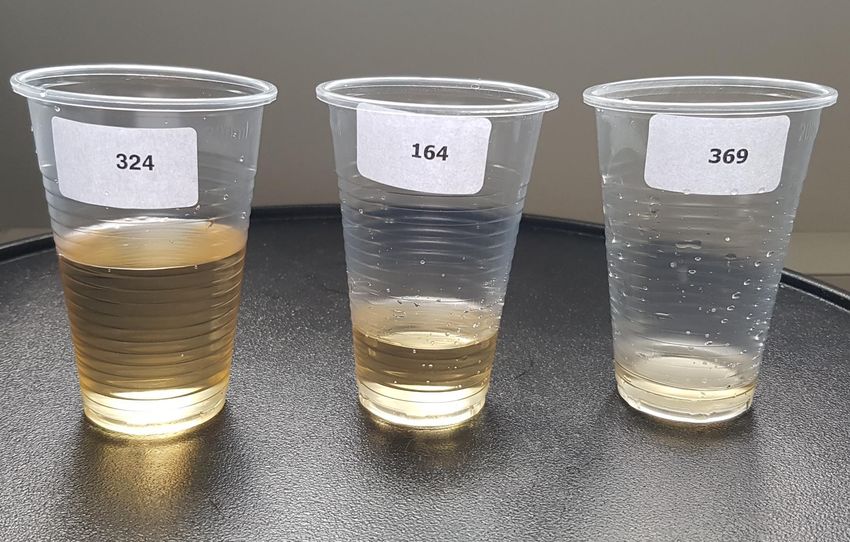
Golden Rules for Sensory - Sample Presentation

Different sample sizes – bias / not enough to evaluate for some
             samples, too much to drink in others.
Golden Rules for Sensory - Sample Presentation
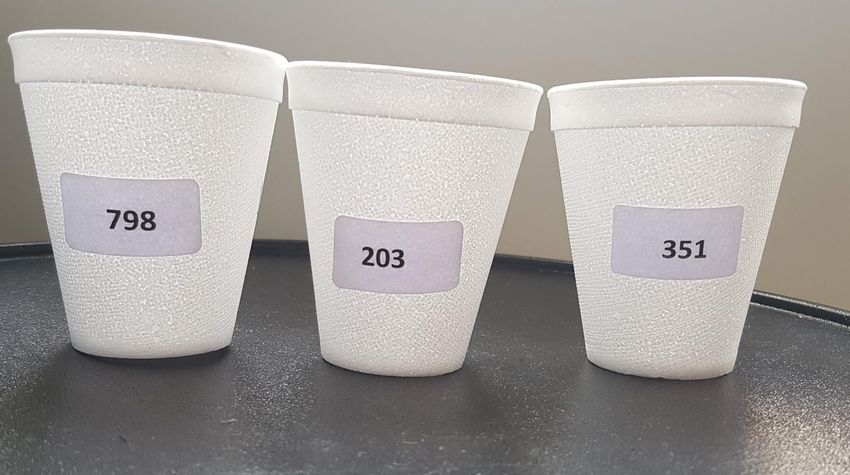
Golden Rules for Sensory - Sample Presentation

                                          Same cups

                                          Same labels

                                          Same label position

                                          3 digit random codes

                                          All contain same amount:
                                          30ml.
Practical – Triangle Test Elderflower drink contains: Water, sugar, lemon juice, fresh elderflowers, citric acid. Does not contain: • any of the official allergens as listed in 1169/2011 • alcohol Vegan and vegetarian-friendly.
Discrimination Tests – THE TRIANGLE TEST
• Often called a DISCRIMINATION / OVERALL DIFFERENCE TEST.

• “In general (using all senses) can you tell a difference between 2 samples”.

• Common situations: INGREDIENT CHANGE.          PROCESS CHANGE.

• Allows you to declare if the samples are SIGNIFICANTLY DIFFERENT or not.

• Does NOT allow you to say the samples are ‘SIMILAR’ where a significant
  difference is found.

• Typically you have already determined that the samples pretty close in profile
  and you want some data to decide one way or the other.

• Good number of people to use: 24 – 30 (most balanced : nos. divisible by 6)
Discrimination Tests – THE TRIANGLE TEST: Set up

• BALANCED DESIGN reduces bias.

• 6 possible orders of presentation:
                                          A A B                 B B A
                                          A B A                 B A B
  where A = test sample
        B = control sample                B A A                 A B B
• BEST PRATICE:

  Give first 6 people one each of the above; then repeat each presentation
  order an equal number of times.

• Get organised – make a plan….
Discrimination Tests – THE TRIANGLE TEST: Results Analysis
Number of respondents from your test Number of people needed to correctly
identify the different sample in order to
Critical Value Table for Triangle Test Data declare a significant difference (p =
0.05; 95% confidence level)
Analysis 6
7
5
5
Data source: BS ISO 4120:2004 Triangle Test 8
9
6
6
10 7
11 7
12 8
13 8
14 9
15 9
95% confidence level 16
17
9
10
• Typical for food industry sensory 18
19
10
11
20 11
21 12
22 12
• Only a 5% risk that you wrongly conclude the 23
24
12
13
25 13
samples are different. 26
27
14
14
or 28
29
15
15
30 15
You are 95% confident of the conclusion from 31
32
16
16
the test. 33
34
17
17
35 17
36 18
… …Discrimination Tests – A SME Difference from Control Test
IS THE PRODUCT / RAW MATERIAL QA during production
‘IN SPECIFICATION’ ? - e.g: raw materials /
}
intermediates
IS THE PRODUCT / RAW …preventative
MATERIAL CONSISTENT WITH
PREVIOUS BATCHES? QC finished product
…hold / release decision
IS THERE A DETECTABLE FAULT?
Shelf – life testing NPD /
EPD
IS THE PRODUCT STILL RECOGNISABLE / …determine BBE
REPRESENTATIVE OF BRAND? Buy back testing
….QC once in supply chain
…pick up misuse / abuseDiscrimination Tests – A SME Difference from Control Test
Control / Reference Point Test samples
Brand std.
Sample
….
People – know product well / trained
OR
Documented
Standard
- Spec.
- QAS
- PhotosDiscrimination Tests – A SME Difference from Control Test – Set up
A scoring system : assesses & decision making
IN SPECIFICATION ACCEPTABLE OUT OF SPECIFICATION
Taint
Sensory Profile Off flavour
profile close but
matches some Different
control variation profile
RELEASE RELEASE REJECT
Root Cause AnalysisPRACTICAL – Basic Different from Control Test
Scenario: Daily QA Taste Panel in Brewery
Sample ingredient list:
Water, BARLEY malt, rice, hops.
• Remember to include Hidden Controls sometimes.
Validates Method
Validates Panel Ability
• Include a space for descriptive comment.
• Can develop a number of scales for key attributes.Discrimination Tests – summary • Are OBJECTIVE TESTs – no opinions / emotions involved! • Who ? People from the company. • Triangle Test is a commonly used overall difference test when you have 2 samples to test for general differences. • Difference from Control Test is commonly used in QA/QC. Compare multiple samples to a reference (specification/control sample) for overall difference. • Paired Comparison Test is used for a specific attribute test when you have 2 samples to test for a difference in specific attribute (eg: which sample is sweeter?). • Ranking Test is used to test for difference of specific attribute test when there are 3 or more samples.
Consumer Testing - PRACTICAL

Scenario: Acceptance test – Cloudy premium apple juice

      I’ve just inherited an orchard, there are loads of apples, I’ve had some juice
      made. I think it tastes wonderful! I’m going to start a business…

      1) Do consumers like the taste of my new juice? Why ? and by how much?

      2) Is it sweet enough for them ? (I could store the fruit, press later; make it sweeter)

      3) How does their opinion of my
         juice compare to their opinion
        for competitor juices?

      4) Will people buy my juice?
Consumer tests – general rules
PEOPLE:
Who ? : TARGET MARKET CONSUMERS
How many ? : THE MORE THE BETTER – AT LEAST 100
Everything we said on slide 15 about people applies.
ENVIRONMENT:
Where?: SPECIFIC VENUE WITH INVITES or SHOWS/FESTIVALS/MARKETS
Context will affect the result you get.
SAMPLES & PRESENTATION:
Safe, representative, consistent, 3 digit random codes, balanced presentation
orders…
Branding ?/ Not?Consumer Testing - PRACTICAL Shall I do a preference test against Copella ? What would that show us? Whether the consumers prefer mine more than Copella’s. What wouldn’t it show us? Whether they like my juice at all. Preferable = not necessarily likeable. How much they do or don’t like my juice in its own right. How big the difference is between their liking for mine and Copella’s. If they’ll buy it. Whether the sweetness level is perfect; only if preferable/not.
Consumer Testing – PRACTICAL – ACCEPTANCE TEST

Each sample 1 by 1 + 9 point category scale:

“Please taste the sample & indicate your opinion by ticking a box below”

    ACCEPTANCE TEST will allow me to:

     See if & how much they like:
                      a) my juice.
                      b) Copella juice.              …..in their own right /against expectations.

    Ask some more questions to understand key attributes important to product.
Consumer Testing – PRACTICAL – ACCEPTANCE TEST Sample ingredient list: Apples, ascorbic acid (vitamin C). Does not contain: • any of the official allergens as listed in 1169/2011 • alcohol Vegan and vegetarian-friendly.
Consumer Testing – PRACTICAL – ACCEPTANCE TEST

Diagnosis questions:

2) Comment: “Please explain why you scored it as you did?”

    (I have not yet influenced them).

3) Just About Right scale: Sweetness (specific attribute)

“Please indicate by circling below, your opinion on the sweetness of the juice?”

(I have now influenced them, but I captured their unbiased thoughts first! So OK to ask this at this
point).
Consumer Testing - PRACTICAL– ACCEPTANCE TEST
1) Do consumers like the taste of my new juice? Why ? and by how much?
2) Is it sweet enough for them ? (I could store the fruit, press later; make it sweeter)
3) How does their opinion of my
juice compare to their opinion
for competitor juices?
4) Will people buy my juice?
How to improve design?Consumer Testing -– ACCEPTANCE TEST - Results Basic analysis results: 1) FREQUENCY of responses to each LIKING or JAR CATEGORY added up. 2) CALCULATE MODAL CATEGORY most frequently selected category. 3) PLOT GRAPHS 4) LOOK AT TRENDS - generally liking / disliking 5) TALLY COMMENTS > SEE TRENDS > USE TO EXPLAIN TRENDS More advanced analysis: • Statistical testing for significant difference can be applied.
Consumer Testing -– ACCEPTANCE TEST - Results
Consumer Testing - ACCEPTANCE TEST – Sum up

ACCEPTANCE TEST useful for:

1) Testing out NEW / NOVEL product on own or multiple recipes.

2) BENCHMARKING against competition.

3) Can add WHY? questions – discover KEY DRIVERS LIKING
                       ….. drivers you weren’t thinking about
 With packaging       Do they like the        Will they try it ?
                      packaging and
                      branding ? How
                      much?
                                                                     Wording & order
 With packaging &     Is everything meeting   Will they buy it?
 price & context      expectations?                                questions CRITICAL!
 Blind samples        Do they like its        Will they repeat
 No packaging         sensory properties?     purchase ?
                      How much?
Descriptive Tests
• Putting words to sensory sensations, so you can
communicate about the product to others:
1) CHARACTERISE the product in detail
2) DEFINABLE
3) RELEVANT to those using the data
• Describes the facts ; no opinion.
• Sensory description important for: 1) specifications
2) quality attribute sheets
Often useful for marketingDescriptive analysis – A qualitative profiling method for SMEs
PEOPLE:
Who ? : Familiar / experienced with product.
Interested / willing.
People already good at verbalising sensations
Pre-screening questionnaire
Writing marketing material – consumers > consumer language.
Writing a specification – employees > language familiar to those in QA.
How many ? : 6 - 8
Everything we said on slide 15 about people, sample presentation, consistency
applies.Descriptive analysis – A qualitative profiling method for SMEs Scenario: Qualitative descriptive profiling – Crisps A crisp manufacturer wants to characterise their new crisp product in order to create a sensory description for a specification and quality attribute sheet. Ingredient list/ special dietary info: 1st sample – Potatoes, sunflower oil, sea salt. Gluten free. These chips are suitable for vegans. 2nd sample - Potato, high oleic sunflower oil (33%), salt.
Descriptive analysis – A qualitative profiling method for SMEs
1) GENERATE WORDS – ALONE – note down in grid provided.
2) DISCUSS as a group.
3) DEFINE the words.
Name reference benchmarks > training
4) REFINE TERMS – merge common descriptors.
5) KEEP A TALLY – no. of times a word is used by multiple people
Common usage > key attributeA Basic Sensory Specification
Basic Sensory Profile : X brand Ready Salted Crisps
This qualitative profile represents brand standard quality.
Appearance:
Aroma:
Taste & flavour:
Mouthfeel/texture/trigeminal:
Aftertaste:More Advanced Sensory Specification
Traffic Light Sensory Specification: X brand Ready Salted Crisps
BRAND STANDARD QUALITY ACCEPTABLE – for release UNACCEPTABLE – reject
Appearance
Insert Insert Insert
photo photo photo
Aroma
Taste &
flavour
Trigeminal
sensations
Mouthfeel/
Texture
AftertasteDescriptive analysis – A qualitative profiling method for SMEs
Your product. Acceptance
Descriptive Test Data
Profile Competing How much liked
products & why
Key sensory properties
POWERFUL STUFF!!
• Market awareness.
• Informed product development.
properties to create
properties to avoidIn Summary
• You can get a lot of info. from some very simple tests, on a low budget.
• Have a clear objective and a good plan.
• Do everything possible to reduce bias in:
Samples
Way test is conducted
• Use the most appropriate people for each test & use as many as possible -
remember about individual differences in sensory acuity & perception.
• Give the people best possible environment to make good measurements for you.
• Practice required to aid descriptive ability – you & employees.
• Sensory evaluation has benefits operationally & commercially.Other Sensory Workshops For more detail: 19th September 2018 Sensory Evaluation Course • Accredited by Institute of Food Science and Technology. • Exam to get an IFST certificate. Please take a flyer ….
Further Work

For more information on sensory evaluation
                      or
          bespoke sensory work
               free to SMEs in
      Nottinghamshire & Derbyshire
                   contact:
    Alice Jones – Sensory Scientist
         University of Nottingham
              0115 951 6739
      alice.jones@nottingham.ac.uk
    www.foodinnovationcentre.co.uk
You can also read