Diamond Building Products PCL - Corporate Presentation : H1/2019 Performance Opportunity Day On Thursday 5 September 2019 at 10.10 - 11.10 at SET ...
←
→
Page content transcription
If your browser does not render page correctly, please read the page content below

Diamond Building Products PCL
Corporate Presentation : H1/2019 Performance
Opportunity Day
On Thursday 5 September 2019 at 10.10 – 11.10 at SET Meeting Room 603

Disclaimer
      ▪   The information contained in this presentation is for information purposes only and does not constitute an offer or invitation to sell
          or the solicitation of an offer or invitation to purchase or subscribe for share in Diamond Building Products Public Company Limited
          (“DRT” and shares in DRT, “shares”) in any jurisdiction nor should it or any part of it form the basis of, or be relied upon in any
          connection with, any contract or commitment whatsoever.

      ▪   This presentation may include information which is forward-looking in nature. Forward-looking information involve known and
          unknown risks, uncertainties and other factors which may impact on the actual outcomes, including economic conditions in the
          markets in which DRT operates and general achievement of DRT business forecasts, which will cause the actual results,
          performance or achievements of DRT to differ, perhaps materially, from the results, performance or achievements expressed or
          implied in this presentation.

      ▪   This presentation has been prepared by the DRT. The information in this presentation has not been independently verified. No
          representation, warranty, express or implied, is made as to, and no reliance should be placed on, the fairness, accuracy,
          completeness or correctness of the information and opinions in this presentation. None of the DRT or any of its agents or advisers,
          or any of their respective affiliates, advisers or representatives, shall have any liability (in negligence or otherwise) for any loss
          howsoever arising from any use of this presentation or its contents or otherwise arising in connection with this presentation.

      ▪   This presentation is made, furnished and distributed for information purposes only. No part of this presentation shall be relied
          upon directly or indirectly for any investment decision-making or for any other purposes.

      ▪   This presentation and all other information, materials or documents provided in connection therewith, shall not, either in whole or
          in part, be reproduced, redistributed or made available to any other person, save in strict compliance with all applicable laws.

                    Note: All currency figures within this presentation are presented in Thai Baht (“THB”) unless otherwise stated.
                                                                                                                                                   2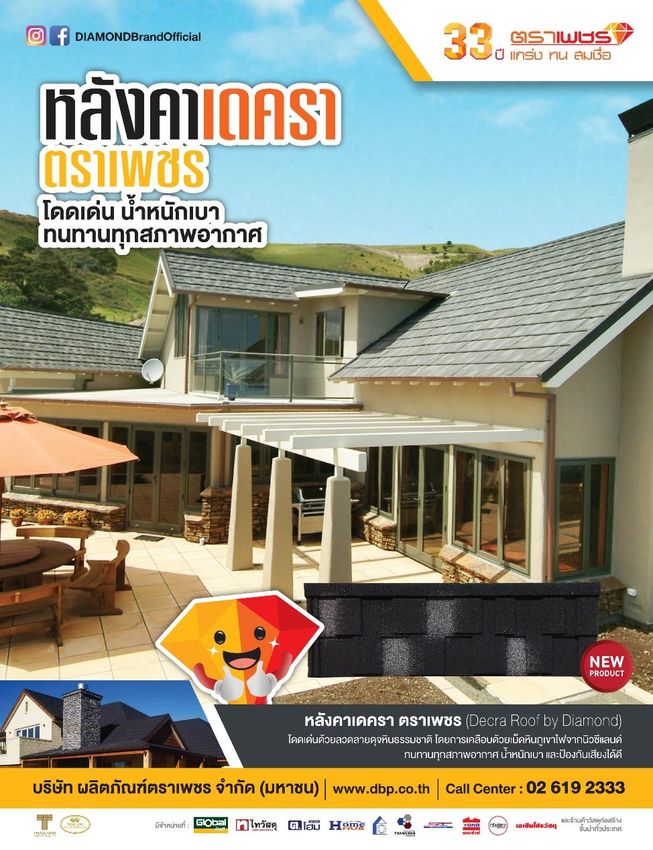
AGENDA
▪   Company Overview
▪   Financial Performance
▪   Business Expansion
▪   Appendix

                            3
COMPANY OVERVIEW

                   4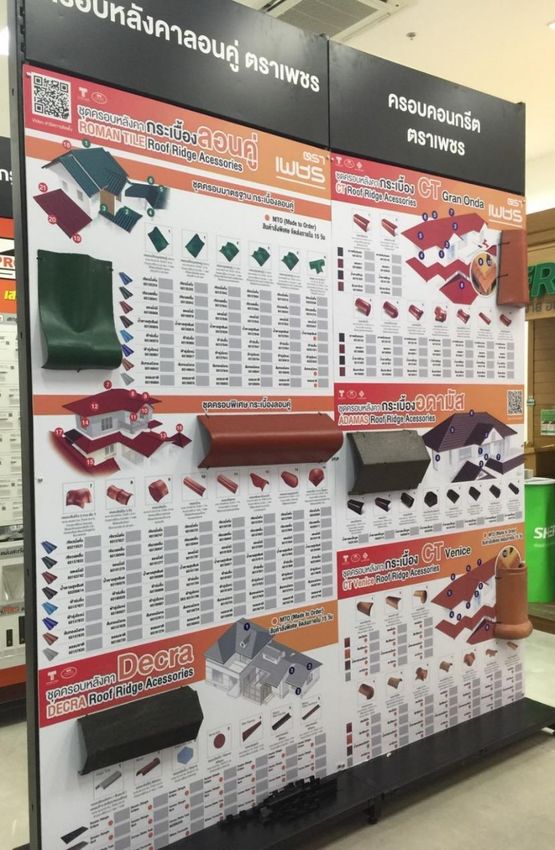
Business Overview
                                                                                   Construction materials market share /2
                                                                                               Others 10%
     ▪   Founded in 1985, DRT is one of the top 3                                   Kiternit
                                                                                   Group 5%
         manufacturers and distributors of roofing
         products in Thailand.
     ▪   DRT’s core products includes tiles, boards &
                                                                                         DRT 20%
         ceilings, siding boards, roof accessories, and some                                                        Siam
                                                                                                                  Cement
         non-roofing products.                                                                                   Group 53%

     ▪   DRT mainly distributes its products through agents
                                                                                   Mahaphant
         (mom&pop shops) and modern trade nationwide.                              Group 12%

     ▪   DRT has continued to grow through product
         improvement and development and gradual
         production expansion.

     ▪   DRT is listed on the Stock Exchange of Thailand
         (SET) with a market capitalization of approximately
         THB 5,688 million/1.

                 Source:   1. www.set.or.th as of August 23, 2019.
                           2. Ministry of Commerce. Based on FY2017 sales value.
                                                                                                                             5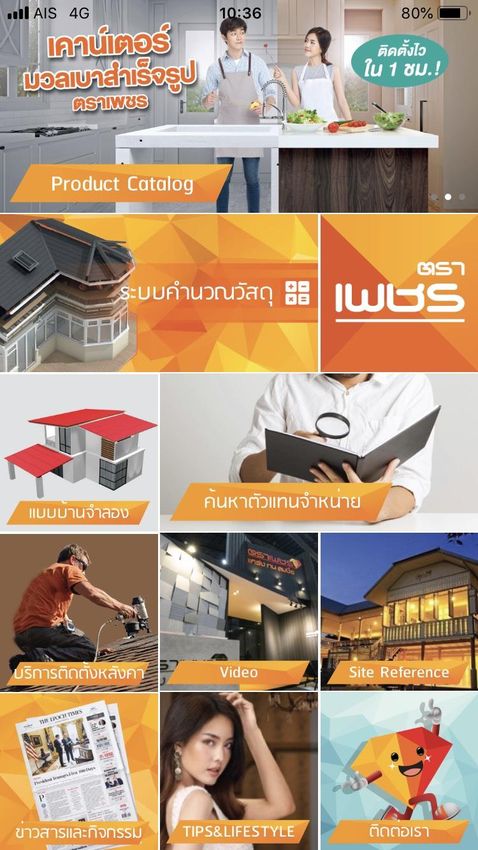
Milestones                                        2012
                                                   Launched its first
                                                                         2014
                                                                            Launched new
                                                                                                 2016

                                                   non-asbestos             products :
                                                   fibre cement tile        ▪ Jatulon
                                                                            ▪ Decorative Floor
    1985                  2005                                              ▪ Stair Plank
    Established           Listed on the
    under the name        Stock Exchange
    Siam City Tiles       of Thailand                                                                    Launched new products : RLC
    and Pipes Co.,        (SET)                                                                          ▪ Diamond Lintel
    Ltd.                                                                                                 ▪ Diamond Kitchen Counter       Launched new products :
                                                                                                         ▪ Diamond Door Frame            ▪ CT-Venice

          1985 - 1999                2000 - 2009                                                                           2018

    2001                                                                                                       Launched new products :
    Changed the                                                                                         2015   ▪ Grooved Siding Board
                                                                 2013                                                                            2019
    name to                                    2006                                                            ▪ Ventilation Board
    Diamond                    Launched its first     ▪ Established its firstly                                ▪ Fence
    Roofing Tiles              non-asbestos tile        owned distribution
    Co., Ltd.                  Jearanai Tile –          center (DC), located in
                               • Thai Modern
                                                        Khon Kean
     2002                                             ▪ Acquired an autoclaved
     Myriad Materials
                                                        aerated concrete (AAC)
     Co., Ltd became a
     major                                              plant in Chiangmai
     shareholder                                      ▪ Launched a new
                                                        production line of
                                                        autoclaved aerated
Launched new Jearanai Tile :
                                                        concrete (AAC) in
▪ Thai Classic
                                                         Saraburi
▪ Elegant
▪ Thai Lanna

                                                                                                                                                                   6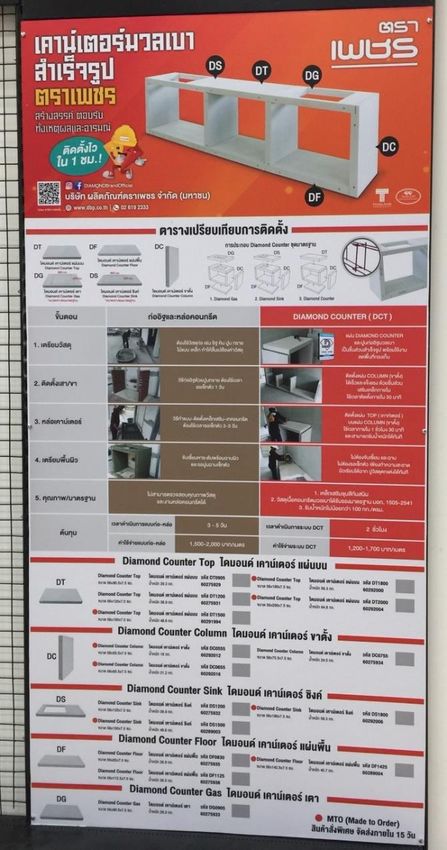
Strategic Shareholders
               Established in 2002 as a holding company to acquire DRT from the previous owner – Siam City Cement
               Plc.(SCCC)., Myriad Materials is a major shareholder of DRT, having Srivikorn Family and Pradipasen Family
               as major shareholders. As entrepreneurs of various businesses with long and successful records, the families
               bring to DRT business know-how’s and expertise in construction and property development markets.

                         Srivikorn and                                                                                         Foreign
                      Pradipasen Families                                                           Thai
                        & Management                                                                                         Institutions
                                                                                                Institutions
                              4.2%                                                                 34.1%                        1.2%

                                                                                                                  Thai
                                                                                                               Individuals
                                                          Free-float
                                                                                                                 64.7%
                                                            36.9%
     Totaling 63.1%

                               Myriad Materials
                                      58.9%

                         Source:   Company estimates as of March 13, 2019.
                                                                                                                                            7
Production Base
                                              Total Capacity FY2019: 1,100,000 ton/yr
       Chiangmai
                                                                             Khon Kean
       Capacity: 50,000 ton/yr
       Product:                                                              Capacity : 50,000 ton/yr
          ▪ Autoclaved aerated                                               Product: Tiles
            concrete (AAC)

                                                                             Distribution Center, Khon Kean
                Saraburi
                Capacity: 1,000,000 ton/yr
                Product:
                  ▪ Tiles
                  ▪ Board and ceiling
                  ▪ Siding board
                  ▪ Autoclaved aerated
                    concrete (AAC)

                                                                                     Existing production facilities
                                                                                     Existing distribution center (DC)

                Source: Company estimate as at August 23, 2019.
                                                                                                                         8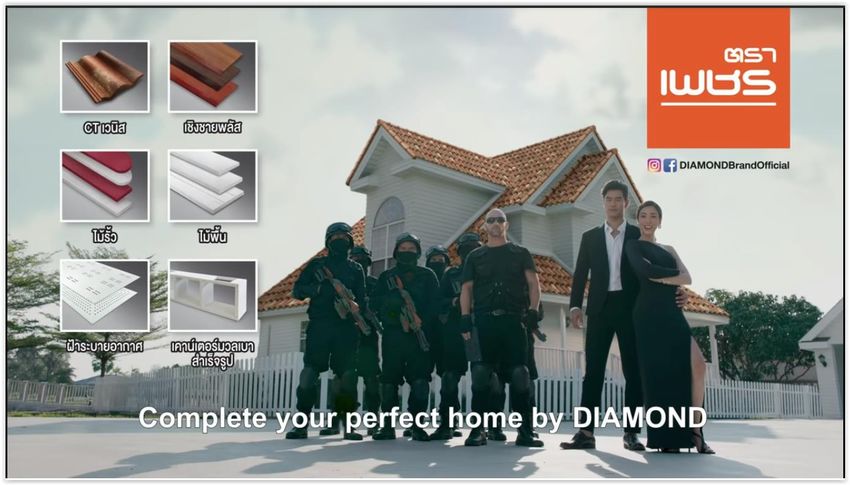
Strategies Behind Our Success

                                               Product       With the main focus in consumer’s needs and
                                              variety &      satisfaction, product variety and differentiation as
                                           differentiation   well as value for money are keys to retain and
                                                             enhance market base.

        Over 6,000 nationwide                                              Product delivery with 24 hours with
                                   Extensive            Excellent
      agents and modern trade                                              regular training on product handling
                                  distribution          services
       specialties with growing                                            and safety
                                    network
             exporting channel

                                               Strong
                       Strong brand         relationship      Prudent financial          Strong balance
                        awareness               with              policies               sheet yielding
                                            distributors                                 financial flexibility

                                                                                                                    9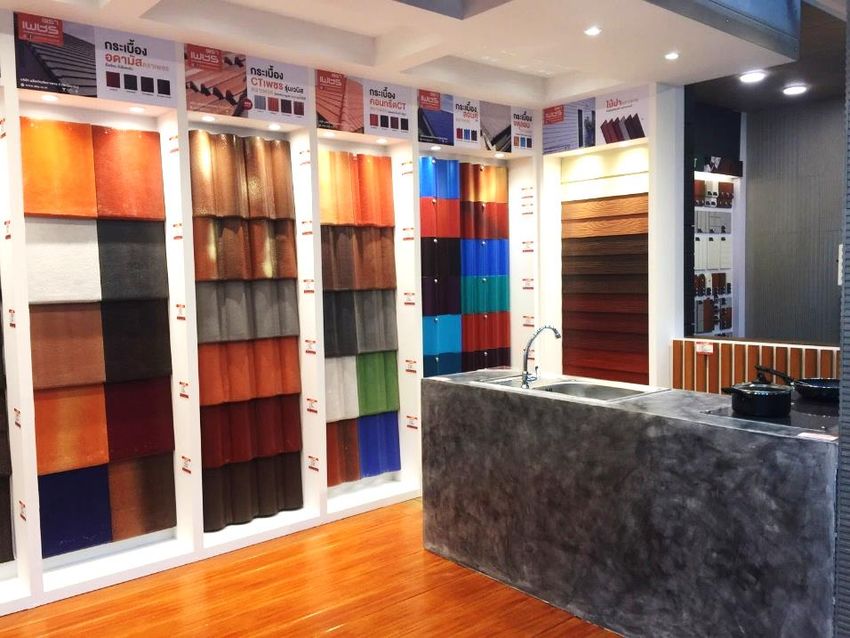
Product and Service Segmentation
                                          Sales of Products 92%                                                    Service income 8%

                          Tiles                                               Board and ceiling                             Services
              CT,                                                 Board, Flat sheet, Gypsum, Diamond wall,        Roof stripping and installation
     Adamas, Roman tiles,                                            Autoclaved aerated concrete (AAC)
     Small corrugated tile,
            Jatulon

                                                                                                                            Re-roofing
                     Siding board                             New RLC :
                                                              ▪ Diamond Lintel
                 Siding and Artificial wood
                                                              ▪ Diamond Kitchen
                                                                Counter
                                                              ▪ Diamond Door Frame
                                                                               Special products
                                                               Roof equipment, Foil, Roof paint, Diamond Truss,

                        Note: 1. Percentage based on H1’19 revenues from sales and services.
                                                                                                                                                    10
Distribution Channels
H1’18
16% Modern Trade
16%
Leading construction materials and home improvement specialty stores
Agent 55% 18%
Agent
(mom&pop )
(mom&pop )
11%
54% 18% Export
To 9 Destinations in Asia Region
12% Projects
Direct sales to leading residential China
developers:
▪ Land & House Taiwan
▪ Pruksa India
Laos
▪ Supalai Myanmar Philippines
▪ Sansiri
Vietnam
▪ Asia Property
Cambodia
▪ Prinsiri
▪ Golden Residence Malaysia
Note: Percentage based on value of H1’19 sales.
11Logistic System and Trainings
Service excellence with timely product delivery and training assistance
▪ Integrated system linking production, inventory, purchase order, and logistics
▪ Reliable product delivery within 24 hours
▪ Full fleet of product delivery via trailers, trucks and overseas shipping
▪ Free trainings for contractors’ employees on product handling &
safety precautious
▪ Assistance on logistics & products storage
Shipping
Trailers
Trucks
12Diamond … A Trusted Brand
Diamond Brand has been known as a high quality tile for nearly 30 years. Through its consistently seeking customer feedback and
continuous product development, Diamond Brand is now one of the Thailand’s most trusted brands in tile/1.
เครื่องหมาย มอก.
ISO 9001 : 2015
กระเบือ้ งคอนกรีต
แบบลอน และแบบเรียบ
BrandAge
February
2017
อันดับ กระเบือ้ งมุงหลังคา ที่ น่าเชื่อถือที่ สดุ
อันดับ % %
แบรนด์
2017 2016 2017 2016 +/-
2 2 ตราเพชร 17.25 14.56 2.69
อันดับ ไม้และวัสดุทดแทนไม้ ที่ น่าเชื่อถือที่ สดุ
THAILAND TRUSTED MARK
อันดับ % %
ตราสัญลักษณ์รบั รอง แบรนด์
2017 2016 2017 2016 +/-
สิ นค้าประเทศไทย
4 4 ตราเพชร 7.69 6.31 1.38
Source: “BrandAge” Magazine dated February 2016.
1314
New Product : Decra

                      15
Distributor … A Strategic Arm
Over decades, DRT has marketed its products through traditional dealers (mom and pop shops). Its strong and aged relationship with these
distributors nationwide is one of DRT’s competitive advantages and part of DRT’s continued success.
16FINANCIAL
PERFORMANCE
17Financial Highlights
Bt. million
2,800 2,650
2,600
2,400 2,324
2,200
2,000
1,800
1,600 1,395
1,400 1,196 1,255
1,128
1,200
1,000
800 680
599 548
600 441
314 285 356 324 324 344
400 236 205 256 212 224
140 116 132
200
0
1Q18 2Q18 H1'18 1Q19 2Q19 H1'19
Total revenues Gross Profit EBITDA Net profit
H1’19 Net Profit analysis
% QoQ Growth 1Q19 2Q19 % YoY Growth H1’19
▪ H1’19 Net Profit increased 35% YoY, due to
Total revenues 36% (10%) Total revenues 14%
the fact that every distribution channel has
Gross Profit 40% (9%) Gross Profit 13% expanded significantly, as well as effective
EBITDA 94% (31%) EBITDA 24% cost management has resulted in
maintaining profit margin at a good level
Net profit 142% (38%) Net profit 35% and the extraordinary item from the sale of
unused land of Baht 46.31 million.
18Revenues from Sales and Service
THB million
2,580
2,600
2,317
2,400
2,200
2,000
1,800
1,600 YoY
1,329 1,251
1,400 1,192 11%
1,125
1,200
1,000
800 QoQ
600 6%
400
200
0
1Q18 2Q18 1Q19 2Q19 H1'18 H1'19
Tiles Board & ceilings Siding boards Special products Other products Service
H1’19 Revenues breakdown H1’19 Total revenues analysis
Board &
ceilings
15% ▪ H1’19 Revenues from sales and Service increased
Siding 11% YoY, due to the increase in revenue from sales
boards
17%
of almost every type of products, including the
roofing tiles, autoclaved aerated concrete blocks,
Special siding boards and trusses.
products
8%
Tiles Other
49% products
3%
Service
8%
19Costs of Sale and Service Breakdown
THB million
2,000 1,900
1,718
1,500
YoY
973 11%
1,000 878 927
840
QoQ
500
5%
0
1Q18 2Q18 1Q19 2Q19 H1'18 H1'19
Raw materials Utilities Depreciation
Labour Services Permanent labour H1’19 Costs breakdown
Costs 1Q18 2Q18 1Q19 2Q19 H1’18 H1’19 Utilities
Variable costs 70% 70% 71% 70% 70% 71% Depreciation
7%
5% Labour
Fixed costs 19% 19% 17% 19% 19% 18%
Service costs 11% 11% 12% 11% 11% 11% 3%
Services
H1’19 Costs analysis Raw 11%
materials
54%
▪ H1’19 Costs of sales and Service increased 11% YoY, due to the increase Permanent labour
8%
in product sales volume of 8.15 percent and increase in raw material
cost, salary and benefits of the employees, gas expenses and repair and maintenance
Others 7% 5%
maintenance expenses.
20SG&A Expenses
THB million
350 318
300 283
250
YoY
200 12%
155 163
141 142
150
100
QoQ
50
5%
0
1Q18 2Q18 1Q19 2Q19 H1'18 H1'19
Personnel Promotion Packaging Others
H1’19 SG&A breakdown H1’19 SG&A analysis
▪ H1’19 SG&A expenses increased 12% YoY, due to the increase in
Personnel
52%
marketing and sales promotion expenses, salary and benefits of
Promotion
4%
the employees and other selling expenses.
Packaging
11%
Others
33%
21Profit Margins
THB million % Margin
Gross Profit Gross Profit
1,800 50%
1,600
40%
1,400
1,200 26% 25% 26% 26% 26% 26% 30% YoY
1,000 13%
20%
800
600 10% QoQ
400 9%
0%
200
314 285 356 324 599 680
0 -10%
1Q18 2Q18 1Q19 2Q19 H1'18 H1'19
Gross profit (LHS) GP Margin/1
THB million % Margin
EBITDA and Net Profit EBITDA Net Profit
1,000 30%
23%
20% 19% 21%
800 18% 18%
15% 20%
13% YoY YoY
600 12% 11% 11%
10% 35%
10%
24%
548
400
441
344 0%
QoQ QoQ
324
200 31%
236 205 212 224 256 38%
140 116 132
0 -10%
1Q18 2Q18 1Q19 2Q19 H1'18 H1'19
EBITDA Net Profit EBITDA Margin/1 Net profit Margin/1
Note: 1. Includes revenues from services and other income.
22Cash Flows
H1’19 cash flows analysis
▪ H1’19, บริษทั ฯ มีกำไรสุทธิ 344 ล้ำนบำท, มีกระแสเงินสด
จำกกำรดำเนินงำน 405 ล้ำนบำท ซึง่ เพียงพอต่อกำรจ่ำยเงิน
ปั นผล และดอกเบี้ยจ่ำย
THB million
400
350
300 273
254
250
212
200 171 171 171
151
150 140
132
116 66
100 90 70
80
50 37
- 2 - - 1 - 2 63 4 - -
2 - - 1
-
1Q18 2Q18 3Q18 4Q18 1Q19 2Q19
Net Profit CFO Repayment Long Term Interest paid Dividends paid
23Capital Structure
Short Term debt THB 368 million 30 June 2019 debt analysis
▪ As at end of 30 June 2019, net interest-
Average interest rate of 1.91% p.a. as follows
• Floating interest rate of 1.60-2.00% p.a. bearing debt to equity was 0.15 times, which
is decreased from end of the previous year,
due to the increase in equity but decrease in
debt .
THB million Times
3,500 0.80
3,000 0.62
2,255
0.53 2,076 0.60
2,500 2,214 2,300 0.47 2,288
2,245 2,324 1,995
0.39
2,000 1,896
1,486 0.35 0.40
1,500 1,212
0.25
0.24
930 918
1,000 838
198 368 0.20
525 511
500 0.07 0.15
57 59 14 28 21 24 20 34 32
0 0.00
FY2012 FY2013 FY2014 FY2015 FY2016 FY2017 FY2018 1Q19 2Q19
Cash & current investment Interest bearing debts Equity Net D/E
24Share Information and Dividend
Dividend policy is not less than 50% of normal net profit
THB per share %
1.0 93% 100%
86% 88%
83% 84% 82%
77% 77% 75% 76% 77%
0.8 80%
0.6 0.53 60%
0.47 0.46 0.44
0.40 0.43 0.43
0.39 0.36 0.38 0.38 0.39 0.36 0.36
0.4 0.30 0.33 0.30 40%
0.29 0.290.27
0.25 0.25
0.2 20%
0.0 0%
2008 2009 2010 2011 2012 2013 2014 2015 2016 2017 2018
EPS DPS Dividend payout (RHS)
Share information
Par value: THB 1.00 Stock price : THB 6.00 per share
Listed share: 948 million shares P/E 11.13 Times
Market capitalization: THB 5,688 million P/BV 2.52 Times
Foreign limit: 49.00% Dividend yield 6.00%
Source: www.set.or.th as of August 23, 2019.
25Income Statements
% YoY % QoQ
P&L Highlight (in THB million) 2Q19 2Q18 1Q19 H1’19 H1’18 % YoY change
change change
REVENUES
Revenues from sales and services 1,251 1,125 11.2% 1,329 -5.9% 2,580 2,317 11.3%
Other incomes 4 3 71.7% 66 -93.4% 70 6 1046.4%
Total revenues 1,255 1,128 11.3% 1,395 -10.0% 2,650 2,324 14.1%
COSTS
Costs of sales and services 927 840 10.3% 973 -4.8% 1,900 1,718 10.6%
Other costs - - 0.0% - 0.0% - - 0.0%
Total costs 927 840 10.3% 973 -4.8% 1,900 1,718 10.6%
Selling and administrative expenses 163 142 15.1% 155 5.7% 318 283 12.3%
Operating profit (EBIT) 165 146 13.2% 266 -38.1% 432 322 34.0%
Finance costs 1 2 -16.8% 2 -36.9% 4 4 -3.1%
Income tax 32 29 10.4% 53 -39.9% 84 63 33.6%
Net profit 132 116 14.3% 212 -37.6% 344 256 34.6%
26Balance Sheets
Balance Sheet (in THB million) Jun 30, 2019 Dec 31, 2018 % change
Assets
Cash & cash equivalents 32 20 57.5%
Trade & account receivables 650 553 17.5%
Inventories 755 762 -1.0%
Other current assets 11 31 -63.4%
Total current assets 1,448 1,366 6.0%
Property, plant, and equipment 1,746 1,695 3.0%
Non-current assets 83 77 8.7%
Total assets 3,277 3,138 4.4%
Liabilities
Short-term loans 368 511 -28.0%
Other current liabilities 496 411 20.6%
Total current liabilities 864 922 -6.3%
Other non-current liabilities 158 139 13.2%
Total liabilities 1,022 1,062 -3.7%
Equities
Retained earnings 976 796 22.5%
Total equities 2,255 2,076 8.6%
27BUSINESS EXPANSION
28Growing with Strategies
Growing the business with prudent financial policy
Revenue Growth Gross Profit Margin Total Debt to Equity
Target ≥ 5% pa. 25-27% ≤ 1.0x
Growth strategies 2018 - 2020
▪ Expand production capacity and product variety to high margin specialties
▪ Channel sales mix adjustment /1:
Modern Trade Export Project
12% 15% 18% 20% 11% 15%
Note: 1. Percentage based on total sales.
29APPENDIX
30Marketing Activities
Domestic
31Advertising : “S.W.A.T.” ; Digital TV & Online Platform
32Printed Advertising
33Out of Home Media / Billboard / In Store Media
34Facebook; Thai / Khmer / Burmese
35Youtube & Instagram : DIAMONDBrandOfficial
36Mobile Application : DIAMOND Brand
37Product Display
38Product Display
39Stand Show & Sales Kit
40Premium
41Promotion
42Agent Seminar & Grand Sales 2019 : 11 May 2019
43Agent Seminar & Outing : May – Jun. 19
44Modern Trade : Grand Opening New Store
ไทวัสดุ สาขานครปฐม ไทวัสดุ สาขาบ้านฉาง
ไทวัสดุ
สาขาศรีมหาโพธิ
45Booth : Thai Watsadu : Baan & Beyond Expo 2019 : Feb. – Mar.
46Event : Thai Watsadu Contractor Night @Surin 3rd Aug. 19
47Thai Watsadu Workshop @Saraburi Plant : 5, 12 Mar. 19
48Public Reletions : “RID ROBOPACK”
Photo Release : 24 มิ.ย. 62 Exclusive Interview : “Wealthythai” เผยแพร่ 12 ก.ค. 62
คณะกรรมการ บริษทั ฯ เยี่ยมชมสายการผลิตโรบอต
49Product Knowledge Training & Seminar
50Product Knowledge Training & Seminar
51DIAMOND
Architect
Contest 2019
52Marketing Activities
Export
53Website & Catalog : English, Burmese, Khmer, Vietnamese, Chinese & Thai
54Laos : Agent Signage & Stand show
55Laos : Stand show & Product Display
56Myanmar : Showroom
57Myanmar : Product Knowledge Training
58Cambodia : Product Knowledge Training & Workshop
59CG Activities 2019
รับมอบฉลากประหยัดพลังงาน รับรางวัล
บริษทั ฯ ได้ร ับรางวล
ั 5 ดาว ( )
กลุ่มดีเลิศ (Excellent) ประสิ ทธิ ภาพสูง "องค์กรนวัตกรรม“
เมื่อวันที่ 14 ม.ค. 62 เมื่อวันที่ 5 ต.ค. 61
บริษทั ฯ ได้ร ับ รางวัลประเมินคุณภาพ AGM
ปี 2561 เท่ากับ 100 คะแนน (ดีเลิศ)
บริ ษั ทฯ ไ ด้ รั บ ESG- 100 เป็ นอ งค์ กรที่ มี
ความรั บผิดชอบต่ อสังคม สิ่งแวดล้ อมและมี ธรร
มาภิ บ าลจาก สถาบั น ไทยพั ฒ น์ เมื่ อวั น ที่
26 ส.ค. 2562
บริษทั ฯ ได้ร ับรองการต่ออายุ
เป็ นสมาชิกของแนวร่วม ่ น”
ได ้รับรางวัล“หุ ้นยังย
ปฏิบต ั ข
ิ องภาคเอกชนไทยใน (THSI) ประจาปี 2561
การต่อต้านทุจริต (CAC) ต่อเน่ องเป็ นปี ที่ 2
60CSR Activities 2019 ตราเพชร ดูแลพนักงานใส่ใจชุมชน เอื้อเฟื้อสังคม
จุดตรวจหลักและบริ การประชาชน เพื่อป้ องกันและลด
อุบัตเิ หตุทางถนนช่ วงเทศกาลสงกรานต์ ปี 2562
บริษัทฯ มอบหมวกให้ กับ นายวิสุทธิ์ คงสุจริ ต สวัสดิการ
และคุ้ ม ครองแรงงานจั ง หวั ด สระบุ รี เพื่ อ น าไปแจก
ประชาชนที่มาร่ วมงานพระราชพิธีบรมราชาภิเษก
61THANK YOU
Diamond Building Products Public Company Limited
69-70 Moo 1, Mitraphap Road - km. 115, Tambon Talingchan, Amphur Muang, Saraburi 18000
Tel: 0-3622-4171-8 Fax: 0-3622-4187
Call Center : 0-2619-2333
Website: www.dbp.co.th
For further information & enquiries, please contact our investor relations at:
Telephone: 0-3622-4171-8 Ext. 193
Email: corpcenter@dbp.co.th
62You can also read