Returning to the path of capital-efficient growth Berenberg European Conference - Pennyhill, 6 December 2016 - SHW AG

Page created by Isaac Greene
 
CONTINUE READING
Returning to the path of capital-efficient growth Berenberg European Conference - Pennyhill, 6 December 2016 - SHW AG
Returning to the path of capital-efficient growth

       Berenberg European Conference

               Pennyhill, 6 December 2016
Returning to the path of capital-efficient growth Berenberg European Conference - Pennyhill, 6 December 2016 - SHW AG
Agenda

    Preparing the return to capital-efficient growth

    > Strategic roadmap for returning to capital-efficient growth
    > Financial goals 2016 and beyond
    > Financial results 9M 2016

                                                                    1
Returning to the path of capital-efficient growth Berenberg European Conference - Pennyhill, 6 December 2016 - SHW AG
SHW’s strategic roadmap

                   Phase I: Consolidation                 Phase II: Capital-efficient growth

                                  Operational excellence

                                                  Internationalisation

                                          Innovation

       2015        2016            2017            2018             2019             2020

         After a phase of consolidation SHW will get back on the track for capital efficient
                                            growth
                                                                                               2
Returning to the path of capital-efficient growth Berenberg European Conference - Pennyhill, 6 December 2016 - SHW AG
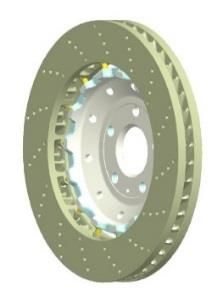
Our strategic priorities – Enhance operational excellence (I)

    Lean management

                    >   Shorter cycle times in Powder Metallurgy
     Production     >   Press tool optimisation in order to achieve higher process stability
     excellence     >   Linking and automation of production processes in Powder Metallurgy and Brake Discs
                    >   Release of temporary workers since Q4 2015

                    > Further development of process and matrix organisation
     Organisation   > Close integration of business critical departments (e.g. procurement, sales, R&D) within
                      the production network of Aalen-Wasseralfingen and Bad Schussenried

     Procurement
                    > Reorganisation of the purchasing and supplier management
      & supplier
                    > Centralising of certain functions in one location
      excellence

                    > Implementation of shopfloor management
     Leadership
                    > Implementation of continuous improvement process and KPI cockpit

                         Execution of measures increase production efficiency
                                and trigger performance improvements
                                                                                                                 3
Returning to the path of capital-efficient growth Berenberg European Conference - Pennyhill, 6 December 2016 - SHW AG
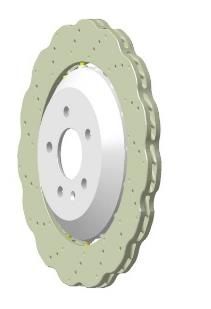
Our strategic priorities – Enhance operational excellence (II)

    Capacity and production lots increase

      Demand-
      capacity    > Investments of approx. € 20m (2014–2016) in Powder Metallurgy
     imbalance

      Powder      > Sufficient capacity and flexibility for bigger, economical batch sizes
                  > Significant reduction of backlogs and logistics costs
     Metallurgy
                  > Reduction of reworking costs

       Pumps      > Positive effects on Pumps Assembly division
      Assembly    > Operations can run smoothly; no capacity or logistical constraints

           Investments improve efficiency and profitability of Powder Metallurgy business,
                         positively impacting also pump assembly division
                                                                                             4
Our strategic priorities – Enhance operational excellence (III)

    Production network optimisation eastern Europe

          Relocation phase              Production phase

    H1/2016                      2017
                                                                 > Low single-digit million
    > Decision on target         > Partial start of production
                                                                   infrastructure investment
      location taken             > Relocation of further           costs
    H2/2016                        assembly lines
                                                                 > Annual sales in eastern
    > Set-up of infrastructure
                                 > Sales expected to amount        Europe to be expected
    > Relocation and               to a double-digit million       above € 100m in 2020
      commissioning of first       euro amount
      assembly line

          Earnings improvements should reach high single-digit million Euro range by 2020
                                                                                               5
Our strategic priorities – Drive internationalisation (I)

                                                    Bad Schussenried
                                                        Germany
                       Aalen-Wasseralfingen
                             Germany
         Toronto
         Canada

                                                                              LongKou
                                                                                China

                                                      Neuhausen ob Eck
                                                           Germany       Shanghai
                            Tuttlingen-Ludwigstal                           China
                                  Germany

         Sao Paulo
            Brazil

                                                                         Pumps &
                                                                         Engine         Brake Discs
                                                                         Components

                         SHW is present in all strategic markets
                                                                                                      6
Our strategic priorities – Drive internationalisation (II)

    Pumps & Engine Components

                  2015                2016                 2017                 2018                2019               2020

     NAFTA

                              Re-entry into the market                                  SOP for North American OEM in US

     China
                                      Start of operating activities                                SOP for North American OEM

                                                   2 SOPs for Chinese OEM       2 SOPs for North American/Chinese JV

                                                                                   SOP for European OEM

     Other
                                  Production capacity shift to eastern Europe          SOP for North American OEM in Europe

                                                                                   SOP Eastern Europe

             Brazilian subsidiary and ramping up of production                         SOP for North American OEM in Brazil

                                                                      SOP for leading manufacturer of fully electric vehicles

                                                                                                           Engine         Transmission

             Enhanced international presence as catalyst for further international growth
                                                                                                                                         7
Our strategic priorities – Drive internationalisation (III)

    Brake Discs

                  2015             2016                 2017                 2018                   2019             2020

     NAFTA

                Development of market entry strategy               Market entry                      SOP and ramp-up

     China

                  SOP JV for unprocessed Brake Discs                 Switch to production of processed Brake Discs

     Other

                                          Ongoing evaluation of further cooperation possibilities

             Enhanced international presence as catalyst for further international growth
                                                                                                                            8
Our strategic priorities – Leverage innovation leadership (I)

                       > SHW’s prototypes delivered to OEMs and Tier 1 suppliers
                       > R&D experts were able to optimise performance of two stroke vane pump:
                            > Weight reduction
                            > Efficiency increase up to 85 per cent
       Two stroke           > CO2 emission reduction of up to 2g per CO2 / km (NEDC)
       vane pump

                       > Transmission applications becoming increasingly important also in electric cars
                       > Product solution serves as primary transmission pump for cooling and lubricating
                         the transmission and the electric motor
                       >   Needs-oriented cooling and lubrication of the electric powertrain
      Electric pump    >   Major contract from world’s leading manufacturer of fully electric vehicles
     for cooling and   >   Lifetime sales volume of approx. € 100 million
       lubricating     >   SOP scheduled for the first half of 2017

           SHW offers primary transmission oil pumps for vehicles powered by combustion
                    engines (incl. hybrids) as well as for battery electric vehicles
                                                                                                            9
Our strategic priorities – Leverage innovation leadership (I)

                           > Pump helps to reduce CO2 due to a reduced capacity of the
                             primary pump
                           > Serves as secondary, needs-oriented transmission pump

         Auxiliary         > Enables start-stop and sailing function in cars
     transmission oil
          pump

                           > Electrical double stage oil pump combines two pumps in one solution
                           > Offers two pressure stages:
                                  High pressure stage enabling gear and clutch actuation
                                  Low pressure stage serving as coolant and lube oil pump
    Scalable electric
       power pack          > Savings in space and thus weight reduction
    transmission oil
         pump

                        Growing market for electrically driven transmission oil pumps
                                                                                                   10
Our strategic priorities – Leverage innovation leadership (III)

                Standard casted                                                     High end casted
                 ventilated disc                    SHW Patent                         wave disc
                                                                                    Weight reduction
                                                 Weight reduction                    > 2 kg / disc
                                                 about 2 kg / disc

                             Weight reduction, improved comfort + performance

   > SHW is innovation leader for lightweight products in the automotive sector

   > Composite brake discs with aluminium pot significantly contribute to weight reduction

   > Weight reduction of unsprung masses improves driving performance

           The megatrends weight reduction, corrosion resistance and reduction of brake dust
                             are key drivers for the Brake Discs division
                                                                                                       11
Financial goals – Sales and EBITDA

                      Phase I: Consolidation                    Phase II: Capital-efficient growth

                       SHW Europe   SHW International                                     630 – 660
                                                                        570 – 600
         463.5        410 – 430        410 – 430        480 – 505
                     [440 – 460]      [440 – 460]

Sales
 (€m)

                                                                                                      14%
                                                                        As of 2018:                   13%
                                                                                                      12%
         43.5         43 – 47                                       EBITDA margin ≥12%
EBITDA                                                                                                11%
                                                                                                      10%
(€m)
                                                                                                      9%

         2015        2016E             2017E            2018E            2019E             2020E

           Margin improvement in 2016 sustained by positive effects resulting from efficiency
                                measures in both business segments
                                                                                                            12
Financial goals – Investments and depreciation

                           Phase I: Consolidation                 Phase II: Capital-efficient growth

                                           32 – 35
                                                                                             29 – 32
                            25 – 28                      26 – 29           27 – 30
               23.9

Investments
    (€m)

                                                                           31 – 33           31 – 33
                                           25 – 27      26 – 28
               22.5         21 – 23
   Dep
   (€m)

              2015          2016E           2017E        2018E              2019E            2020E

                 Investments in the consolidation phase trigger capital-efficient growth from 2018
                                                    onwards
                                                                                                       13
Financial goals – Miscellaneous

       Capital     > Sustainable and strong capital structure with a balance sheet equity ratio of at least 30
      structure      per cent to 40 per cent

      Debt ratio   > Leverage potential to increase net debt / adj. EBITDA ratio to a maximum of 2.5

                   > High flexibility in terms of financial and strategic headroom: syndicated loan facilities
      Liquidity
                     plus additional baskets

      Free cash
                   > Focus on optimising operating free cash flow
         flow

      Dividend     > Results-oriented dividend policy with a pay-out ratio of 30 per cent to 40 per cent of the
       policy        net income for the year taking into account the financing requirements of SHW

                                                                                                                  14
Your key takeaways

                     Sales for FY 2016 at the lower end of the € 410 million to € 430 million range

                     Driven by the effects from the efficiency measures the EBITDA is still expected at the
                     lower end of the € 43 million to € 47 million range

                     We confirm our SHW 2020 strategy – we believe in capital-efficient growth from 2018
                     onwards

                     With new orders from China we safeguarded more than € 100 million turnover in
                     China in 2020

                     Entry into the market of fully electric vehicles once again underlines innovation
                     leadership

                                                                                                              15
Financial Calendar 2016

 Dates                    Events

                          European Conference – Berenberg Bank
 6 December
                          Pennyhill (London)

                                                                 16
Contact Investor Relations

                         Michael Schickling
                         Head of Investor Relations & Corporate Communications

                         Telephone: +49 (0) 7361 502-462
                         E-Mail: michael.schickling@shw.de

                         Sandra Scherer
                         Junior Manager Investor Relations & Corporate
                         Communications

                         Telephone: +49 (0) 7361 502-469
                         E-Mail: sandra.scherer@shw.de

                                                                                 17
Stable market environment in Q1-Q3/2016

    Light Vehicle Production                  SHW Group Sales (€m)
    (< 6 t) (m units)                                                               > Moderate increase of global
                                                                                      light vehicle production by
         18.6
                                                                                      3.4 per cent to 67.7 million
                                                   358.5
  16.8
            15.7 16.1                                      312.2                      units with strong regional
                    13.2 13.5                                                         discrepancies

                                                                                    > Combustion engines incl.
                                                                                      hybrids continue to dominate
                                   2.4 2.0

                                                                       Q1-Q3/2015
                                                                                    > Diesel engine production in
    China       Europe    North      South
                         America    America                            Q1-Q3/2016     Europe above prior year
   Global Engine Production                   Global Transmission Production
   (m units)                                  (m units)                             > Above-average growth rates
                                                                                      for automatic transmissions;
                53.3                                                 38.8
    51.6                                                     36.4                     global production increased
                                               28.8 28.5                              by 6.6 per cent to 38.8
                                                                                      million units
                          13.6      14.0

         Gasoline              Diesel            Manual        Automatic

  Source: IHS, October 2016

                SHW well positioned to benefit from market trends and global demand for mobility
                                               from 2018 onwards
                                                                                                                     18
Group

   Sales (€m)            Sales by quarter (€m)                             > Sales decline in the Pumps
                                                                             and Engine Components
          -12.9%                                                             business segment as
                                  123.1
        358.5           117.0 106.6   108.7
                                            118.3                            expected
                312.2                          97.0 105.0
                                                                           > Sales in the Brake Discs
                                                                             business segment
                                                                             influenced by lower number
        Q1-Q3/ Q1-Q3/       Q1          Q2           Q3           Q4
         2015   2016
                                                                             of units sold and lower
                                                                             material surcharges
   Adj. EBITDA (€m)      Adj. EBITDA by quarter (€m)
                                                                           > Adj. EBITDA margin
           -1.6%
                                                                             increased from 9.2 per cent
         33.0   32.5    11.0 10.8 11.9 11.0 10.0 10.7 10.5                   to 10.4 per cent despite
                                                                             reduced sales
         9.2%   10.4%
                         9.4% 10.1%   9.7% 10.1%   8.5% 11.1%   10.0%

        Q1-Q3/ Q1-Q3/      Q1           Q2           Q3           Q4
         2015   2016
                                                        2015        2016

                                       Results within target range
                                                                                                           19
Financial figures Q1-Q3/2016

                                                     Q1-Q3/    Q1-Q3/
                                                                                  > Sales development as
     €m1                                                                 Change     expected
                                                      2016      2015
     Group sales                                      312.3     358.5    -12.9%
                                                                                  > Adj. EBITDA margin of 10.4
     Adj. EBITDA                                       32.5      33.0    -1.6%      per cent exceeds 2015
     as % of sales                                    10.4%      9.2%
     Depreciation (excl. PPA)                          18.3      16.5    +11.5%   > Net income influenced by an
                                                                                    investment related increase
     Adj. EBIT                                         14.1      16.5    -14.6%
                                                                                    in depreciation and a non-
     as % of sales                                     4.5%      4.6%
                                                                                    recurring consolidation effect
     ROCE                                             11.6%     14.3%               in FY 2015
     Net income for the period                          9.9      12.4    -19.8%
     EPS (in €)                                        1.54      1.95    -21.1%   > Working Capital increased
     Investments2                                      16.7      19.3    -13.8%        > Inventories up to ensure
     as % of sales                                     5.3%      5.4%                    supply readiness

     Working capital as % of sales                    14.1%     11.7%                  > Lower receivables due to
     Equity ratio                                     51.2%     46.6%                    lower sales and receivables
                                                                                         management
     Operating free cash flow                          -13.5      -3.6   275.5%
     Net cash / net debt                                -7.8      -9.0   -14.0%        > Payables lower following
                                                                                         lower investments
   1 Figures   include rounding differences
   2 Additions   to tangible and intangible assets

                                    Efficiency measures driving positive margin development in 2016
                                                                                                                       20
Customer sales

                                                                         91.1
          VW
                                                                  81.5
                                                                                > Expected decrease in sales
                                                         64.3
      Daimler
                                                49.5                              with VW Group and Daimler
                                 27.9
                                                                                  Group
        BMW
                                  29.6
                                         38.6
                                                                                > Decline in sales relates
         Audi                                                                     mainly to two volume
                                 27.2
                            22.3                                                  products due to a customer’s
   Volvo Cars
                           20.0                                                   switchover of technology as
     Thyssen              17.7                                                    well as the transition to a
       Krupp            13.9
                                                                                  successor product
                          17.5
     Porsche
                       12.7
                      13.5
         Ford
                   9.4
                  7.9
        Hilite
                  7.7
                 5.2
         PSA
                 5.7
                                                 52.5           Q1-Q3/2015
        Other
                                                  54.9          Q1-Q3/2016

                       International growth and diversified product range will lead to a
                                      more balanced customer structure
                                                                                                                 21
Business segment: Pumps and Engine Components

   Sales (€m)                    Sales by quarter (€m)                              > Sales decline as expected
                                                                                      by 13.6 per cent to € 245.4
          -13.6%
                                                                                      million
       284.0                92.5 85.9 98.2 84.7 93.3
               245.4                                         74.8 81.1
                                                                                    > Adj. EBITDA margin
                                                                                      improved from 9.1 per cent
                                                                                      to 11.1 per cent despite
      Q1-Q3/ Q1-Q3/             Q1           Q2            Q3           Q4            reduced sales
       2015   2016

   Adj. EBITDA (€m)               Adj. EBITDA by quarter (€m)                       > Considerably lower costs for
                                                                                      external processing,
          +4.5%              9.3 9.5       9.0 9.2                   9.2              finishing and expedited
        26.0   27.1                                     7.8 8.4
                                                                                      freight

        9.1%    11.1%
                             10.0% 11.1%   9.1% 10.9%   8.3% 11.2%   11.4%

       Q1-Q3/ Q1-Q3/            Q1           Q2           Q3           Q4
        2015   2016
                                                             2015            2016

                        Operational efficiency programme with positive effects
                                   on EBITDA and EBITDA margin
                                                                                                                     22
Business segment: Brake Discs

   Sales (€m)                       Sales by quarter (€m)
                                                                                  > Sales development mainly
                                                                                    influenced by lower sales of
         -10.3%
       74.4                 24.5          24.9 24.0 25.1                            one-piece brake discs. This
               66.8                20.7                     22.1 23.9
                                                                                    was not completely offset by
                                                                                    higher sales of composite
                                                                                    brake discs

      Q1-Q3/ Q1-Q3/            Q1            Q2          Q3           Q4          > Sales development further
       2015   2016                                                                  influenced by lower scrap
                                                                                    prices
   Adj. EBITDA (€m)                 Adj. EBITDA by quarter (€m)
                                                                                  > Positive product mix effects
         -15.7%
                                                                                    and disciplined
        7.8                                3.0         2.7 2.8
                  6.6
                             2.1                 2.2
                                                                                    implementation of
                                                                    2.1
                                   1.6                                              productivity measures partly
        10.5%     9.9%
                             8.7% 7.7%     11.9%9.0%   10.8%12.7%   8.3%            compensated lower capacity
                                                                                    utilisation
       Q1-Q3/ Q1-Q3/           Q1            Q2          Q3           Q4
        2015   2016
                                                            2015           2016

                         EBITDA margin close to target level of 10.0 per cent
                                                                                                                   23
Working capital ratio

                                                                          > Working capital increased
                                                                  14.1%     year-over-year by € 4.2
                                                                            million to € 58.7 million
                                                          12.3%
                                   11.7%
   11.3%
                   10.5% 10.4%                    10.6%                   > With 14.4 per cent, working
                                                                            capital ratio above previous
                                                                            year’s 11.7 per cent
           7.2%                            7.0%                           > Inventory built-up to ensure
                                                                            supply readiness

                                                                          > Reduced trade payables due
                                                                            to lower business volume
                                                                            and lower investments to
                                                                            date than 2015
   Q3/14   Q4/14   Q1/15   Q2/15   Q3/15   Q4/15 Q1/2016 Q2/16    Q3/16

             Medium-term target: 11%

                                                                                                           24
Investments and depreciation

   Investments (€m)                Investments by quarter (€m)                 > Investment ratio in Q1-
                                                                                 Q3/2016 on the same level
          -13.8%
                                        8.1                                      as previous year
       19.3                                               6.8
               16.7         6.2
                                  5.0         4.9   5.0          4.6           > Investments in Q4/2016
        5.4%    5.3%       5.3% 4.7%    6.6% 4.5%   4.2% 7.0%    4.4%
                                                                                 approx. between € 8 million
                                                                                 and € 11 million
      Q1-Q3/ Q1-Q3/           Q1          Q2          Q3           Q4
       2015   2016                                                             > Depreciation ratio increased
                                                                                 due to high investment
   Depreciation (€m)               Depreciation by quarter (€m)
                                                                                 levels in previous years
         +15.4%
                                  5.9         6.2   6.0 6.1      6.0
               12.2         5.0         5.5
        10.6

         4.6%    5.9%
                            4.3% 5.6%   4.5% 5.8%   5.1% 6.3%    5.7%

       Q1-Q3/ Q1-Q3/          Q1          Q2          Q3           Q4
        2015   2016
                                                          2015          2016

                                  Investments in 2016 / 2017 basis
                        for capital-efficient growth in the subsequent years
                                                                                                                25
Cash Flow

                                                           Q1-Q3/   Q1-Q3/
   (€m)1                               Q3 2016 Q3 2015
                                                            2016     2015
                                                                                     > Operating cash flow
   Cash flow from operating
                                                                                       positively impacted by higher
   activities                                3.2    4.8     2.9      18.0              depreciation and other non-
                                                                                       cash effective expenses and
   Cash flow from investing
   activities                                                                          income
   - tangible and intangible
      assets                                 -6.7   -5.0   -16.4    -21.6            > Operating cash flow
                                                                                       negatively impacted by lower
   Operating free cash flow                  -3.5   -0.1   -13.5     -3.6              net income for the period,
                                                                                       cash-effective changes in
   Cash flow from investing
   activities                                                                          inventories, receivables,
   - financial assets                        0.0    0.0     0.0      -8.9              other assets and liabilities
                                                                                       and a change in provisions
   Total free cash flow                      -3.5   -0.1   -13.5    -12.5

   Other (esp. capital
   increase/dividend payment)                0.0    -0.1    -6.6     17.9

   Change in net cash                        -3.6   -0.2   -16.5     5.5

  1 Figures   include rounding adjustments

                                              Strong focus on operating free cash flow in the future
                                                                                                                       26
Sound financial profile

               Assets                                    Liabilities                                     > Non-current assets
                                                                                                           decreased; depreciation
       242.8m               233.4m              242.8m                   233.4m
                                                                                                           above investments year-to-
                                                                                                           date

                                                113.3
                                                                                                         > Current assets decreased
       136.9                                                              119.5                            due to accounts receivable
                            133.5
                                                                                                           management and lower
                                                                                                           sales
                                                   27.7
                                                                           26.1
                                                                                                         > Short-term liabilities
                                                   14.7
                                                   10.8                                7.7                 influenced by lower sales
                                                                           11.4                            and comparatively low asset
       104.2                96.3                                                                           additions
                                                   76.4                    68.8
                                                                                                         > Equity ratio increased from
         1.7                 3.6                                                                           46.6 per cent to 51.2 per
                                           30.09.2015                   30.09.2016                         cent mainly triggered by net
     30.09.2015         30.09.2016
                                          Equity                          Bank debt
       Non-current assets                 Pensions                        Other short-term liabilities     period surpluses of the last
       Current assets
       Cash
                                          Other long-term liabilities
                                                                                                           12 months

                                     Sound balance sheet safeguards strategic flexibility
                                                                                                                                          27
Sales and earnings forecast for FY 2016 confirmed

 Guidance                                             2016
 Sales                                     approx. € 410 m to € 430 m

 thereof P&EC                               approx. € 320 m to 340 m
 thereof Brake Discs                             approx. € 90 m

 EBITDA                                          € 43 m to € 47 m

 Capex                            € 25 m to € 28 m (previously: € 32 m to € 35 m)

                                                                                    28
Disclaimer
No offer or investment recommendation
This document, which has been issued by SHW AG (the “Company” or “SHW”), does not constitute an offer to sell, or the solicitation of an offer to subscribe for or
buy, any shares in the Company, nor shall it or any part of it nor the fact of its distribution form the basis of, or be relied on in connection with, any contract or
investment decision in relation thereto.
The contents of this presentation are may not be reproduced, redistributed or passed on, directly or indirectly, to any other person or published, in whole or in part,
for any purpose. Neither the Company nor any other party is under any duty to update or inform you of any changes to such information. In particular, it should be
noted that financial information relating to the Company contained in this document has not been audited and in some cases is based on management information
and estimates.
This material is given in conjunction with an oral presentation and should not be taken out of context.
Certain market data and financial and other figures (including percentages) in this document were rounded in accordance with commercial principles. Figures
rounded may not in all cases add up to the stated totals or the statements made in the underlying sources. For the calculation of percentages used in the text, the
actual figures, rather than the commercially rounded figures, were used. Accordingly, in some cases, the percentages provided in the text may deviate from
percentages based on rounded figures.
Future Oriented Statements
Certain statements in this presentation are forward-looking statements. By their nature, forward-looking statements involve a number of risks, uncertainties and
assumptions that could cause actual results or events to differ materially from those expressed or implied by the forward‐looking statements. These risks,
uncertainties and assumptions could adversely affect the outcome and financial consequences of the plans and events described herein.
No obligation to update the information
The Company does not undertake any obligation to update or revise any forward-looking statements, whether as a result of new information, future events or
otherwise, except as otherwise required by applicable laws and regulations. You should not place undue reliance on forward-looking statements, which speak as
only of the date of this presentation. Statements contained in this presentation regarding past trends or events should not be taken as a representation that such
trends or events will continue in the future.

                                                                                                                                                                          29
You can also read