HALF-YEAR RESULTS PRESENTATION - December 2018 www.mitchellservices.com.au - Open Briefing
←
→
Page content transcription
If your browser does not render page correctly, please read the page content below
HALF-YEAR RESULTS
PRESENTATION
December 2018

                1   www.mitchellservices.com.au
DISCLAIMER

This investor presentation has been prepared by Mitchell Services Limited (“the Company”). Information in this presentation is of a general nature only and should be read in conjunction with the
Company’s other periodic and continuous disclosure announcements to the ASX, which are available at: www.asx.com.au.

This presentation contains statements, opinions, projections, forecasts and other material (“forward-looking statements”) with respect to the financial condition, business operations and competitive
landscape of the Company and certain plans for its future management. The words anticipate, believe, expect, project, forecast, estimate, likely, intend, should, could, may, target, plan and other similar
expressions are intended to identify forward-looking statements. Such forward-looking statements are not guarantees of future performance and include known and unknown risks, uncertainties,
assumptions and other important factors which are beyond the Company’s control and may cause actual results to differ from those expressed or implied in such statements. There can be no assurance
that actual outcomes will not differ materially from these statements. Any forward-looking statements contained in this document are qualified by this cautionary statement. The past performance of the
Company is not a guarantee of future performance. None of the Company, or its officers, employees, agents or any other person named in this presentation makes any representation, assurance or
guarantee as to the accuracy or likelihood of fulfilment of any forward-looking statements or any of the outcomes upon which they are based.

The information contained in this presentation does not take into account the investment objectives, financial situation or particular needs of any recipient and is not financial product advice. Before
making an investment decision, investors should consider their own needs and situation and, if necessary, seek independent professional advice.

Mitchell Services Limited’s financial statements comply with International Financial Reporting Standards (IFRS). This presentation may include certain non-IFRS performance measures including
EBITDA, EBIT, Gearing ratio, Gross Debt, Net Debt and Return on Invested Capital (ROIC). These measures are used internally by management to assess the performance of the business. Non-IFRS
measures have not been subject to audit or review and should not be considered as an alternative to an IFRS measure of profitability, financial performance or liquidity

To the maximum extent permitted by law, the Company and its directors and advisers of both give no warranty, representation or guarantee as to the accuracy, completeness or reliability of the
information contained in this presentation. Further, none of the Company, it officers, agents or employees of accepts, to the extent permitted by law, any liability for any loss, claim, damages, costs or
expenses arising from the use of this presentation or its contents or otherwise arising out of, or in connection with it. Any recipient of this presentation should independently satisfy themselves as to the
accuracy of all information contained herein.

                                                                                                       2                                                                    www.mitchellservices.com.au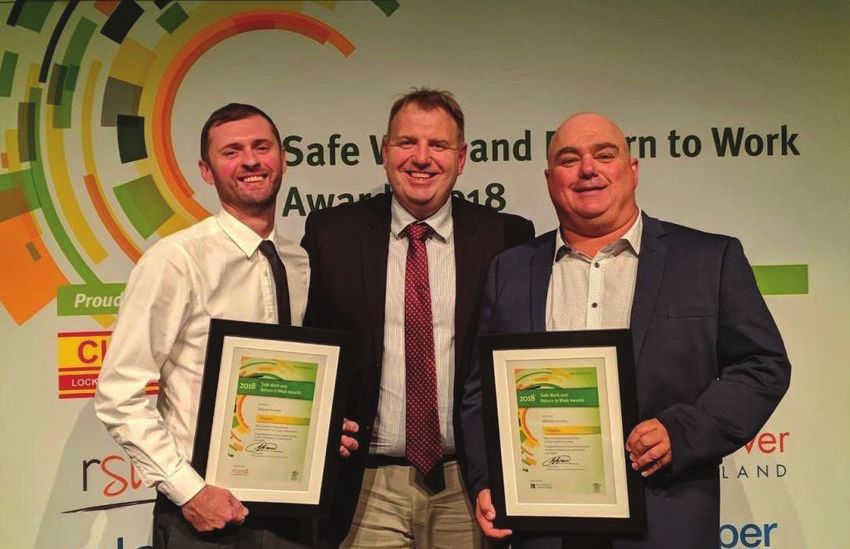
MITCHELL SERVICES MARKET PROFILE
                ASX Information                               Major Shareholders

Shares Issued (ASX:MSV)            1,738,673,346
                                                        Mitchell Group                      20.4%
Share Price (at 25/02/2019)        A$0.054
Market Capitalisation              A$93.9m              Washington H Soul Pattinson         9.9%
1H19 EBITDA                        A$14.0m
                                                        CVC Limited                         6.1%
Net Debt (at 31/12/2018)           A$2.6m

              Board of Directors                          Senior Management Team
                           Nathan Mitchell                               Andrew Elf
                           Executive Chairman                            Chief Executive Officer

                           Peter Miller                                  Greg Switala
                           Non-Executive Director                        CFO & Company Secretary

                           Robert Douglas                                Josh Bryant
                           Non-Executive Director                        GM People & Risk

                           Neal O’Connor                                 Todd Wild
                           Non-Executive Director                        GM Commercial

                                                    3                                 www.mitchellservices.com.au
SAFETY UPDATE
•   Finishing each day without harm is a core Mitchell Services
    value

•   Continued year on year reduction in recordable incident
    occurrence and severity

•   Focus on training to attract, retain and further develop our
    own drillers in an improving market

•   Mitchell Services’ safety culture was recognised during the
    year with the following major accolades:
      –     Winner 2018 Australian Mining Prospects Awards (Safety
            Advocate Award)
      –     Finalist 2018 Australian Mining Prospects Awards (Excellence in
            Mine Safety, OH&S)
      –     Finalist 2018 Safe Work and Return to Work QLD (Most
            Significant Improvement to Work Health and Safety Performance
            & Best Demonstrated Leadership in Work Health and Safety)

                                                                       4      www.mitchellservices.com.au
1H19 BUSINESS OVERVIEW

    Revenue of $63.29m            EBITDA of $14.23m            Net Debt of

   ↑   91%
        from 1H18
                              ↑   431%from 1H18
                                                         $2.6m
                                                       83% reduction from Dec 2017

Strong balance sheet
  provides flexibility            400+
                               experienced employees
                                                       Total recordable injury
                                                           frequency rate
                                                       continues to reduce

                                          5                        www.mitchellservices.com.au
IMPACT OF INCREASED UTILISATION ON REVENUE
                                          $72.70m
                                                                   •   Average operating
                                                       $63.29m         revenue per rig
                                                                       continues to increase
                                                                       due to improved
                                            2nd Half                   productivity and
                                                                       pricing
                           $40.30m
                                                                   •   Mitchell Services
            $32.97m
                                                        1st Half
                                                                       anticipates further
                             2nd Half
$25.17m                                                                increases in operating
             2nd Half
                                                                       rig count in calendar
 2nd Half                                   1st Half
                                                                       year 2019
                             1st Half
             1st Half                                              •   Operating rig count
 1st Half
                                                                       subject to change due
                                                                       to seasonality or other
  FY15       FY16             FY17           FY18       HY19           factors
  13.0        17.8            21.6           37.1        48.2
                                                                   •   64 rigs in fleet
                   Average Operating Rig Count

                                                 6                          www.mitchellservices.com.au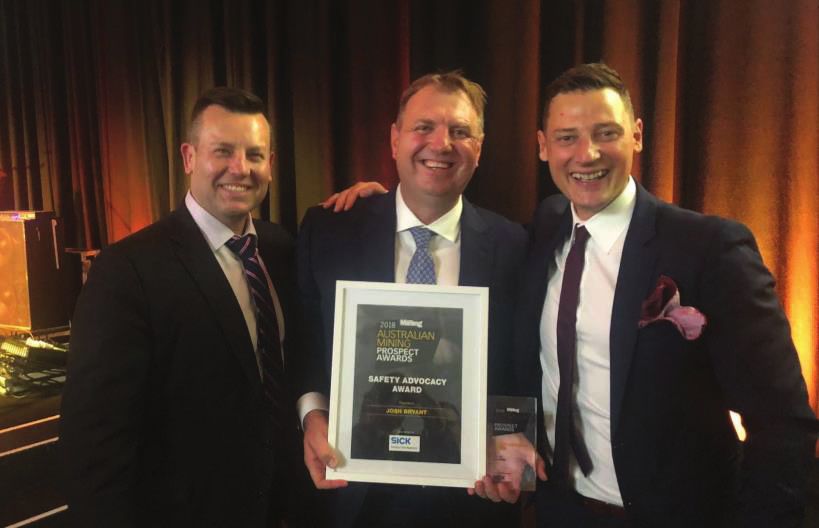
REVENUE DIVERSITY
                 Revenue by Commodity

1H19                 63.6%                   11.2% 14.7%
                                                                        • Demand for drilling services continues to
                                                                           strengthen across all commodities
1H18            52.9%                   20.0%         13.2% 9.4%

1H17            51.1%                      26.5%       7.2% 13.2%
                                                                        • Entry into the underground coal sector has
                                                                           driven the increase in coal and
       Coal   Gold       Copper    Lead/Zinc/Silver      Other
                                                                           underground as a percentage of revenue
                 Revenue by Drilling Type
                                                                        • Management and board remain mindful of
1H19                 60.8%                            38.0%
                                                                           revenue by commodity and drilling type
1H18                  66.7%                            31.9%

                                                                        • Pure play ASX listed drilling services
1H17                  67.0%                            31.6%
                                                                           provider
               Surface       Underground     Other

                                                                    7                                 www.mitchellservices.com.au
HIGH QUALITY REVENUE STREAMS
         Revenue by Client Type
                                                           •       Tier 1 Clients are large / multinational mining & energy
                                                                   companies

                                                           •       Tier 1 Clients generally operate long life, low cost mine sites

93.0%             88.9%                    91.3%
                                                           •       A majority of Mitchell Services revenue comes from Tier 1
                                                                   Clients at operating mine sites

                                                           •       Approximately 90% of revenue is at the mine site resource
7.0%              11.1%                    8.7%                    definition and development stage which is critical for ongoing
1H17               1H18                    1H19                    production
        Other Clients     Tier 1 Clients

                                                       Mine Lifecycle

 Greenfield Exploration                Mine Site Exploration
                                                                             Development                       Production
     & Feasibility                     & Resource Definition

                                                               8                                              www.mitchellservices.com.au
STAGES OF THE CYCLE
•   STAGE 1: UTILISATION INCREASES (THIS IS HAPPENING)
•   More rigs start working

•   STAGE 2: PRODUCTIVITY IMPROVES AS UTILISED RIGS WORK MORE SHIFTS (THIS IS HAPPENING)
•   Seasonality impact reduces as rigs work through the wet season
•   More rigs work 24 hours a day 7 days a week versus 12 hours a day (limited rigs in the surface coal sector work 24 hours a day)

•   STAGE 3: PRICE INCREASES AS SUPPLY AND DEMAND CHANGES IN FAVOUR OF SERVICE PROVIDERS
•   On average across a range of different drilling types prices are still circa 10% - 30% below the highs achieved during the last cycle (Large
    Diameter, Surface and Underground)
•   Prices for multi-rig multi-year contracts are increasing by high single or low double digit percentages

•   STAGE 4: GENERAL CONTRACT TERMS & CONDITIONS IMPROVE
•   Larger up front mobilisation charges to manage ramp up costs
•   Larger demobilisation charges
•   Take or pay contracts
•   More flexible pricing schedule of rates

                                Evidence suggests that we are in the early stages of Stage 3

                                                                        9                                                  www.mitchellservices.com.au
PROFIT AND LOSS
Unprecedented earnings growth
Profit & Loss
1H19 1H18 Change
$000's $000's %
• 431% improvement in EBITDA on pcp driven by
increased utilisation, quality operational delivery
Revenue 63,291 33,215 91%
EBITDA 14,229 2,678 431% and improving market conditions
EBIT 8,458 (374) 2,362%
NPBT 7,725 (1,195) 747%
• 1H19 EBITDA Margin 22% (up 179% on pcp)
NPAT 11,728 (1,195) 1,082%
EBITDA • 1H19 EBIT Margin 13% (up 1,287% on pcp)
$15m
$11m • NPAT greater than NPBT due to $4m tax credit
$7m 1st Half
following the recognition of a deferred tax asset
2nd Half pertaining to historical tax losses not previously
$3m
1st Half 1st Half recognised
2nd Half
($1m)
FY2017 FY2018 FY2019
10 www.mitchellservices.com.auBALANCE SHEET
Strong balance sheet provides flexibility
31 Dec 19 30 Jun 18 Change • Significant reduction in debt paid from operating cash
$000’s $000’s %
flow provides a solid foundation for future growth
Balance Sheet Summary
Current assets 23,779 27,519 (14%)
• ROIC of 24.3% driven by strong operating cash flows
Non-current assets 34,259 30,773 11%
and improved EBITDA margins, this highlights Mitchell
Total assets 58,038 58,292 (0%)
Services disciplined approach to capital deployment
Current liabilities 20,940 23,125 (9%)
Non-current liabilities 3,924 14,133 (72%)
Total liabilities 24,864 37,258 (33%) • EBITDA / Gross Debt (Operating Leverage Ratio) of
Net assets 33,174 21,034 58% 0.37 times is an 88% improvement on pcp of 3.12
times
Working Capital Summary
Receivables 16,120 17,609 (8%)
Prepayments & other assets 1,445 1,154 25% • Working capital requirements are traditionally lower in
Inventories 2,068 2,275 (9%) 1H versus 2H primarily due to seasonality
Trade & other payables (13,679) (13,164) 4%
Premium funding (690) (390) 77% • A $2.2m reduction in working capital requirements has
Working Capital Investment 5,264 7,484 (30%) contributed to a strong Cash Conversion Ratio
11 www.mitchellservices.com.auCASH FLOW
Improved operating cash flows and Cash Conversion Ratio
Operating Cash Flow Summary
1H19 1H18 Change $16m
$000's $000's %
$12m
Receipts from customers 63,807 28,741 122%
Payments to suppliers / employees (47,342) (30,174) 57% $8m 1st Half
Cash generated from operations 16,465 (1,433) 1,249%
Interest & other financing costs (671) (856) (22%) $4m
2nd Half
Income tax paid (484) - 100% 1st Half
- 2nd Half
Cash flow from operating activities 15,310 (2,289) 769% 1st Half
EBITDA 14,229 2,678 431%
($4m)
Cash Conversion Ratio 108% (85%) 226% FY2017 FY2018 FY2019
1H19 has seen the operating leverage within the business play out resulting in significantly improved
operating cash flows and Cash Conversion Ratio
12 www.mitchellservices.com.auNET DEBT
MSV can move forward with confidence and certainty
Net Debt Summary
31 Dec 18 30 Sep 18 30 Jun 18 • The $8.5m Shareholder Loans were repaid in full from
$000's $000's $000's operating cash flows approximately 18 months earlier
than the expiry date of July 2020 with no fees or
Equipment finance 6,490 7,425 8,358
Shareholder Loans - 8,500 8,500 penalties associated with the early repayment
Property Loan - - 2,700
Gross debt 6,490 15,925 19,558 • Gross debt at 31 December comprises entirely of
Cash on hand 3,925 4,432 1,864
traditional equipment finance facilities with short
Net debt 2,565 11,493 17,694
amortisation profiles
Equipment Finance Amortisation Profile
$7m • Mitchell Services is well funded to take advantage of
$6m
$5m potential growth opportunities and has access to these
$4m key debt facilities (undrawn at 31 Dec 18)
$3m
$2m – $9m working capital facility with NAB
$1m
- – $25m approved equipment finance facility with
Dec 18 Mar 19 Jun 19 Sep 19 Dec 19 Mar 20 Jun 20 Sep 20 Dec 20
NAB
Principle Balance Outstanding
13 www.mitchellservices.com.auCAPITAL EXPENDITURE
Higher level of growth Capex expected in 2H19
Maintenance Capex
$4m
$3m
2nd Half • 1H19 total Capex spend demonstrates the capital
discipline within the business
$2m
2nd Half 1st Half • Maintenance Capex typically trends in line with P&L
$1m 1st Half
1st Half
depreciation multiplied by utilisation percentages but
- may vary based on rig deployment levels
FY2017 FY2018 1H2019
Growth Capex • 1H19 total Capex was 84% of P&L depreciation and
$5m
was funded from operating cash flows
$4m 2nd Half
$3m
• Expect 2H19 total Capex to exceed 1H19 levels and
2nd Half be funded out of a combination of debt and operating
$2m
1st Half
cash flows
$1m
1st Half
1st Half
-
FY2017 FY2018 1H2019
14 www.mitchellservices.com.auOUTLOOK
• Pipeline of identified opportunities remains strong Revenue ($M)
and demand continues to increase for drilling $120m
services particularly from Tier 1 clients $100m
2nd Half
– At current conversion rates, rigs required $80m
exceed rigs available $60m
2nd Half
$40m
2nd Half 1st Half
• Mitchell Services expects to generate full year $20m 1st Half
1st Half
FY19 revenue of between $110m and $120m -
FY2017 FY2018 FY2019
• At full year forecast revenue levels Mitchell EBITDA ($M)
Services expects to generate full year FY19 $25m
EBITDA of approx. $21m to $23m with strong $20m
associated cash flows 2nd Half
$15m
$10m
• These forecast revenue and EBITDA levels take $5m
1st Half
2nd Half
into account expected utilisation levels from 1st Half 1st Half
- 2nd Half
existing contracts subject to normal operating
conditions. ($5m)
FY2017 FY2018 FY2019
15 www.mitchellservices.com.auCAPITAL MANAGEMENT
• Debt reduction was determined to be the most efficient use of
cash generated in 1H19 and has strengthened the balance sheet
creating a platform for further growth
• Mitchell Services will continue to invest in organic growth
opportunities where they meet internal investment hurdles
• The drilling industry is capital intensive and Mitchell Services will
maintain a strong balance sheet to provide flexibility
• With current Net Debt of approx. $2.6m, Mitchell Services is
implementing a number of capital management initiatives to
reward shareholders, and have announced an intended buy-
back of up to 10% of MSV’s ordinary shares. The Board is also
evaluating the quantum and timing of a special dividend payment
in the near future
• Mitchell Services may consider acquisition opportunities
where they fit within the Company’s growth profile, safety culture
and are earnings accretive to shareholders
16 www.mitchellservices.com.auSUMMARY
• Mitchell Services’ vision is to be Australia’s leading provider of
drilling services to the global exploration, mining and energy
industries
• Mitchell Services has a diversified revenue stream by different
drilling types and commodities
• Mitchell Services has a high quality client base with a majority
of work related to mine site operating expenditure not capital
expenditure
• Guidance range for FY19 Revenue and EBITDA of $110m-
$120m and $21m-$23m respectively.
• Actively putting capital management structures in place to
reward shareholders
• Maintain a strong balance sheet to provide flexibility to take
advantage of strategic opportunities
17 www.mitchellservices.com.auDEFINITIONS
Capex Capital expenditure
Cash Conversion Ratio The ratio of A to B; where A is the reported cash flows from operating activities and B is the reported EBITDA
Earnings before interest, tax, depreciation and amortisation; calculated as NPAT plus income tax expense plus finance charges plus
EBITDA
depreciation expense plus amortisation of intangibles
EBITDA Margin EBITDA divided by reported revenue expressed as a percentage
EBIT Earnings before interest and tax; calculated as NPAT plus income tax expense plus finance charges
EBIT Margin EBIT divided by reported revenue expressed as a percentage
Total principle balances outstanding on all bank loans, shareholder loans, equipment finance facilities, hire purchase agreements, working
Gross Debt
capital facilities and overdrafts
Net Debt Gross Debt less cash and cash equivalents on hand
NPAT Net profit after tax; calculated as statutory reported profit before income tax less income tax expense
NPBT Net profit before tax; calculated as NPAT plus income tax expense
Operating Leverage Ratio The ratio of A to B; where A is EBITDA on a 12 month rolling basis and B is Gross Debt at reporting date
pcp Previous corresponding period
$2.7m loan provided by National Australia Bank in April 2018 which was secured by Mitchell Services Limited’s investment property
Property Loan
located in Townsville
Return on invested capital; EBIT on a 12 month rolling basis divided by (net PP&E plus net intangibles plus trade and other receivables
ROIC
plus inventories less trade and other payables less cash on hand)
$8.5 million in loans that were provided in 2015 from major shareholders Washington. H. Soul Pattinson and Company Limited and
Shareholder Loans
Mitchell Family Investments (QLD) Pty Ltd
Publicly listed mining and energy companies with market capital over $1 billion or large multi-national private mining and energy
Tier 1 Clients
companies
18 www.mitchellservices.com.auYou can also read