BAHRAIN MARKET REVIEW 2019 - RESEARCH - Knight Frank
←
→
Page content transcription
If your browser does not render page correctly, please read the page content below
RESEARCH
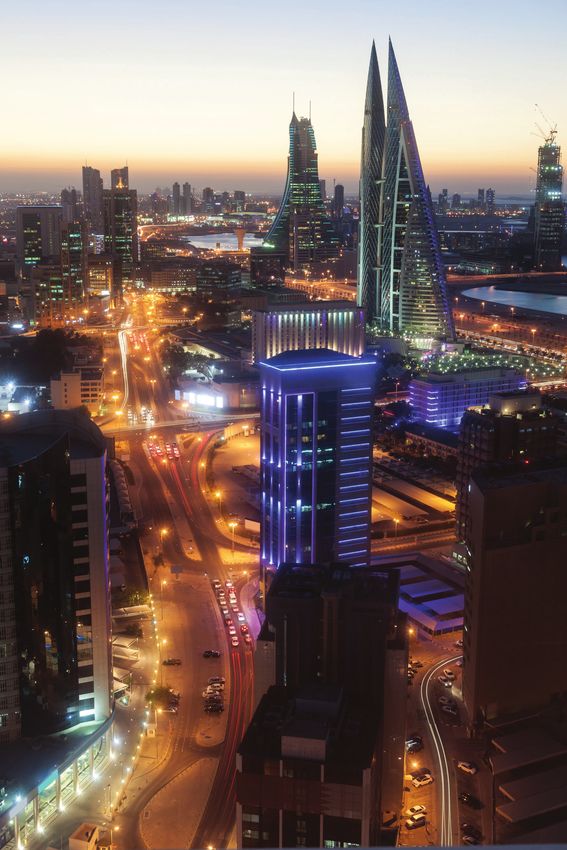
BAHRAIN
MARKET REVIEW 2019
9,5;(39(;,::;()030:,;/96
RESEARCH
BAHRAIN
MARKET REVIEW 2019
Key Ändings Macroeconomic overview
On the back of reforms, easing of Across the GCC nations a range of estimates expect Bahrain’s GDP growth
regulations, continued investment economic diversification efforts are rate to register at 2.6% in 2018, down
in large scale projects and higher starting to pay dividends, with sectors from 3.8% a year earlier.
oil prices, GDP growth is expected such as business and financial services,
strengthen to 2.8% and employment is Fintech, industrial and manufacturing Given the strong challenges the Kingdom
expected to expand by 2.5% in 2019. starting to become integral to regional faces, Kuwait, Saudi Arabia and the UAE
economies. stepped in to provide a US$10bn aid
package in late 2018. The money will
Over recent years Manama’s oɉce This pivot was required post 2014, support a new fiscal program designed
market has become favoured towards where the collapse in oil prices exposed to eliminate the country’s sizeable budget
tenants. As a result of the more tepid weaknesses in the economic structure deficit by 2022.
economic backdrop we have seen of many GCC countries. From 2011 to
subdued demand, with rents across 2014 the average annual GDP growth rate In addition to this, the government of
all market segments seeing signiÄcant of GCC nations stood at 5.0%; post the Bahrain has enacted a range of reforms
declines. In 2018 we have witnessed collapse, in the period from 2015 to 2018, to help ease the fiscal burden and help
rents remain relatively stable. we have seen average GDP growth slow diversify the economy. These reforms
to 2.2%. As most GCC nations relied on range from the implementation of Value
Bahrain’s hospitality sector has revenues from the hydrocarbon sector as Added Tax (VAT) at 5%, public sector
traditionally attracted regional GCC the main source of funds for government reforms to reduce the wage bill burden,
visitation, particularly from Saudi Arabia spending, the resulting impact on long-term investor visas and legal reforms
via the King Fahd Causeway. As a result spending and debt to GDP ratios has to help reduce the cost of doing business.
of Bahrain’s overnight stay sources, been profound.
its hospitality market has historically
had challenges in relation to driving This has been the case for Bahrain more Outlook
occupancy rates. so than any other GCC nation, where the
On the back of these reforms, easing
gross general government debt increased
of regulations, continued investment in
Looking ahead we may begin to see from 44% of GDP in 2014 to an estimated
large-scale projects and higher oil prices,
international visitation from outside 88% in 2018. More so, as a result of this
GDP growth looks set to strengthen to
the region increase as the country’s indebtedness raising additional debt has
2.8% and employment is expected to
national airline expands its network become more challenging. These factors
expand by 2.5% in 2019. Additionally,
alongside Bahrain International Airport’s have had a marked impact on economic
the fiscal situation is likely to improve
expansion. activity, with GDP growth expected
given the introduction of VAT alongside
to have slowed again in 2018. Initial
FIGURE 1
Economic indicators
6.0%
5.0%
4.0%
3.0%
2.0%
MATTHEW DADD 1.0%
Partner, Occupier Services and 0.0%
Commercial Agency -1.0%
-2.0%
“Bahrain continues to be an
-3.0%
attractive and cost eќective
-4.0%
location for Ärms looking to
2013
2014
2015
2016
2017
YoY Q3 2018
2019 (F)
Q2 2017
Q3 2017
Q4 2017
Q1 2018
Q2 2018
2019 (F)
JUNE 2018
JULY 2018
AUGUST 2018
SEPTEMBER 2018
OCTOBER 2018
NOVEMBER 2018
DECEMBER 2018
Q1 2017
Q2 2017
Q3 2017
Q4 2017
Q1 2018
Q2 2018
Q3 2018
Q4 2018
setup a base in the GCC.
Particularly as the region’s
largest economy, Saudi Arabia
continues to open up, Bahrain GDP, YEAR-ON-YEAR EMPLOYMENT, CPI, YEAR-ON-YEAR POLICY RATES
will increasingly be considered % CHANGE (CONSTANT PRICES) YEAR-ON-YEAR % CHANGE % CHANGE
as a hub location given its Total
Private sector
Bahrain, CBB Key Policy Rate
United States,
direct access to Saudi Arabia.” Public sector Federal Funds Target Rate
Source: Knight Frank Research
Please refer to the important notice
at the end of this report.
BAHRAIN MARKET REVIEW 2019

fiscal consolidations. Finally, whilst the                       a business, dealing with construction
introduction of VAT is likely to increase the                    permits, registering property, trading
rate of inflation, we do not expect this to                      across borders and getting electricity are
be a substantial increase given the relative                     all areas in which Bahrain scored well.
consumer friendliness of the VAT regime in                       With the broad range of reforms enacted
Bahrain compared to other GCC nations.                           in 2018, we expect Bahrain’s ranking to
                                                                 continue its ascent.

                                                                 The main areas where Bahrain must
Regional competitiveness                                         continue to develop in the future are the
Bahrain continues to be an attractive                            areas of resolving insolvency, getting
location for firms looking to setup a base                       credit and enforcing contracts – the World
in the GCC. Particularly as the region’s                         Bank has highlighted that performance in
largest economy, Saudi Arabia, continues                         most of these areas has already begun to
to open up. Bahrain will increasingly be                         improve since 2016.
considered as a hub location given its
                                                                 Finally, the island is a firm favourite with
direct access to Saudi Arabia via the King
                                                                 expats, with the Expat Insider’s 2018
Fahd causeway.
                                                                 survey ranking it as the best place to live
International firms are attracted                                and work for the second year in a row.
by Bahrain’s favourable business
environment, which offers effective
regulations, lack of Free Zone restrictions                                                                                            TAIMUR KHAN
alongside a favourable tax regime.                                                                                                     Research Manager

Figure 2 highlights the competitiveness                                                                                                “The introduction of VAT is likely
of doing business in Bahrain, where in
                                                                                                                                        to increase the rate of inÅation,
the World Bank’s Ease of Doing Business
rankings Bahrain ranks 62nd out of 190
                                                                                                                                        however we do not expect this
countries, up from 66th in 2018. Bahrain’s                                                                                              to be a substantial increase given
trading across borders and protecting                                                                                                   the relative consumer friendliness
minority investors scores have also                                                                                                     of the VAT regime in Bahrain
improved over the last year. Starting                                                                                                   compared to other GCC nations.”

FIGURE 2                                                                                              FIGURE 3
Ease Of Doing Business: Distance To Frontier Score 2019                                               GCC Countries, Ease of Doing Business Rank

                                                                                                                                2015      2016     2017       2018            2019

                                     Overall DTF, total

                                     100%
                                                                                                                                32         34       26            21          11
Trading Across Borders, DTF                                Dealing with Cinstruction Permits, DTF
                                                                                                              UAE
                                      80%

                                      60%
Starting A Business, DTF
                                                                        Enforcing Contracts, DTF
                                                                                                                                61         66       63            66           62
                                      40%
                                                                                                            Bahrain
                                      20%

                                       0%                                                                                      100         98      102            96           97
                                                                              Getting Credits, DTF
Resolving Insolvency, DTF                                                                                    Kuwait

                                                                                                                                77         69       66            71           78
                                                                                                             Oman
Registering Property, DTF                                                  Getting Electricity, DTF

                                                                                                                                84         96       94            92           92
Protecting Minority Investors, DTF                        Paying Taxes, DTF
                                                                                                          Saudi Arabia

Source: Knight Frank Research                                         2018                2019        Source: Knight Frank Research                 2015   2016        2017   2018   2019
BAHRAIN MARKET REVIEW 2019
Real Estate market overview
Commercial
Bahrain’s commercial office market Demand for commercial office space Using KPMG’s cost of doing business in
continues to be dominated by weak continues to be limited and largely centred Bahrain (Financial Services) 2018 report
occupier demand coupled with on small, fitted out units as tenants look it can be seen that on a total costs basis,
oversupply, a legacy of the 2001 to 2007 to avoid cap expenditure. This trend has when looking to accommodate one CXO,
construction boom. This supply-demand been prevalent for the past seven years two Heads of Department, two Directors,
imbalance has endured since 2010 when and looks set to remain in the short to five Managers and 10 Analysts, Bahrain
the full effects of the global economic medium term. is 35% cheaper than Abu Dhabi Global
downturn hit Bahrain. Market (ADGM) and Dubai International
Vacancy rates across the market continue
Financial Centre (DIFC). Commercial
Starting in 2010, Manama’s office market to hover around the 40% mark with best
rents for accommodating these 20
become increasingly favourable to in class schemes commanding better
employees are 60% and 61% lower in
tenants with headline rental rates falling occupancy levels. Conversely, older
Bahrain compared to ADGM and DIFC
by circa 45% to 50% from the peak in buildings with inefficient floorplates and
respectively (Figure 6).
2008. However, 2018 saw the market poor parking arrangements look set to
stabilise with rent falls abating, a sign that suffer from lower occupancy levels and Whilst the market has shown signs of
the market has bottomed out, though it higher falls in rental rate. stabilisation throughout 2018, this has
remains to be seen when rental growth come as a result of dramatic falls in
As a result of these market conditions
will return to the market due to the rental rates. This stability looks set to
and the lower cost of doing business in
elasticity of the supply pipeline. continue in the short to medium term
Bahrain when compared to other regional
though it is unlikely to translate into rising
As a result of the economic backdrop, financial centres, the Kingdom is well
rents or capital values in the foreseeable
the rate of completions has slowed placed to take advantage of new entrants
future as the market struggles to absorb
dramatically since 2014 which has to the market that are seeking access to
existing stock.
avoided any compounding effect of the the GCC.
supply-demand imbalance.
FIGURE 4 FIGURE 5
Key Market Indicators Bahrain, Indicative Office Rents
10.00
Market Sentiment
Prime Rents: 8 BHD/ Month/ Sqm 8.00
BHD/Month/SQM
6.00
Grade A Rents: 6 BHD/ Month/ Sqm
4.00
Grade B Rents: 3.5 BHD/ Month/ Sqm
2.00
Vacancy: 40%
-
Al Seef Bahrain Financial Harbour Diplomatic Area Bahrain Bay
Source: Knight Frank Research Average Low High
FIGURE 6
Average annual cost of operations in USD (2018)
3,000,000 250,000
2,500,000
200,000
“Commercial rents are
2,000,000
60% and 61% lower
in Bahrain compared
150,000
1,500,000
1,000,000
100,000
to ADGM and DIFC
500,000
50,000 respectively.”
- -
BAHRAIN DIFC ADGM
Source: KPMG Cost of doing business in Bahrain, 2018 Total cost Commercial rent (RHS)
BAHRAIN MARKET REVIEW 2019
Hospitality
Bahrain’s hospitality sector has Due to the nature of visitation in Bahrain, demand has been impacted by the rift
traditionally attracted regional GCC the hospitality market has historically had between Qatar and Bahrain (among other
visitation, particularly from Saudi Arabia challenges in relation to driving occupancy nations). More so, in the medium to long
via the King Fahd Causeway. From an rates. Over recent years we have seen term we expect demand will be further
international perspective, demand has average occupancy decline from 56% impacted as entertainment led destinations
largely been attributable to corporate in 2014 to 52% in 2018. Over the same are delivered in Saudi Arabia.
visitation and the Bahrain Grand Prix, period, ADR and RevPAR decreased by
As of year-end 2018, Manama’s hospitality
which is the largest inbound demand 23% and 28% respectively.
supply consisted of 13,000 keys (11,000
generator in the Kingdom. Looking This softening in key performance hotel keys and 2,000 serviced apartment
ahead we may begin to see international indicators (KPIs) was attributable to falling keys) primarily composed of 4 and 5 star
visitation from outside the region increase oil prices which not only impacted the hotels which account for 40% and 39%
as the country’s national airline expands domestic market, but also the wider gulf of the total room supply respectively.
its network and improvement works are economies, which in turn has resulted
completed at Bahrain International Airport. Looking towards the future, 3,300 keys
in subdued corporate demand. Leisure
have been announced to come online
FIGURE 7 by the end of 2022. This represents a
Key Performance Indicators supply increase of approximately 25%.
As more quality internationally branded
properties enter the market, we expect
locally operated and less centrally located
properties will ultimately lose
market share.
The short to medium term outlook for the
market remains subdued as a result of
additional supply scheduled to enter the
market and the implementation of VAT
which is likely to create further pressure
on KPIs. The expansion of supply, where
the total key count is expected to grow
25% by 2022, is likely to impact the top
end of the market most given that the
2015 2016 2017 2018 vast majority of additional keys set to be
delivered are in either the 4-star or 5-star
Source: Knight Frank Research/ STR Global ADR Year-on-Year % Change Occupancy (RHS) RevPAR Year-on-Year % Change
segment of the market.
FIGURE 8 FIGURE 9
Trading performance by GCC City - 2018 RevPAR seasonality - 2018
JEDDAH
KUWAIT CITY
RIYADH
Deviation
DUBAI
MANAMA
MAKKAH
MUSCAT RAS AL KHAIMAH
ADR (USD)
MEDINA
ABU DHABI
AL KHOBAR/ FUJAIRAH
DAMMAM
DOHA SHARJAH
Occupancy (%)
JAN
FEB
MAR
APR
MAY
JUN
JUL
AUG
SEP
OCT
NOV
DEC
Source: Knight Frank Research/ STR Global Source: Knight Frank Research/ STR Global Bahrain Manama
Demand generators
Bahrain is considered to be a well- the economy and promote the location as The expansion of supply, where there
regarded leisure destination and Manama a credible tourist and leisure destination, are several key tourism related projects
has been established as a trading outpost it will be able to drive demand beyond its that have already been completed, are
for the Middle East since the early 1970’s. traditional base. highlighted in figure 10.
As the government continues to diversify
RESEARCH
Taimur Khan
Research Manager
+971 56 4202 312
FIGURE 10 taimur.khan@knightfrank.com
Bahrain’s key demand generators
KINGDOM OF BAHRAIN
Moda Mall Bahrain National
Museum
Stefan Burch, MRICS
Bahrain World
Trade Center The Partner
Avenues Mall
Dive Park +966 53 0893 297
Bahrain
Arad Fort stefan.burch@me.knightfrank.com
Financial Al Fateh Grand
District Mosque
Seef Mall OCCUPIER SERVICES &
Bahrain
COMMERCIAL AGENCY
Prince Khalifa
Qalat Al Bin Salman Park Matthew Dadd, MRICS
Bahrain
Partner
+971 56 6146 087
matthew.dadd@me.knightfrank.com
Manama HOSPITALITY & LEISURE
Al Dar Islands
Bahrain
Ali Manzoor
Partner
+971 56 4202 314
A’Ali Royal
Burial Mounds ali.manzoor@me.knightfrank.com
Bahrain International
Circuit VALUATION & ADVISORY SERVICES
Lost Paradise of
Stephen Flanagan, MRICS
Tree of Life
Dilmun Water Park Partner
+971 50 8133 402
stephen.flanagan@me.knightfrank.com
Hawar Islands CAPITAL MARKETS / INVESTMENT
Joseph Morris, MRICS
Partner
+971 50 5036 351
joseph.morris@me.knightfrank.com
MEDIA & MARKETING
Nicola Milton
Source: Knight Frank Research Head of Middle East Marketing
+971 56 6116 368
nicola.milton@me.knightfrank.com
RECENT MARKET-LEADING RESEARCH PUBLICATIONS
COMMERCIAL RESEARCH COMMERCIAL RESEARCH
RESEARCH RESEARCH
SAUDI ARABIA OFFICE DUBAI OFFICE
MARKET REVIEW 2018 MARKET REVIEW Q3 2018
2L`ÄUKPUNZ >OPSZ[[OLYLOH]LILLUHU\TILYVMUV[HISLJVTTLYJPHSVɉJL 2L`ÄUKPUNZ Due to increasing supply and a slowdown in new market entrants,
In Saudi Arabia, market wide rents and transactions throughout 2018, as key occupiers both from the public (]LYHNLVɉJLYLU[ZHJYVZZ+\IHP +\IHP»ZVɉJLTHYRL[WLYMVYTHUJLJVU[PU\LZ[VZVM[LUPU ;OPZOHZ
occupancy levels have been under and private sector look to expand or move to upgraded premises, the ZVM[LULKI`
`LHYVU`LHY[V8 JYLH[LKHUVWWVY[\UP[`MVYL_PZ[PUNVJJ\WPLYZ^OVHYLSVVRPUN[V[HRL
pressure since 2016, with the trend market continues to be dominated by a lack of Grade A stock and a HK]HU[HNLVMMH]V\YHISLTHYRL[JVUKP[PVUZ
continuing into 2018 amid increasing large supply pipeline.
levels of supply and subdued occupier 7YPTLVɉJLYLU[ZPU8 YLNPZ[LYLK
demand. H[(,+
ZXM[WHKV^U PU
Macroeconomic overview
In terms of performance, market wide be expected to rise placing downward [OL`LHY[V8 +\IHP»Z.+7NYL^ PU
KV^U OPSZ[KLTHUKOHZILLUZ\IK\LKPU OH]LZLLU[OLYH[LVMNYV^[OZSV^PU
in business sentiment in 2018, on the persist over the long term. ZOV^Z[OH[LTWSV`TLU[MLSSZSPNO[S`PU
back of higher oil prices, this has yet start feeding through the wider economy, HM[LYHZ[YVUNZ[HY[[V[OL`LHY 6UHTVYLWVZP[P]LUV[LHSSZLJ[VYZIHY
:LW[LTILY4VYLZVJVUZ\TLYKLTHUK
to result in an increase in demand for Against the backdrop of a highly elastic translating into an acceleration of growth ^LILSPL]L[OH[K\L[V[OLLHZPUNVM MPUHUJPHSHUKPUZ\YHUJLHJ[P]P[PLZ^OPJO
YLTHPUZ^LHR^P[O[OLZLSSPUNWYPJLPU
VɉJLHJJVTTVKH[PVUHJYVZZTHQVY supply dynamic, we see rents for Grade in the non-oil private sector. YLN\SH[PVUZMYLLaPUNVMNV]LYUTLU[ YLNPZ[LYLKHMSH[NYV^[OYH[LOH]LNYV^U
+\IHP»ZWYP]H[LZLJ[VYKLJSPUPUNMVY[OL
cities. B assets softening further in the short MLLZLJVUVTPJZ[PT\S\ZWHJRHNLZHUK V]LY[OL`LHY
Moreover, the implementation of various MPM[OJVUZLJ\[P]LTVU[O[OPZPZKLZWP[L
[LYT^OLYLI\PSKPUNZ[OH[Z\ɈLYMYVTWVVY JVU[PU\LKPU[YVK\J[PVUVMK\HSSPJLUJPUN
urban regeneration initiatives including PU-YLLAVULZKLTHUKPZSPRLS`[V[PJR ;OLV\[SVVRMVY+\IHP»Z.+7PU YPZPUNPUW\[JVZ[ZZ\NNLZ[PUNMPYTZHYL
Long term demand drivers include: an accessibility and parking arrangements
mixed use communities and large scale \WV]LY[OLZOVY[[LYT[VTLKP\T[LYT YLTHPUZWVZP[P]LVU[OLIHJRVMHZ[YVUN OH]PUN[VJ\[THYNPUZPUVYKLY[VZ\WWVY[
acceleration of growth in the non- will struggle for occupancy.
infrastructure projects, is expected to act NSVIHSNYV^[OMVYLJHZ[I`[OL04- KLTHUK
oil sector, an increasingly attractive Although we have seen an improvement as a catalyst for the real estate market. ^OPJOZ[HUKH[
MVYIV[O HUK
business environment for global in business sentiment in 2018, we believe -\Y[OLYTVYL^OPSZ[+\IHPPZUV[
6]LYHSS[OLYLPZJH\[PV\ZVW[PTPZTMVY
occupiers and the implementation of Furthermore, it is expected that the +\IHP»ZLJVUVT`^P[O.+7NYV^[O
that any increase in demand will remain LMMLJ[LKHZHK]LYZLS`I`HZSV^KV^U
various urban regeneration initiatives. planned wave of privatisation will boost MVYLJHZ[H[
HUKLTWSV`TLU[NYV^[O
subdued in the short term, with rents and PU[OLYLNPVUHSO`KYVJHYIVUZLJ[VYK\L
investment and foster growth in the MVYLJHZ[[VPUJYLHZLI`
PU \W
occupancy likely to remain under pressure [VP[ZKP]LYZPMPLKLJVUVTPJZ[Y\J[\YL
business environment creating favourable MYVT
PU
;OLHUUV\UJLTLU[VM
as increased demand will be met with [OLZSV^KV^UOHZPTWHJ[LKHUJPSSHY`
JVUKP[PVUZMVY[OLVɉJLZLJ[VY HOVZ[VMJOHUNLZ[VLHZLPU]LZ[TLU[HUK
new supply. Vacancy rates can therefore I\ZPULZZLZ^OPJOZLY]PJL[OPZZLJ[VY
YLZPKLUJ`SH^ZHSVUNZPKLIYVHKYHUNPUN
MYVT+\IHPNP]LUP[ZYLNPVUHSO\IHUK
Z[PT\S\ZWHJRHNLZ^PSSWYV]PKLM\Y[OLY
SLHKPUNMPUHUJPHSJLU[YLZ[H[\Z;OLYLMVYL
Z\WWVY[[V[OLZLMVYLJHZ[Z
FIGURE 1 [OLPUJYLHZLPUVPSWYPJLZ[VHUH]LYHNLVM
Selected NTP targets in relation with the real estate sector
You can also read