Modeling the 2011 Tohoku-oki Tsunami and its Impacts on Hawaii
←
→
Page content transcription
If your browser does not render page correctly, please read the page content below
Modeling the 2011 Tohoku-oki Tsunami and its
                     Impacts on Hawaii
                             Yoshiki Yamazaki1, Volker Roeber1, Kwok Fai Cheung1, and Thorne Lay2
                                            1
                                             Department of Ocean and Resources Engineering
                                                    University of Hawai’i at Manoa
                                                    Honolulu, Hawaii, 96822 USA
                                                2
                                                Department of Earth and Planetary Sciences
                                                   University of California Santa Cruz
                                                   Santa Cruz, California, 95064 USA

Abstract—The 2011 Tohoku-oki great earthquake (Mw 9.0)                    Recent advances in seismic inversion algorithms [1], [2]
generated a destructive tsunami in the near field that devastated     enable accurate descriptions of dislocation rise time and rupture
the Pacific coast of northeastern Japan. The tsunami, which           propagation over the source fault model. These can be used to
reached Hawaii 7 hours after the earthquake, caused localized         calculate time series of the seafloor vertical displacement and
damage and persistent coastal oscillations across the island chain.
                                                                      velocity that constitute the bottom boundary condition for
We use the shock-capturing, dispersive wave model NEOWAVE
(Non-hydrostatic Evolution of Ocean WAVEs) to reconstruct the         modeling transfer of kinetic and potential energy to the water.
tsunami across the Pacific and its transformation around the          It is timely for a paradigm shift in tsunami modeling that
Hawaiian Islands. A finite-source model based on inversion of         parallels the advances in geophysics. NEOWAVE [3], [4]
teleseismic P waves provides the detailed rupture processes for       builds on the nonlinear shallow-water equations with a vertical
modeling of seafloor deformation and tsunami generation. The          velocity term to account for dispersion in tsunami generation
computed results are validated with surface elevations recorded       and propagation and a momentum conservation scheme to
at GPS and wave gauges along the East Japan coast, DART               describe flow discontinuities associated with breaking waves
buoys across North Pacific, and tide gauge and runup                  and bores. The vertical velocity term also facilitates modeling
measurements at Hawaii. The model results corroborate the
                                                                      of tsunami generation from seafloor deformation to account for
impact and damage observed in Hawaii that might be attributed
to focusing of energy by seamounts and regional and coastal           the earthquake rupture process. This semi-implicit, finite
resonance.                                                            difference model in the spherical coordinate system uses a two-
                                                                      way grid nesting scheme to describe tsunami generation, basin-
   Keywords: dispersive wave; Hawaii; inundation; NEOWAVE;            wide evolution, and coastal inundation in a single computation.
runup; The 2011 Tohoku-oki earthquake and tsunami.
                                                                          In this paper, we utilize a finite-source rupture model of the
                                                                      2011 Tohoku-oki earthquake for modeling the tsunami in the
                        I.     INTRODUCTION                           near and far-field. The finite-souce model is a slightly updated
    The Tohoku-oki great earthquake (seismic moment                   version of early models [5, 6] obtained from least-squares
magnitude, MW = 9.0) ruptured the megathrust fault offshore of        inversion of teleseismic P waves. It defines the rupture
Miyagi and Fukushima in Northeastern Honshu on March 11,              processes and the seafloor deformation for input to
2011, and generated strong shaking across the region and a            NEOWAVE. The finite-source solution is validated by
devastating near-field tsunami with run-up heights reaching in        comparing observed and calculated GPS ground motion data
excess of 40 m. The tsunami, which registered 6.0 m amplitude         across Japan as well as tsunami records at GPS and wave
at a coastal GPS buoy and 1.75 m at an open-ocean DART                gauges along the Japan coast and DART buoys across the
buoy, triggered warnings across the Pacific. The waves, which         Pacific. Four levels of two-way nested grids capture tsunami
reached Hawaii 7 hours after the earthquake, damaged boats
                                                                      evolution processes of different time and spatial scales for
and harbor infrastructure and inundated the west shore of
                                                                      investigation of coastal wave impacts around the Hawaiian
Hawaii Island. The extensive global seismic networks, the
dense geodetic instruments, the numerous water level stations,        Islands. Fringing reefs, which are present along 70% of Hawaii
video footage and post-event surveys across the Pacific provide       coastlines [7], have been a challenge to various types of coastal
the best quality datasets and coverage of any earthquake and          wave models. Modeling the tsunami inundation along Hawaii
tsunami to date for scientific research and emergency                 coastlines allows validation of the model capability to predict
management.                                                           tsunami impacts in tropical island environments.

   National Oceanic and Atmospheric Administration (NOAA)
   University of Hawaii Sea Grant College Program,
    School of Ocean and Earth Science and Technology (SOEST)
   Hawaii State Civil Defense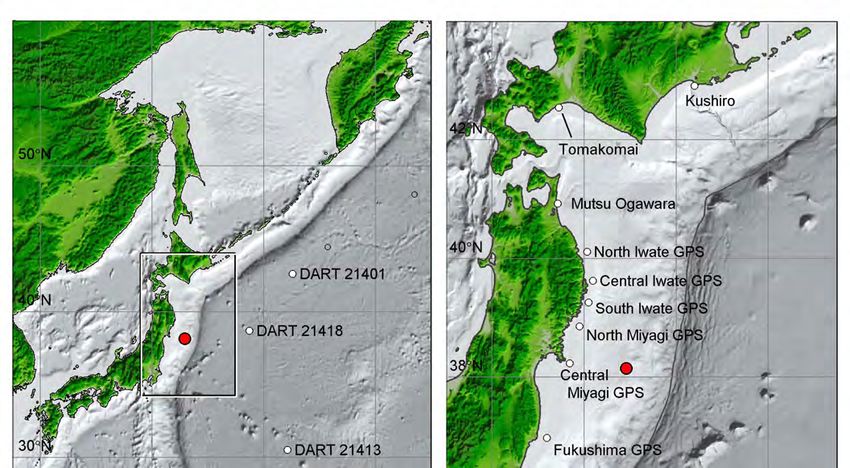
Figure 1. The two levels of nested grid for modeling near-field tsunami; ○ (red), epicenter; ○ (white), water level stations.
hydraulic processes over a complex reef system in the Tsunami
II. TSUNAMI MODEL AND SETUP Wave Basin at Oregon State University.
We utilize two systems of nested grids to model the near
NEOWAVE is a shock-capturing, dispersive wave model in and far-field tsunami impacts. The two levels of nested grid as
the spherical coordinate system for tsunami generation, basin-
shown in Figure 1 model the near-field tsunami. The level-1
wide evolution and coastal run-up [3], [4]. The depth-integrated
grid, which extends across the Northwest Pacific Ocean at 2’
model describes dispersive waves through the non-hydrostatic
pressure and vertical velocity, which also account for tsunami resolution, covers the entire Japan-Kurils-Kamchatka trench as
generation from time history of seafloor deformation. The well as three DART buoys near Japan. The level-2 grid
semi-implicit, staggered finite difference model captures flow resolves the continental margin and the rupture and tsunami
discontinuities associated with bores or hydraulic jumps generation processes in East Japan at 24". The resolution is
through the momentum-conserved advection scheme. A two- adequate, but not optimal, to model the tsunamis at the GPS
way grid-nesting scheme utilizes the Dirichlet condition of the and wave gauges near the coast. Four levels of nested grids are
non-hydrostatic pressure and both the horizontal velocity and necessary to describe the propagation of the tsunami across the
surface elevation at the inter-grid boundary to ensure Pacific and inundation at the coastlines in Hawaii. Figure 2a
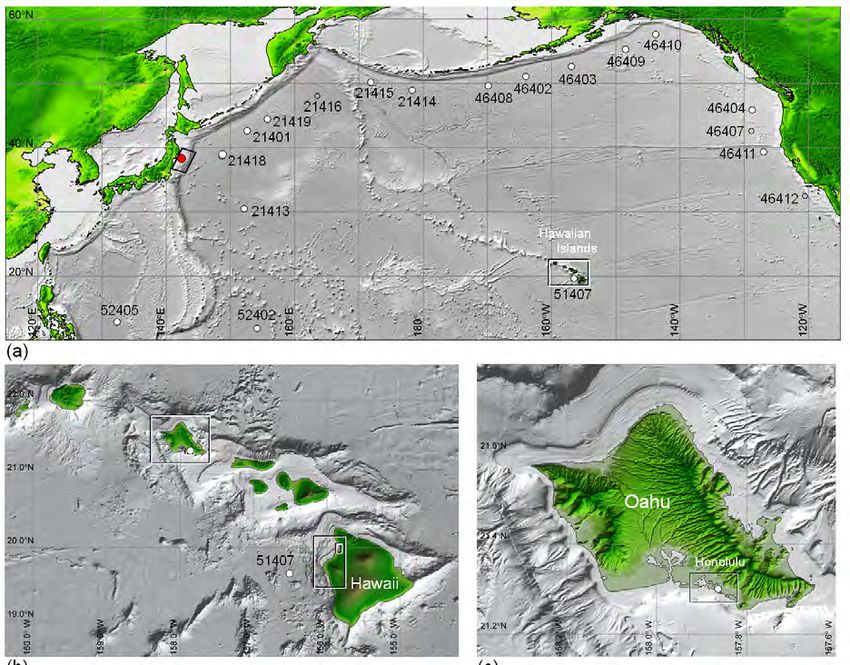
propagation of dispersive waves and discontinuities across shows the coverage of the level-1 grid across the north Pacific
computational grids of different resolution. The capability of Ocean at 2’ resolution. The region includes 16 DART buoys
NEOWAVE in describing shock-related hydraulic processes that recorded clear signals of the tsunami. The level-2 and
was validated at the 2009 Benchmark Challenge of the level-3 grids describe tsunami transformation around the
Inundation Science and Engineering Cooperative Workshop Hawaiian Island chain and the individual islands at 15" and 3"
sponsored by the National Science Foundation. The model resolution, respectively (Figure 2b,c) . The level-4 grid covers
correctly reproduces the energetic breaking waves and the coastal area at 0.3” resolution to model nearshore wave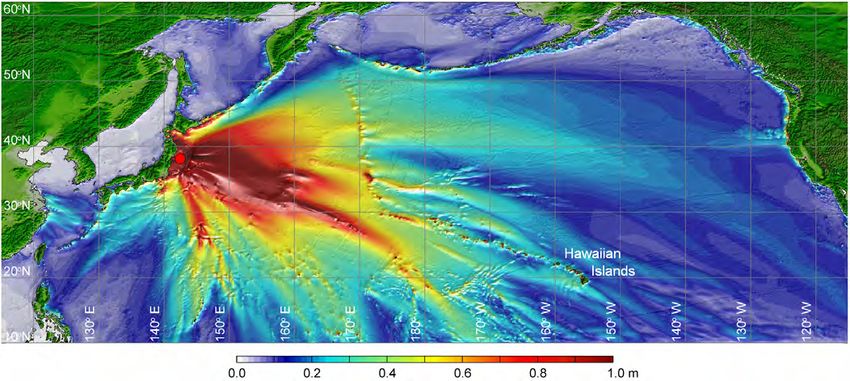
Figure 2. The four levels of nested grid for modeling tsunami impact on Hawaii; ○ (red), epicenter; ○ (white), water level stations.

transformation and inundation on land (Figure 2d,e,f) .                         referenced at mean-sea level. The National Geophysical Data
Fringing reefs, which comprise a shallow flat and a steep                       Center (NGDC) Global Relief Model ETOPO1 at 1’ (1852-m)
offshore slope, are evident along the coastlines.                               resolution provides the topography and bathymetry for the
                                                                                North Pacific basin. The Japan Meteorological Agency
     Modeling tsunami observations requires accurate
                                                                                supplied the bathymetry around Japan at 20" (~600-m)
bathymetry over the ocean and high-resolution topography near
                                                                                resolution. A multi-beam survey dataset at 50-m resolution
the coast. We have compiled a digital elevation model with the
                                                                                from the University of Hawaii is incorporated into the NGDC
latest bathymetry and topography in WGS 84 datum and
                                                                                Coastal Relief Model of 3" (~90-m) resolution to define the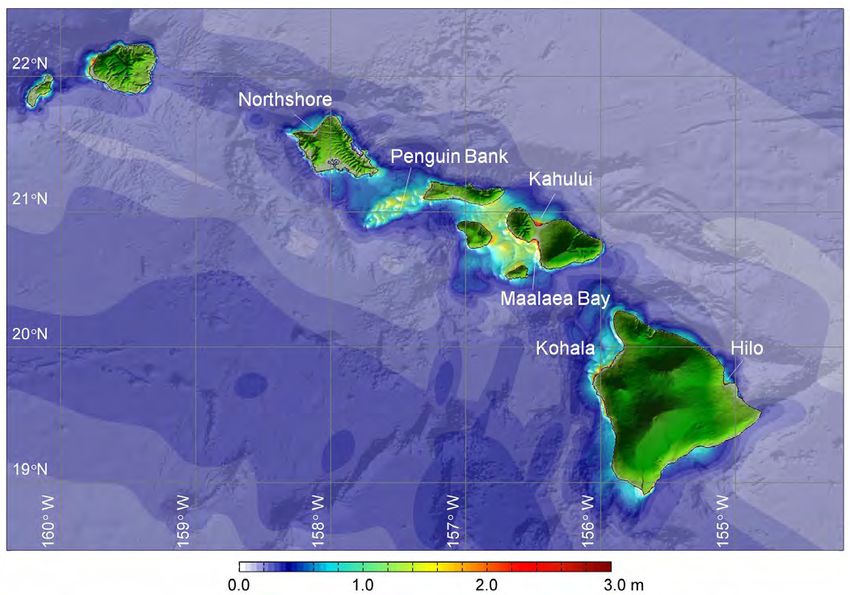
Figure 3. Slip distribution from the finite source solution. (b) Vertical seafloor displacement; ○ (red), epicenter; ○ (white), water level stations.

bathymetry and topography in the Hawaii region. LiDAR                                  velocity is 1.5 km/s out to 100 km radius from the hypocenter
(Light Detection and Ranging) data of 2~4 m resolution is                              and 2.5 km/s at larger distance.
available along Hawaii's coastlines from approximately 40 m                                The finite-source solution estimates the seismic moment as
water depth to 15 m topographic elevation. The data are                                3.8 × 10²² N⋅m (Mw 9.0), compatible with long-period
distributed by the US Army Corps of Engineers and US                                   determinations of ~3.9 × 10 Nm [9]. Figures 3(a) and (b) show
                                                                                                                    22

Geological Survey.                                                                     the slip distribution from the finite-source solution and the
                                                                                       calculated permanent vertical displacement [10]. The 148-sec
   III.     FINITE SOURCE MODEL AND TSUNAMI GENERATION                                 duration faulting consists of two primary slip regions, near the
                                                                                       hypocenter and along the trench. The individual subfaults have
                                                                                       an average rise time of 32 sec and an average slip of 15.0 m
    The Tohoku-oki earthquake occurred on 11 March 2011 at
                                                                                       with a maximum value of 58.1 m near the trench. The seafloor
05:46:18 UTC. The US Geological Survey (USGS) and the
                                                                                       deformation shows two significant uplift regions corresponding
Japan Meteorological Agency (JMA) estimated the moment
                                                                                       to the large fault slip regions and a maximum displacement of
magnitude Mw of 9.0. The estimated location of the hypocenter
                                                                                       25.2 m near the trench. The finite-source model defines
varies among studies, with a regional three-dimensional
                                                                                       kinematic seafloor deformation with subfault contributions
seismic velocity model yielding a hypocenter at 38.107°N
                                                                                       being computed using the planar fault model of Okada [10].
142.916°E with a focal depth of 14.5 km into the crust [8]. The
                                                                                       The deformation is a linear function of the slip and dimensions
finite-source model is derived from least-squares inversion of
                                                                                       of the fault. Superposition of the deformation from the
teleseismic P waves using a layered source-region velocity
                                                                                       subfaults with consideration of their rupture initiation times and
structure adapted from [2]. The model utilizes a 380 km long
                                                                                       rise times reconstructs the time sequence of seafloor vertical
and 200 km wide fault subdivided into 190 square subfaults of
                                                                                       displacement and velocity for the input to NEOWAVE [4].
20 km × 20 km each. The subfaults have a strike angle of 202°
and a dip angle of 12°. The hypocenter is located at 38.107°N                              The finite-source solution is validated through
142.916°E and 19.5-km depth into the crust. The rupture                                comparison of the computed tsunami waveforms and the
                                                                                       recorded water-level data surrounding the rupture. The GPS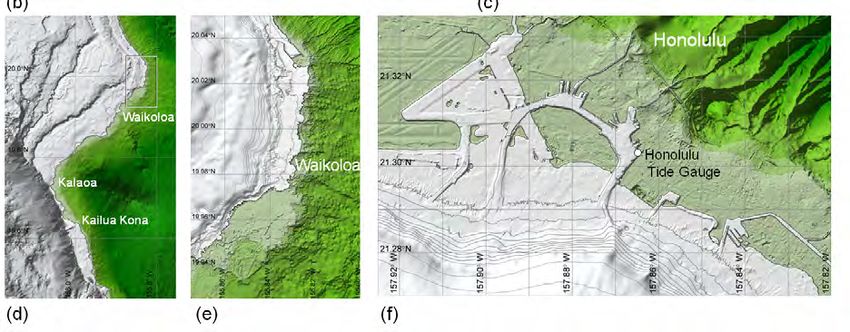
Figure 4. Time series and spectra of surface elevations at water level stations near Japan. ⎯⎯ , recorded data; ⎯⎯ , computed data.

and wave gauges, which are located at 120~200-m and 50-m                       arrival time, amplitude, and frequency content with the
water depth, captured the near-shore tsunami characteristics.                  measurements. The North, Central, and South Iwate, as well as
Figure 4 shows a comparison of the recorded and computed                       the North Miyagi GPS gauges, which were located
waveforms and spectra at the gauges. The computed results at                   immediately west of the major rupture area, recorded around 5
the Kushiro, Tomakomai, and Mutsu Ogawara wave gauges                          m wave amplitude. The computed results successfully
north of the rupture area show very good agreement of the                      reproduce these extreme measurements, even though minor
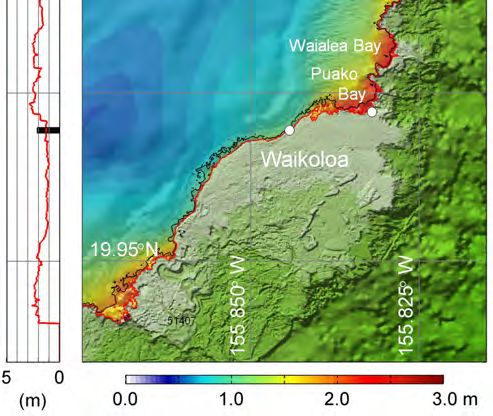
Figure 5. Time series and spectra of surface elevations at DART buoys across north Pacific. ⎯⎯ , recorded data; ⎯⎯ , computed data.

                                     Figure 6. The level-1 grid, computed maximum amplitude across north Pacific.

discrepancies in arrival times and waveforms are observed.                    computed results reproduce the dominant processes and show
The model does not fully capture the initial wave at the North                overall good agreement with the measurements, thereby
Miyagi, Central Miyagi, and Fukushima GPS gauges, but                         validating the present solution for tsunami generation from
produces decent agreement at subsequent waves comparable                      seafloor deformation with the finite source model.
to the gauges to the north and west of the source. The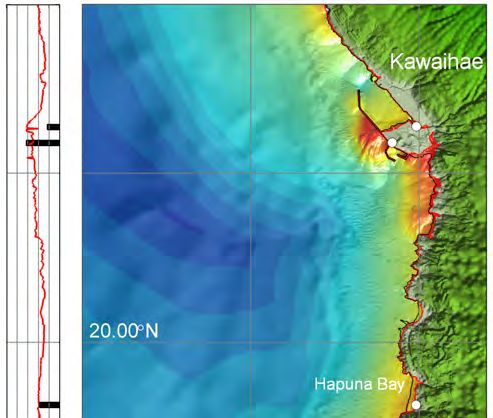
Figure 7. The level-2 grid, computed maximum amplitude over Hawaiian Islands.

               Figure 8. Time series and spectra of surface elevations at Honolulu tide gauge. ⎯⎯ , recorded data; ⎯⎯ , computed data.

                                                                             Alaska and North America coasts, as well as a location west of
    IV.    TSUNAMI PROPAGATION AND IMPACT ON HAWAII                          Big Island of Hawaii, show very good agreement. The
                                                                             computed waveforms have been shifted by up to 6 min as
    The 2011 Tohoku-oki tsunami is modeled with four levels                  indicated in the figure to match the tsunami arrival time. The
of nested grids to investigate the impact on Hawaii. Figure 5                good agreement of the computed and measured subsequent
compares the surface elevation time series and amplitude                     waves indicates that the model correctly captures the shelf
spectra at the DART buoys across the north Pacific. The model                resonance around the Pacific Rim [11]. Figure 6 shows the
reproduces the large and distinct initial waves along the Japan              maximum wave amplitude across the Pacific. The main energy
coast and to the south. The comparisons near the Aleutian-                   propagates in a direction normal to the Japan trench and passes
amplification is observed at North Shore of Oahu, Kahului and
Maalaea Bays of Maui, and Kohala and Hilo of Hawaii Island
similar to [13]. These wave activities, which caused damage to
harbor facilities and boats, have been lasting for a couple of
days after the tsunami event. Figure 9 shows the computed
runup and inundation around Waikoloa, Hawaii Island. A
shallow fringing reef, which extends about 1.5 km offshore, is
present in the embayment. The model describes the
amplification of the waves across the reef and reproduces the
overall pattern and height of the recorded run-up along the
coast.
V. CONCLUSION
The 2011 Tohoku-oki tsunami and its devastating impacts
in Japan and damage across the Pacific provide valuable
information for better understanding of tsunami physics and
improvement of assessment tools. A wealth of recorded
geophysical and hydrographical data from the event and high-
resolution bathymetry and topography data around the
Hawaiian Islands allows reconstruction of the tsunami through
numerical modeling and an investigation of the impacts at the
affected coastlines.
A seismic wave-derived finite-source model provides the
time sequence of rupture processes that drive seafloor
deformation for input to NEOWAVE. The model gives
excellent agreement with recorded tsunami data along the
Japan coasts and across the Pacific. thereby validating the
finite-source solution and the capability of NEOWAVE for
modeling near and far-field tsunamis. The two-way, grid
nesting scheme allows modeling of wave transformation and
runup around the Hawaiian Islands. The recorded tide gauge
and runup data confirm our capability to predict tsunami
impacts in tropical island environments. Further tsunami
impact assessments along the coasts of Hawaii with
NEOWAVE will provide insights into the effects of fringing
reefs on tsunami transformation and runup processes.
Figure 9. Runup, inundation, and maximum amplitude. bar(black):
recorded runup;; ⎯⎯ , computed data. ACKNOWLEDGMENT
south of the Hawaiian Islands. The seamounts along the This work made use of GMT, and Matlab software. We thank
underwater ridges focus the tsunami waves into high energy T. Kuwayama for supplying the 20 arcsec Japan bathymetry
beams across the western Pacific, one of which points directly data. The recorded DART buoy data were obtained from the
to the west side of Hawaii Island. The waves reach the west NOAA National Data Buoy Center. The recorded GPS and
coast of North America with considerable amplitude. wave gauges data were provided by NOWPHAS. The Hawaii
Refraction at the Mendocino escarpment focuses the wave Tsunami Observer Program of Hawaii State Civil Defense
energy toward Northern California. provided recorded runup data.
The Hawaiian Islands are prone to resonance caused by REFERENCES
tsunamis. Figure 7 shows the maximum amplitude around the [1] C. Ji, D.J. Wald, and D.V. Hemberger, "Source description of the 1999
Hawaiian Islands that corroborates the resonance oscillation Hector Mine, California, Earthquake, Part I: Wavelet domain inversion
modes over the shallow insular shelves including Penguin theory and resolution analysis”, Bull. Seismol. Soc. Am., 92(4): 1192-
Bank between Oahu and Molokai [12]. Figure 8 compares the 1207, 2002.
computed and recorded data at the Honolulu tide gauge on the [2] N. Takahaski, S. Kodaira, T. Tsuru, J.-O. Park, Y. Kaneda, K.Suyehiro,
south shore of Oahu. The model slightly underestimates the H. Kinoshita, S. Abe, M. Nishino, and R. Hino, “Seismic structure and
seismogenesis off Sanriku region, northeastern Japan”, Geophys. J. Int.,
initial wave, while producing excellent agreement of the phase 159,129-145, 2004.
and frequency content for more than 3 hours. While the south
[3] Y. Yamazaki, Z. Kowalik, and K.F. Cheung, ‘Depth-integrated, non-
shore of Oahu does not exhibit significant wave amplification, hydrostatic model for wave breaking and run-up’, Int. J. Numer.
the spectral peak at 42 min corresponds to regional resonance Methods Fluids, 61(5), 473-497, 2009
extending from Oahu to Maui. Nearshore resonance[4] Y. Yamazaki, K.F. Cheung, and Z. Kowalik, “Depth-integrated, non- 2011 Tohoku-oki earthquake (Mw 9.0)”, Geophys. Res. Lett., 2011, in
hydrostatic model with grid nesting for tsunami generation, propagation, press.
and run-up”, Int. J. Numer. Methods Fluids, Doi: 10.1002/fld.2485, in [9] C.J. Ammon, T. Lay, H. Kanamori, and M. Cleveland, “A rupture model
press. of the great 2011 Tohoku earthquake”, Earth, Planets and Space, 63,
[5] T. Lay, Y. Yamazaki, C. J. Ammon, K.F. Cheung, and H. Kanamori, 2011, doi:10.5047/eps.2011.05.015, in press.
“The great 2011 Tohoku-oki (Mw 9.0) earthquake: Comparison of deep- [10] Y. Okada, “Surface deformation due to shear and tensile faults in a half
water tsunami signals with finite-fault rupture model predictions”, Earth, space”, Bull. Seismol. Soc. Am., 75(4), 1135–1154, 1985.
Planets and Space, 63, doi:10.5047/eps.2011.05.030, 2011, in press.
[11] Y. Yamazaki, and K.F. Cheung, Shelf resonance and impact of near-
[6] T. Lay., C. J. Ammon, H. Kanamori, L. Xue, and M. J. Kim, “Possible field tsunami generated by the 2010 Chile earthquake. Geophys. Res.
large near-trench slip during the great Tohoku (Mw 9.0) earthquake”, Lett, 38, L12605, doi:10.1029/2011GL047508, 2011, in press.
Earth Planets Space, doi:10.5047/eps.2011.05.033, 2011, in press.
[12] S. Munger and K.F. Cheung, Resonamce in Hawaii waters from the
[7] T.A. Battista, B.M. Costa., and S.M. Anderson, Shallow-Water Benthic 2006 Kuril Islands Tsunami, Geophys. Res. Lett, 35(7), L07605,
Habitats of the Main Eight Hawaiian Islands (DVD). NOAA Technical doi:10.1029/2007GL032843, 2008.
Memorandum NOS NCCOS 61, Biogeography Branch. Silver Spring,
MD, 2007 [13] V. Roeber, Y. Yamazaki, and K.F. Cheung, Resonance and impact of the
2009 Samoa tsunami around Tutuila,American Samoa. Geophys. Res.
[8] D. Zhao, Z. Huang, N. Umino, A. Hasegawa, and H. Kanamori Lett, 37, L21604, doi:10.1029/2010GL044419, 2010.
“Structural heterogeneity in the megathrust zone and mechanism of theYou can also read