SAP S/4HANA 2020 & 1909 (all FPS versions) Fully-Activated Appliance: Analytics
←
→
Page content transcription
If your browser does not render page correctly, please read the page content below

PUBLIC
SAP S/4HANA 2020 & 1909 (all FPS) Fully-Activated Appliance
December 2020 (V1.3)
English

SAP S/4HANA 2020 & 1909 (all FPS versions) Fully-Activated Appliance:
Analytics
Demo Guide

Table of Contents

1         How Can This Script Be Used?                                                 3

2         General remarks                                                             4

3         Embedded Analytics                                                           5
3.1       Analytical List Page (using the Sales Order Fulfillment app)                 5
3.2       Multi-dimensional Report (using the Sales Volume Analysis query)             9
3.3       Smart Business App for Purchasing                                           17

4         SAP Business Objects BI Platform                                            21
4.1       Prerequisite: BI platform in your trial landscape                           21
4.2       Accessing the BI platform                                                   21
4.3       Connecting the BI platform to SAP S/4HANA                                   22

5         Demo Guide: Integration with SAP Analytics Cloud (SAC)                      24
5.1       Components Needed for SAC connectivity                                      24
5.2       Technical Settings                                                          24
          5.2.1    CORS (Cross-Origin Resource Sharing)                               24
          5.2.2    Supported browsers & certificate handling                          25
          5.2.2.1 Use Google Chrome on the remote desktop                        25
          5.2.2.2 Use Chrome on your local PC                                    25
5.3       Demo scenarios for the SAP Analytics Cloud & SAP S/4HANA                25
          5.3.1    Create an SAC connection into the Fully-Activated Appliance    26
          5.3.2    Create an SAC model on top of your S/4HANA connection          28
          5.3.3    Create a story on top of your SAC model                        31
          5.3.4    Explore further scenarios                                      40

6         Appendix                                                                    41

Document History

    Revision       Date                  Change

    1.0            December 2020         Release for customer

    1.1            April 2020            Minor adaptations for 1909 FPS01

    1.2            June 2020             Minor adaptations for 1909 FPS02

    1.3            December 2020         Minor adaptations for 2020 SP00

                                                                                           2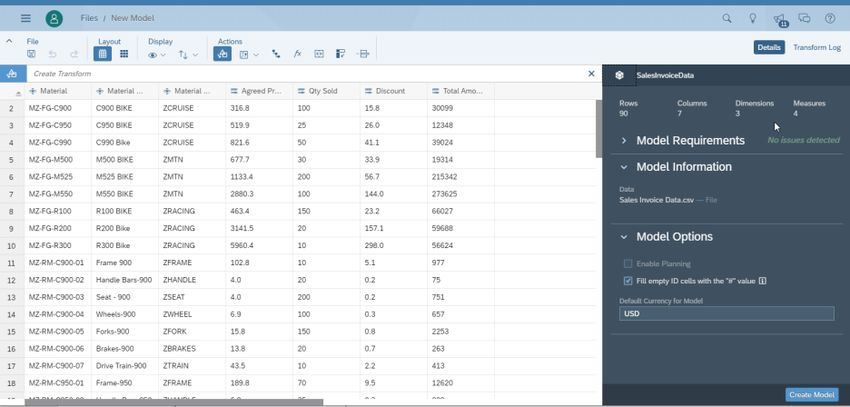
1 How Can This Script Be Used?

This demo script has been written for usage with the SAP S/4HANA 1909 & 2020 Fully-Activated Appliances (in
short “appliance” in this script), hence you will need such an appliance to make use of this guide. Depending on
your exact release, minor differences between software and guide might occur.

The appliance can be brought up in two ways, and the demo scenario in this script is largely the same for both:

1.   Via SAP Cloud Appliance Library (hosted on cloud providers)
     You need a cloud provider account at AWS, MS Azure, or GCP. With this, you can deploy the appliance within
     1-2 hours from https://cal.sap.com > Solutions > SAP S/4HANA (your desired version 2020 or 1909) Fully-
     Activated Appliance.
2.   Via installing it on your own on-premise hardware.
     You need to provide your own hardware, and order & install the appliance as explained in SAP Note 2041140.

If you are new to the SAP S/4HANA Fully-Activated Appliance, introductory information can be found here:
https://blogs.sap.com/2018/12/12/sap-s4hana-fully-activated-appliance-create-your-sap-s4hana-1809-
system-in-a-fraction-of-the-usual-setup-time/

Important:
Before you start your demo, please read SAP S/4HANA Fully-Activated Appliance: Demo Scripts for information
about necessary preparations, especially any post-deployment steps to ensure the full functionality of your
appliance. These steps are covered in sections;
         B) General Remarks
         C) Post-deployment Steps
         D) Log-on to the system
Besides this, you will also find links to all demo scripts on this page.

                                                                                                                   3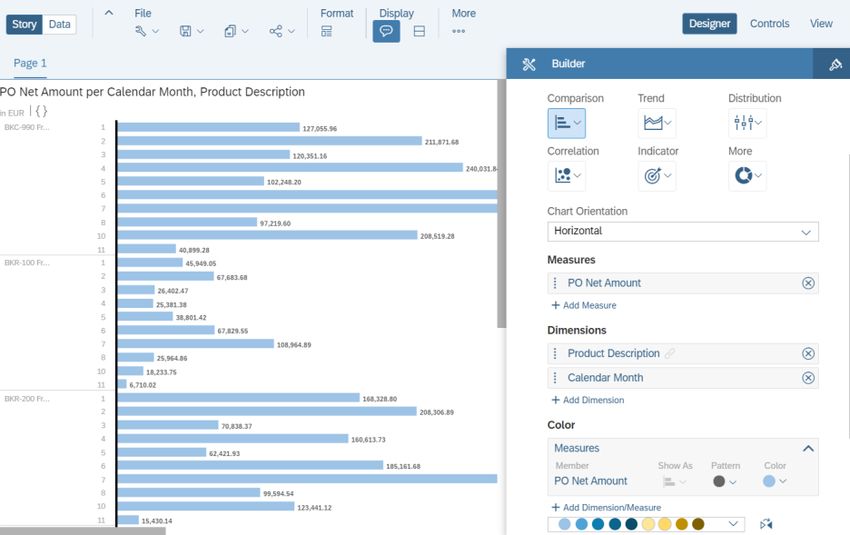
2         General remarks

This script shows three possible capabilities for analytical scenarios within SAP S/HANA;
    1.   Embedded Analytics
    2.   SAP BusinessObjects BI Platform
    3.   SAP Analytics Cloud (SAC)

This should help you decide next steps depending on your business needs, existing licensing & infrastructure, and
so on.
The script focuses on generic feature views of the various analytics tools (how to connect them, available user
interface functions, etc.) and doesn’t go into specific business processes. And it only describes a very small
portion of the available capabilities. Please see the SAP documentation and other sources for more information.

                                                                                                                  4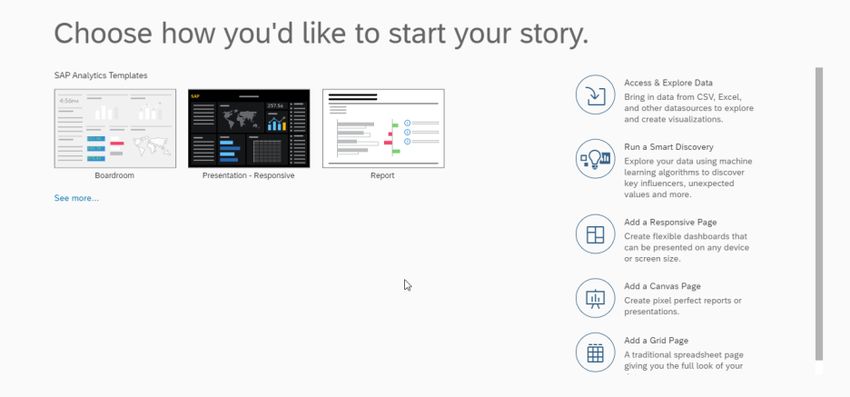
3          Embedded Analytics

  This demo covers the different visualization options available to the end user in SAP S/4HANA embedded analytics.
  We will not go through a full business process but rather highlight some of the actions that are possible using
  embedded analytics.

  Note:
  Depending on the release / feature package stack (FPS) that you are using, the screens might look a bit different
  due to different Fiori themes used. You can toggle the Fiori themes in the “Me” area → Settings.

  3.1        Analytical List Page (using the Sales Order Fulfillment
             app)

What to do                What you will see

Open the link for the
Fiori Launchpad.
https://vhcals4hcs.du
mmy.nodomain:44301
/sap/bc/ui5_ui5/ui2/
ushell/shells/abap/Fio
riLaunchpad.html

Log on with
User: S4H_SD_DEM
Password: Welcome1

From the drop-down list
with available Fiori
groups, choose “Sales
Order Monitoring”

                                                                                                                  5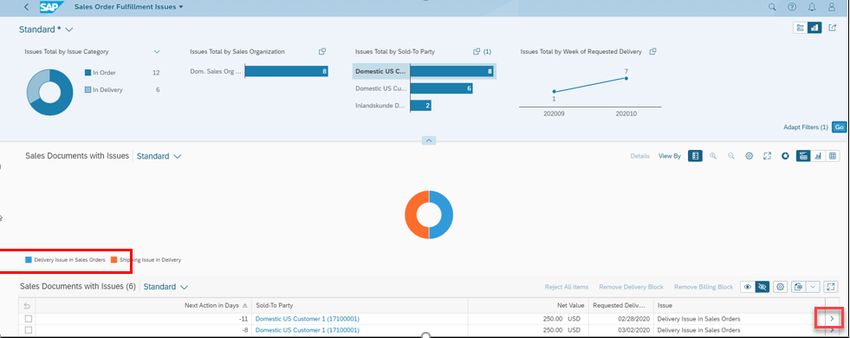
Click on the “Sales
Order Fulfillment” tile.

Select the “Go” button
to list all the issues.

In the visual filter “Issue
Total by Sold to Party”,
click on the first
customer (Domestic
Customer US 1)

Click Go

This will list all the sales
order fulfillment issues
for this specific
customer.

Click “Delivery Issue in
Sales Order” in the
chart to narrow the
selection.

In the list of the issues,
click on the ‘>” icon in a
sales order to navigate
to the details.

                               6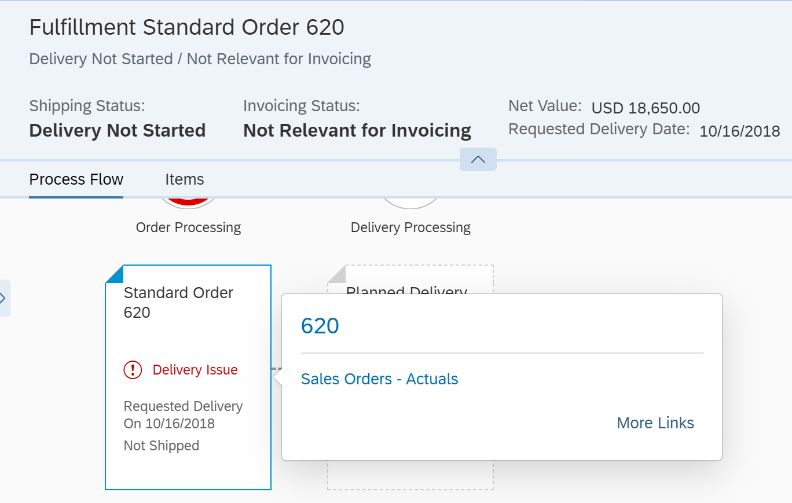
In this screen you have
the option to analyze
the issue with the
specific sales order and
the current status.

Note:
In this guide, we will not
show how to solve a
specific issue (since this
varies depending on the
sales order you chose),
but highlight some of
the integrated follow-up
options within the app
(to enable “insight-to-
action”)

Click on one of the
interactive parts in the
app (e.g. the sales
order).

If you click on the order
number, you can
analyze the details for
resolving the issue.

                             7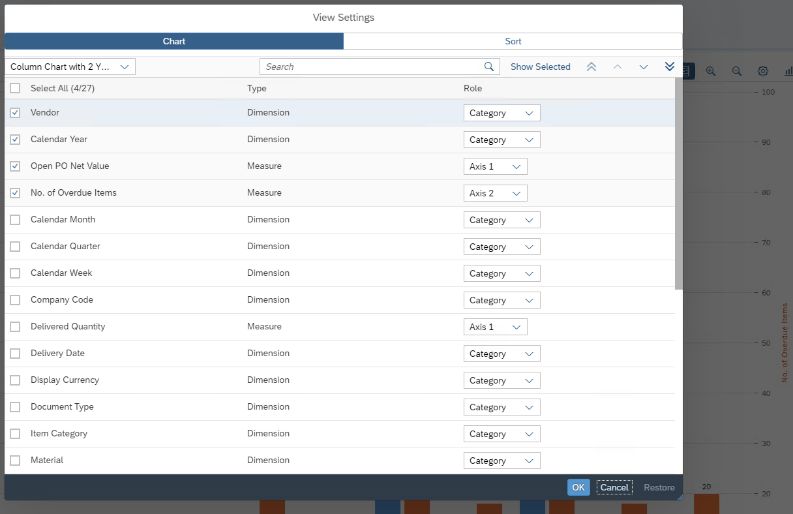
In the Related Apps
section, you can
navigate to the
configured transactional
apps.

Once the issue is
resolved you can
navigate back to the
Home screen.

This step concludes the
analysis of Sales Order
Fulfillment Issues with
an Analytical List Page.

In this next section of
the exercise we would
analyze the
Multidimensional Grid
available to the end
users via the query
Browser.

                           8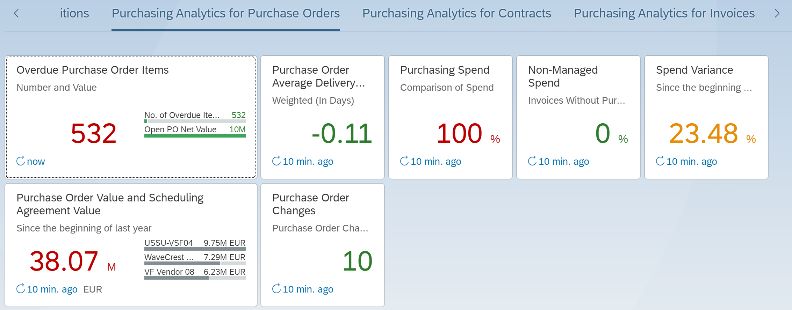
3.2      Multi-dimensional Report (using the Sales Volume
         Analysis query)
What to do                 What you will see

Stay logged on with the
user S4H_SD_DEM

Search for the app
“Query Browser” and
click on it.

This app lists the
queries available to the
business user.

The end user could
analyze the reports in a
multi-dimensional grid.

Search for the query
“Sales Volume”.

From the result set,
select the query
“Analytics – Sales
Volume” by clicking on
the linked view name

                                                            9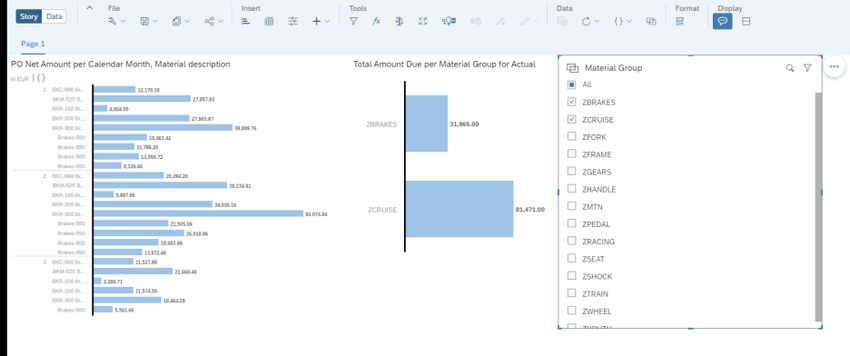
You can see the fields
that are part of the
query.

Click “Open for
Analysis” to open the
multi-dimensional grid.

Enter the required input
parameters:
(e.g. M & EUR)

Click OK to launch the
grid report.

The end user could
drag dimensions from
the free characteristics
to the column or the
row and get the grid as
desired.

In this section we would
like to get the top 10
customers for year
2019.

To do this, remove the
months via drag & drop
of “Yr//Mo of creation”
from the columns.

                           10
Locate
“Year of Creation” from
the list of dimensions
(search or scroll)
Drag the dimension
“Year of Creation” to
the Row below the
dimension “Sales
Organization”.
Notice how the results
grid changes.
11Now we would like to
restrict the values to the
current year.
Select the Filters button
and navigate to or
search the dimension
“Year of Creation” and
click on the help icon
for possible values.
Select a year from the
possible values on the
tab Select From List.
Click OK
Click Go to update the
result grid.
12From the dimensions
list, drag the “Sold-To
Party” to the Row
below the “Year of
Creation”
Clicking on the
measure would allow
the user to sort the
results based on the
key measure.
Right click on the Net
Value measure and
select ‘Define
Conditions”.
13In “Define Conditions”,
select Top N and enter
10 to select the Top 10
customers.
Analyze the view so
that all dimensions and
measures are available
for the format required.
Maybe also add some
charts to your view if
you like.
Once If the view meets
your requirements, you
could save it as a
variant.
Click on the “Standard”
button
Click on “Save As” to
create a variant.
14Name the variant as
per your requirement.
Set the visibility to
Public and click Save.
Select Local Object
(since we don’t want to
transport the view
across multiple
systems)
Select Save
The variant is now
saved. You could also
save this as a personal
tile.
Click on Actions →
Save as Tile.
15Enter the descriptions
for saving this as
personal tile.
Click OK.
Navigate to the Home
page.
Refresh the Fiori
Launchpad and you
can find the personal
tile in
“My Home”
Group.
This concludes the
exercise on multi-
dimensional report,
variant creation and
save as personal tile.
163.3 Smart Business App for Purchasing
What to do What you will see
Open the link for the
Fiori Launchpad.
https://vhcals4hcs.du
mmy.nodomain:44301
/sap/bc/ui5_ui5/ui2/
ushell/shells/abap/Fio
riLaunchpad.html
Log on with user
S4H_MM_DEM /
Welcome1
From the groups, select
the group
“Purchasing Analytics
for Purchase Orders”
This shows the SAP
delivered standard
apps for Purchasing.
Click on the app
“Overdue Purchase
Order Items”
17This will open a pre-
configured Smart
Business tile.
Select the option “Show
Mini Charts” on the
right upper corner of
the report.
You can see the related
KPI tiles which have
been configured along
with the “Overdue
Purchase Order”.
You also have the
possibility to change
the filters for the
application.
Click on the Gear icon
to open the settings for
the chart.
Click on the Sort tab
and select the Open PO
Net Value as dimension
to sort and so that the
highest value can be
seen first.
Click OK
18The chart icon lets you
change the chart type
at runtime.
Select the Combined
Colum Line Chart.
After analyzing the
orders with the highest
overdue items, you
could navigate to the
preconfigured
transactional app
through the
“Open In” options.
Navigate to the
Purchase Order App.
19Select a purchase order
from the list to analyze
more details.
The factsheet for the
Purchase order is
available for analysis,
with further actions
available in Related
Apps where you could
do further actions (we
won’t cover this in detail
in this script).
204 SAP Business Objects BI Platform
This scenario explains how to access the SAP BusinessObjects BI platform that can be included optionally into
your instance.
Since the 1909 releases of the appliance, the BI platform comes without pre-configured content (dashboards /
reports) since this content has not been updated / validated anymore.
As usual, you can create your own reports using the standard authoring tools e.g. Lumira which is installed on the
remote desktop of the appliance.
4.1 Prerequisite: BI platform in your trial landscape
If you are running this scenario via SAP CAL (i.e. hosted on AWS, Azure, GCP):
As default, the BI platform will be deployed as part of your landscape. However, during the creation of your
system instance, you can opt out of the deployment of the BI platform in case you do not need it (this will
decrease your hosting costs a bit).
This can be done in the Advanced Mode of the instance creation process in SAP CAL by de-selecting the
respective checkbox in the Virtual Machines section of the instance creation wizard.
It is not possible to add the BI platform once a system instance has been created without it. You will need to
create a new instance with the BI platform included this time.
If you have the BI platform deployed and use a local browser to access the BI platform, please map your hosts file
as described in the Getting Started Guide that is referenced in the instance details page of the SAP Cloud
Appliance Library console. You will need a mapping between the bihost alias and the IP address of your BI
platform. If you are using the remote desktop within SAP CAL, this mapping is done already automatically.
If you are running this scenario on your own hardware (i.e. you received the appliance via download or Blu-Ray):
There is no BI landscape contained in the local shipment, so if desired you need to install a BI platform system on
your own and make the connection to your locally installed SAP S/4HANA system.
4.2 Accessing the BI platform
This activity shows you how to access the BI platform.
Since the BI platform does not contain any pre-configured content, you will need to create your own reports based
on the connection into the SAP S/4HANA backend (see the next chapter for the pre-defined connection).
21What to Do What You Will See
Open the BI launch pad
http://bihost:8080/BOE/BI
(hosts file mapping needed,
see Getting Started guide)
System: bihost:6400
User: BPINST
Password: Welcome1
4.3 Connecting the BI platform to SAP S/4HANA
The following sections briefly describe how the connection to the SAP S/4HANA is defined in the BI platform that
you can use as part of the SAP CAL offering.
If you have obtained the appliance via download or Blu-Ray shipment, you need to enter these settings within your
own BI platform.
The connection into SAP
S/4HANA is defined in the BI
Central Management Console
(http://bihost:8080/BOE/CMC)
System: bihost:6400
User: Administrator
Password: Welcome1
Authentication: Enterprise
22Choose Organize → OLAP
Connections.
Right click on the S4HANA
connection and choose Organize
→ Edit
The pre-defined connection into
SAP S/4HANA is displayed
(using the system alias
vhcals4hcs).
If you want to connect your own
SAP S/4HANA system, please
maintain them accordingly.
Depending on your network
setup, you might also need to
maintain the hosts file on the
(Linux) server where the BI
platform is running to make the
connection work.
Use the Connect button to test
your setup.
235 Demo Guide: Integration with SAP
Analytics Cloud (SAC)
The appliance can be connected to the SAP Analytics Cloud (SAC), allowing you to create analytical visualizations
for the data residing in SAP S/4HANA.
For this scenario, you need an account for the SAP Analytics Cloud since this cannot be delivered as part of the
appliance.
Also, since there are many tutorials on the SAP Analytics Cloud page and in the Internet for SAC usage, we will
only describe a basic scenario in this guide and refer to the existing tutorials for details at the end of this guide.
5.1 Components Needed for SAC connectivity
Component Where to get it
SAP S/4HANA backend system Use the appliance or any other S/4HANA on-premise
system
SAP Analytics Cloud account Use an existing SAC account or get one from SAP Store:
https://www.sapstore.com/solutions/40117/SAP-
Analytics-Cloud-for-Business-Intelligence.
For SAP Partners, the T&D license 8004109 will also be
sufficient for such an account (please see SAP PartnerEdge
for details).
The free SAC trial on SAP Store (or the link on the SAC site
https://www.sapanalytics.cloud/ → Try it free), does not
contain the option to connect to an SAP S/4HANA system.
5.2 Technical Settings
5.2.1 CORS (Cross-Origin Resource Sharing)
CORS is a technology that allows a browser to securely use coding & data from multiple web sites in the same
browser session (this is needed for the Live Data Connection from SAC to S/4HANA).
For the appliance releases of SAP S/4HANA 2020 and 1909 FPS01&FPS02, CORS is enabled by default, you
don’t have to maintain anything on top of it to run this demo script.
For the SAP S/4HANA 1909 SP00 Fully-Activated Appliance, CORS is not fully enabled by default, and you need
to maintain settings as described in the standard documentation for CORS. Those are in particular:
• Set the parameter icf/cors_enabled to 1 as described in the documentation above (either using
tCode RZ11 for a temporary change, or using tCode RZ10 for a permanent change)
• The whitelist entry *.sapanalytics.cloud (tCode /nUCONCOCKPIT) has been set accordingly in SP00, so
you don’t have to maintain it unless you have a special setup
24• For using recent Chrome releases (Chrome 80 and higher) you need to modify one file on the Linux OS
level as described here → “SAP NetWeaver-based systems (BW, S4, BPC) with CORS enabled by HTTP
Whitelists”.
For the appliance, this file is /usr/sap/S4H/SYS/profile/redirect.txt as specified in the
parameter icm/HTTP/mod_0 of the DEFAULT profile (in the documentation above the file is called
rewrite.txt as example).
• Please also note that in 1909 SP00 an enabled CORS will affect the Fiori personalization feature (see SAP
Note 2804978 for details). This dependency has been fixed in 1909 FPS01.
5.2.2 Supported browsers & certificate handling
SAP Analytics Cloud is optimized for Google Chrome, other browsers might have functional limitations (for
details, please see here).
There are two ways for using Google Chrome in the appliance: either on the remote desktop of the appliance or on
your local computer.
5.2.2.1 Use Google Chrome on the remote desktop
Google Chrome is installed on the remote desktop of the appliance, and a trust relation between SAC and
S/4HANA is already established for Chrome.
You can access your SAC tenant directly in Chrome and establish a connection to the S/4HANA appliance from
there (see chapter 5.3).
5.2.2.2 Use Chrome on your local PC
For this you need to establish a trust relationship between your local Chrome installation and the appliance
certificate (self-signed by SAP).
The easiest way is to access the Fiori launchpad once with the vhcals4hcs.dummy.nodomain URL (see the Getting
Started guide of the appliance how to do the mapping) and confirm the warnings about an insecure connection.
Afterwards, you can create a connection in SAC using the vhcals4hcs URL as described in the next chapter.
5.3 Demo scenarios for the SAP Analytics Cloud & SAP
S/4HANA
There are many tutorials in the Internet that describe how to use SAP Analytics Cloud (SAC) with SAP S/4HANA,
plus there’s lot of pre-defined SAP content that can be directly loaded into your SAC tenant.
In this guide, we will only show how to establish the connection between SAC and S/4HANA, and how to create a
very basic chart on top of S/4HANA content.
25For more detailed scenarios, please have a look at the referenced tutorials at the end of this guide.
5.3.1 Create an SAC connection to the Fully-Activated
Appliance
What to Do What You Will See
Log on to your SAC
account.
Click on Main Menu →
Connection.
Click on the to create
a new connection.
26What to Do What You Will See
Choose Connect to Live
Data → SAP S/4HANA
27What to Do What You Will See
Enter the connection data
as shown below (this
requires a mapped
/etc/hosts file).
Use an existing S/4HANA
user e.g. BPINST /
Welcome1).
Recommended:
The name of the
connection should be
SAPEMC if you would like
to use pre-delivered SAC
content (not described in
this demo guide) since it
uses this connection
name.
Click OK (this will also test
the connection).
5.3.2 Create an SAC model on top of your S/4HANA
connection
For creating a model, you need to choose a data source (in our case a CDS query residing in S/4HANA) and define
certain attributes for it.
As data source, we will choose a query for spend analysis of procured materials (the technical name of the query
is 2CCMMPURORDVALUEQ).
28What to Do What You Will See
Log on to your SAC
account.
Click on Main Menu →
Create → Model
Choose Get data from a
datasource → Connect
to live data
29What to Do What You Will See
Choose these values:
System Type:
SAP BW
Connection:
SAPEMC
Data Source:
Type ’spend
analysis‘ and select
query
2CCMMPURORDVALUE
Q from the upcoming
search results
Choose OK.
Note: the underlying
technology for
S/4HANA queries is the
same as for SAP BW,
therefore we can choose
this system type.
Click Save.
30What to Do What You Will See
Choose a name and
place in the SAC file
hierarchy (or create a
new folder) and click OK.
Result: you have created
a model and can now
use this in a story.
Note:
Via Main Menu →
Browse → Files, you can
access your models and
stories afterwards for
editing.
5.3.3 Create a story on top of your SAC model
A story is a data visualization in SAC. It is based on a model and can range from a simple chart or table to complex
dashboards or management reporting screens.
In our simple example, we will just create one bar chart of our monthly spend per material but feel free to add
more data or visualizations and explore the tutorials for ideas.
What to Do What You Will See
Log on to your SAC
account.
Click on Main Menu →
Create → Story
31What to Do What You Will See
Choose Add a canvas
page.
Choose Chart.
Choose the model you
just created.
32What to Do What You Will See
Choose Set.
Add the measure PO Net
Amount.
Add the dimensions
Product description and
Calendar Month.
Depending on your
release, the “Product
Description” dimension
might be called “Material
Description”.
The chart will be filled
with data.
Once you’re done, Save
your story in your SAC
file structure.
33What to Do What You Will See
To enhance reporting,
you can combine
S/4HANA data with data
coming from retail
stores as flat files.
Click on Main Menu →
Create → Model
34What to Do What You Will See
Choose Import a file
from your computer.
On the remote desktop,
choose the file
Q:\flavor\\
Demo_Files\ Sales
Invoice Data.csv
The exact
folder name depends on
the appliance release.
If you do this exercise on
your local computer,
please download the file
from the remote
desktop.
The appendix of this
guide contains the
content of the file as a
table in case you have no
access to the remote
desktop (save the table
as a local CSV file).
Tick Use first row as
column headers and
click Import.
35What to Do What You Will See
Once the data is
uploaded, click on
Create Model and
confirm the popup.
Choose a location to
save the model and
name the model as
Sales_Invoice_Data
Note: The same location
can be used where the
initial model
Spend_Analysis_S4_CA
L was created.
Navigate to Home →
Browse → Files and click
on your previously
created Spend Analysis
Story to open it.
Click Edit to start editing
the dashboard again.
36What to Do What You Will See
Choose the bar chart
icon under Insert to
insert a new graph into
the dashboard and click
the pencil icon to change
the data source.
Click Select other model
and choose the model
Sales_Invoice_Data
Select Measures ‘Total
Amount Due’ and
Dimension as ‘Material
Group’.
37What to Do What You Will See
Click the Link Dimension
icon to create a link
between the two models
based on the common
dimensions.
Choose the following
dimensions from both
models to create the
link:
• Material
• Product
Description (or
Material
Description
depending on
your release)
• Material Group
Make sure that the
Matched Dimensions
pane contains the right
mappings.
Click Set → Done.
Under Insert, click the
icon Input Control for the
dashboard.
Click Input Control and
next click the Edit icon to
choose the model
Sales_Invoice_Data
38What to Do What You Will See
Choose Dimension →
Material Group.
Select All Members and
Click OK.
Enlarge the Input Control
and select different
Material Group options
as desired for the
dashboard.
All the figures on the
dashboard will now react
to the filters.
395.3.4 Explore further scenarios
As said above, there are many tutorials on the SAP Analytics Cloud page itself
(https://www.sapanalytics.cloud/resources-getting-started-guide/) and on the Internet how to build reports on
top of any data. Please explore them to get further ideas.
406 Appendix
Content of the Sales Invoice Data CSV file on the remote desktop in Q:\flavor\1909FA…\Demo_Files
Total Amount
Material Material Description Material Group Agreed Price Qty Sold Discount Due
MZ-FG-C900 C900 BIKE ZCRUISE 316,8 100 15,8 30099
MZ-FG-C950 C950 BIKE ZCRUISE 519,9 25 26 12348
MZ-FG-C990 C990 Bike ZCRUISE 821,6 50 41,1 39024
MZ-FG-M500 M500 BIKE ZMTN 677,7 30 33,9 19314
MZ-FG-M525 M525 BIKE ZMTN 1133,4 200 56,7 215342
MZ-FG-M550 M550 BIKE ZMTN 2880,3 100 144 273625
MZ-FG-R100 R100 BIKE ZRACING 463,4 150 23,2 66027
MZ-FG-R200 R200 Bike ZRACING 3141,5 20 157,1 59688
MZ-FG-R300 R300 Bike ZRACING 5960,4 10 298 56624
MZ-RM-C900-01 Frame 900 ZFRAME 102,8 10 5,1 977
MZ-RM-C900-02 Handle Bars-900 ZHANDLE 4 20 0,2 75
MZ-RM-C900-03 Seat - 900 ZSEAT 4 200 0,2 751
MZ-RM-C900-04 Wheels-900 ZWHEEL 6,9 100 0,3 657
MZ-RM-C900-05 Forks-900 ZFORK 15,8 150 0,8 2253
MZ-RM-C900-06 Brakes-900 ZBRAKES 13,8 20 0,7 263
MZ-RM-C900-07 Drive Train-900 ZTRAIN 43,5 10 2,2 413
MZ-RM-C950-01 Frame-950 ZFRAME 189,8 70 9,5 12620
MZ-RM-C950-02 Handle Bars-950 ZHANDLE 6,9 35 0,3 229
MZ-RM-C950-03 Seat - 950 ZSEAT 6,9 40 0,3 262
MZ-RM-C950-04 BKC-950 Wheels ZWHEEL 8,6 100 0,4 820
MZ-RM-C950-05 Forks-950 ZFORK 27,6 25 1,4 656
MZ-RM-C950-06 Brakes-950 ZBRAKES 17,3 50 0,9 819
MZ-RM-C950-07 Drive Train-950 ZTRAIN 79,4 30 4 2262
MZ-RM-C990-01 BKC-990 Frame ZFRAME 335,2 200 16,8 63696
MZ-RM-C990-02 BKC-990 Handle Bars ZHANDLE 11,6 100 0,6 1098
MZ-RM-C990-03 BKC-990 Seat ZSEAT 11,6 10 0,6 110
MZ-RM-C990-04 BKC-990 Wheels ZWHEEL 14,5 10 0,7 137
MZ-RM-C990-05 BKC-990 Forks ZFORK 46,2 20 2,3 879
MZ-RM-C990-06 BKC-990 Brakes ZBRAKES 28,9 200 1,4 5491
MZ-RM-C990-09 BKC-990 Drive Train ZTRAIN 115,6 100 5,8 10982
MZ-RM-M500-01 Frame-500 ZFRAME 114,4 150 5,7 16305
MZ-RM-M500-02 Handle Bars-500 ZHANDLE 9,5 20 0,5 181
MZ-RM-M500-03 Seat - 500 ZSEAT 9,5 40 0,5 363
MZ-RM-M500-04 Wheels-500 ZWHEEL 16,7 100 0,8 1586
MZ-RM-M500-05 Forks-500 ZFORK 38,1 25 1,9 906
41MZ-RM-M500-06 Brakes-500 ZBRAKES 33,4 50 1,7 1585
MZ-RM-M500-07 Derailleur Gears-500 ZGEARS 57,2 150 2,9 8152
MZ-RM-M500-08 Pedal Kit-500 ZPEDAL 28,6 20 1,4 544
MZ-RM-M500-09 Drive Train-500 ZTRAIN 124 10 6,2 1178
MZ-RM-M500-10 Shock Kit-500 ZSHOCK 28,6 10 1,4 272
MZ-RM-M525-01 BKR-525 Frame ZFRAME 208,3 5 10,4 990
MZ-RM-M525-02 BKM-525 Handle Bars ZHANDLE 14,4 200 0,7 2730
MZ-RM-M525-03 BKM-525 Seat ZSEAT 14,4 100 0,7 1365
MZ-RM-M525-04 BKM-525 Wheels ZWHEEL 18 150 0,9 2559
MZ-RM-M525-05 BKM-525 Forks ZFORK 57,5 20 2,9 1092
MZ-RM-M525-06 BKM-525 Brakes ZBRAKES 35,9 10 1,8 341
BKM-525 Derailleur
MZ-RM-M525-07 Gears ZGEARS 107,8 10 5,4 1024
MZ-RM-M525-08 BKM-525 Pedal Kit ZPEDAL 43,1 20 2,2 819
MZ-RM-M525-09 BKM-525 Drive Train ZTRAIN 165,2 25 8,3 3924
MZ-RM-M525-10 BKM-525 Shock Kit ZSHOCK 35,9 50 1,8 1706
MZ-RM-M550-01 Frame-550 ZFRAME 669,1 150 33,5 95344
MZ-RM-M550-02 Handle Bars-550 ZHANDLE 38,2 20 1,9 726
MZ-RM-M550-03 Seat - 550 ZSEAT 38,2 10 1,9 363
MZ-RM-M550-04 Wheels-550 ZWHEEL 47,8 10 2,4 454
MZ-RM-M550-05 Forks-550 ZFORK 152,9 5 7,6 726
MZ-RM-M550-06 Brakes-550 ZBRAKES 95,6 200 4,8 18160
MZ-RM-M550-07 Derailleur Gears-550 ZGEARS 229,4 100 11,5 21793
MZ-RM-M550-08 Pedal Kit-550 ZPEDAL 114,7 50 5,7 5448
MZ-RM-M550-09 Drive Train-550 ZTRAIN 382,3 150 19,1 54482
MZ-RM-M550-10 Shock Kit-550 ZSHOCK 95,6 20 4,8 1816
MZ-RM-R100-01 BKR-100 Frame ZFRAME 145,9 10 7,3 1386
MZ-RM-R100-02 BKR-100 Handle Bars ZHANDLE 2,9 10 0,1 27
MZ-RM-R100-04 BKR-100 Seat ZSEAT 2,9 5 0,1 14
MZ-RM-R100-05 BKR-100 Wheels ZWHEEL 5,7 10 0,3 54
MZ-RM-R100-06 BKR-100 Forks ZFORK 20 10 1 190
MZ-RM-R100-07 BKR-100 Brakes ZBRAKES 11,4 20 0,6 217
MZ-RM-R100-08 BKR-100 Derailleur Gears ZGEARS 31,5 200 1,6 5977
MZ-RM-R100-09 BKR-100 Pedal Kit ZPEDAL 17,2 100 0,9 1630
MZ-RM-R100-10 BKR-100 Drive Train ZTRAIN 42,9 150 2,1 6113
MZ-RM-R200-01 BKR-200 Frame ZFRAME 701,4 20 35,1 13326
MZ-RM-R200-02 BKR-200 Handle Bars ZHANDLE 20,6 40 1 784
MZ-RM-R200-03 BKR-200 Seat ZSEAT 20,6 50 1 980
MZ-RM-R200-04 BKR-200 Wheels ZWHEEL 61,9 150 3,1 8819
MZ-RM-R200-05 BKR-200 Forks ZFORK 165 20 8,3 3136
MZ-RM-R200-06 BKR-200 Brakes ZBRAKES 103,1 10 5,2 980
MZ-RM-R200-07 BKR-200 Derailleur Gears ZGEARS 288,8 10 14,4 2744
42MZ-RM-R200-08 BKR-200 Pedal Kit ZPEDAL 185,7 5 9,3 882
MZ-RM-R200-09 BKR-200 Drive Train ZTRAIN 453,8 10 22,7 4311
MZ-RM-R300-01 BKR-300 Frame ZFRAME 1730,2 10 86,5 16437
MZ-RM-R300-02 BKR-300 Handle Bars ZHANDLE 86,5 20 4,3 1644
MZ-RM-R300-03 BKR-300 Seat ZSEAT 86,5 200 4,3 16437
MZ-RM-R300-04 BKR-300 Wheels ZWHEEL 108,1 100 5,4 10273
MZ-RM-R300-05 BKR-300 Forks ZFORK 346 150 17,3 49311
MZ-RM-R300-06 BKR-300 Brakes ZBRAKES 216,3 20 10,8 4109
MZ-RM-R300-07 BKR-300 Derailleur Gears ZGEARS 519,1 10 26 4931
MZ-RM-R300-08 BKR-300 Pedal Kit ZPEDAL 259,5 10 13 2466
MZ-RM-R300-09 BKR-300 Drive Train ZTRAIN 865,1 5 43,3 4109
MZ-TG-Y120 Y120 Bike ZYOUTH 40,9 200 2 7763
MZ-TG-Y200 Y200 Bike ZYOUTH 68,1 100 3,4 6467
MZ-TG-Y240 Y240 Bike ZYOUTH 86,8 150 4,3 12366
43www.sap.com/contactsap © 2020 SAP SE or an SAP affiliate company. All rights reserved. No part of this publication may be reproduced or transmitted in any form or for any purpose without the express permission of SAP SE or an SAP affiliate company. The information contained herein may be changed without prior notice. Some software products marketed by SAP SE and its distributors contain proprietary software components of other software vendors. National product specifications may vary. These materials are provided by SAP SE or an SAP affiliate company for informational purposes only, without representation or warranty of any kind, and SAP or its affiliated companies shall not be liable for errors or omissions with respect to the materials. The only warranties for SAP or SAP affiliate company products and services are those that are set forth in the express warranty statements accompanying such products and services, if any. Nothing herein should be construed as constituting an additional warranty. SAP and other SAP products and services mentioned herein as well as their respective logos are trademarks or registered trademarks of SAP SE (or an SAP affiliate company) in Germany and other countries. All other product and service names mentioned are the trademarks of their respective companies. Please see www.sap.com/corporate-en/legal/copyright/index.epx for additional trademark information and notices.
You can also read