A 3D MAP AIDED DEEP LEARNING BASED INDOOR LOCALIZATION SYSTEM
←
→
Page content transcription
If your browser does not render page correctly, please read the page content below
The International Archives of the Photogrammetry, Remote Sensing and Spatial Information Sciences, Volume XLIII-B4-2020, 2020
 XXIV ISPRS Congress (2020 edition)

 A 3D MAP AIDED DEEP LEARNING BASED INDOOR LOCALIZATION SYSTEM
 FOR SMART DEVICES

 Y. Yang*, C. Toth, D. Brzezinska

 Dept. of Civil, Environmental and Geodetic Engineering, The Ohio State University, 470 Hitchcock Hall, 2070 Neil Avenue
 Columbus, OH 43210, USA - (yang.2695, toth.2, grejner-brzezinska.1)@osu.edu

 Commission Ⅳ, WG Ⅳ/5

KEY WORDS: Indoor localization, Deep learning, Wi-Fi fingerprinting, 3D map, Sensor fusion

ABSTRACT:

Indoor positioning technologies represent a fast developing field of research due to the rapidly increasing need for indoor location-
based services (ILBS); in particular, for applications using personal smart devices. Recently, progress in indoor mapping, including
3D modeling and semantic labeling started to offer benefits to indoor positioning algorithms; mainly, in terms of accuracy. This work
presents a method for efficient and robust indoor localization, allowing to support applications in large-scale environments. To achieve
high performance, the proposed concept integrates two main indoor localization techniques: Wi-Fi fingerprinting and deep learning-
based visual localization using 3D map. The robustness and efficiency of technique is demonstrated with real-world experiences.

 1. INTRODUCTION maps or (Taira et al., 2018) for indoor environments with dense
 RGB-D point cloud. To improve the robustness of indoor image-
Recently, the need for indoor positioning systems is rapidly based localization, deep learning was introduced for processing
growing due to the emerging indoor commercial application and representing query image on object level (Xu et al., 2017)
market, including asset tracking, personal security and and feature level (Taira et al., 2018). Specifically, Taira et al.,
entertainment (Holman, 2012) with ILBS, fueled by the (2018) demonstrated that their open sourced visual indoor
proliferation of using personal smart devices. In general, the localization system, called InLoc 1 , can achieve 40.7% at the
typical requirements of indoor positioning techniques using localization accuracy of 0.5 m by using state-of-the-art CNN-
smart devices are: low cost, high accuracy and availability in a based image retrieving method followed by the 2D-3D dense
large variety of scenarios; e.g., large-scale environments matching with CNN features. However, the InLoc can fail in the
(Anagnostopoulos et al., 2017). Since GPS devices generally photogrammetrically challenging scenarios, e.g., images contain
work poorly in indoor environment, various radio-frequency (RF) a lot of dynamic elements, such as moving people and objects.
based alternative approaches with different signals and sensors, Additionally, since lack of initial location estimation, the method
such as Wi-Fi, Bluetooth Low Energy (BLE) beacons, Radio needs to compare the query picture with all database images for
Frequency Identification (RFID), Ultra-wideband (UWB), etc., every time of operation, and thus the image retrieving
have been proposed for indoor positioning (Yassin et al., 2016). performance will be significantly decrease with the growing size
However, the main drawbacks of these technologies are low of the map.
accuracy and high cost of the required infrastructure. The typical
2D localization accuracy for Wi-Fi, BLE and RFID system varies To avoid using sensors not available in smart devices, in this
from 1-2 meters to a few tens of meters, while UWB can achieve work we integrated received signal strength (RSS)-based Wi-Fi
accuracy on a few decimeters (Anagnostopoulos, 2017; Ficco et fingerprinting positioning (WFP) with the InLoc. Since WFP is
al., 2014). On the other hand, BLE, RFID and UWB positioning robust in complex indoor environment against non-line-of-sight
systems need additional infrastructures and extra sensors on (NLoS), signal fluctuation and multipath effect (He, 2015), we
user’s end, which are not integrated in modern smart devices, use WFP to provide a coarse estimation of the position as initial
therefore the cost for using these systems are relatively high. position estimation or as the final location when the visual
 algorithm fails. In our approach, InLoc is supplied with WFP
In the commercial arena, several companies have proposed results to perform coarse-to-fine 6DOF estimation using a
indoor map solutions, such as Google Maps Indoor, or HERE RGBD-based 3D indoor map. The details of proposed method is
Indoor Maps (Li et al., 2019). Obviously, the role of indoor maps discussed in the remainder of this paper, organized as follows.
is important for achieving high performance of any indoor Section 2 reviews the techniques integrated in our indoor
localization system, besides the fundamental visualization (Li et localization system (Figure 1); which are WFP and InLoc. The
al., 2019). For example, the requirements for 3D indoor maps to field experiment setup, including building indoor maps with
support indoor navigation applications have been investigated in different representations of the environment, and results are
(Brown et al., 2013) with respect to recover the 6 degree-of- presented in Section 3. Finally, the conclusions are summarized
freedom (DOF) camera pose of a query image captured by smart in Section 4.
devices. Many methods have been proposed for this task with
different representation of 3D map data, such as (Sattler et al.,
2018; Sarlin et al., 2018) for outdoor environments with feature

* Corresponding author
1
 https://github.com/HajimeTaira/InLoc_demo

 This contribution has been peer-reviewed.
 https://doi.org/10.5194/isprs-archives-XLIII-B4-2020-391-2020 | © Authors 2020. CC BY 4.0 License. 391
The International Archives of the Photogrammetry, Remote Sensing and Spatial Information Sciences, Volume XLIII-B4-2020, 2020
 XXIV ISPRS Congress (2020 edition)

 2. THE PROPOSED SYSTEM

2.1 Wi-Fi Fingerprinting Positioning System To create the radio map in training phase, we applied the mean
 peak value to sample the RSS observations (Mallozzi et al., 1996).
In Wi-Fi fingerprinting techniques, fingerprints or signatures Such Peak-based Wi-Fi Fingerprinting (PWF) technique shows
represent the information and clues about the environment. In the robustness and improved accuracy by overcoming the RSS
case of WFP methods, the fingerprints are built from Wi-Fi variance problem (Kim et al., 2012). With the probabilistic
received signal strength. While RSS is the essential component assumptions, such as probabilistic independence or Gaussian
of fingerprints, other geo-related information, such as IP number, noise in the samples from different APs (He et al., 2015), the
MAC address of Wi-Fi access points (APs), which are helpful for matching problem is solved to obtain the posterior distribution by
localization in large-scale environments, can also be added in the using Bayes’ rule, which is described as:
fingerprint (Honkavirta et al., 2009). One typical example of !(#|%)!(%)
using IP and MAC addresses for localization is the Geolocation ( | ) = !(#)
 (1)
module in Google Maps 2 . Since the location is estimated by where ( | ) = posterior of a possible CP location by given
matching user fingerprint measurements against the fingerprint the observation
database, WFP generally consists of two phases: a training phase ( | ) = likelihood
(offline), and then a localization phase (online) (Kim et al., 2012). ( ) = prior probability
The workflow of WF algorithm used in this study is shown in
 ( ) = margin
Figure 2.
 Then the possible CP location where the maximum posterior was
 calculated, is used as 2D positioning results ( ), )).

 2.2 InLoc

 InLoc is a state-of-the-art visual indoor localization system,
 which can estimate 6DOF camera pose of a query image by using
 dense matching with an RGBD-based indoor map, including 3D
 model and image database. The pipeline of InLoc is summarized
 as follows:

 1. Given a query image taken by a smartphone, the system
 firstly retrieves N=100 most similar images from the
 whole dataset by comparing the CNN-based descriptor
 resulted from NetVLAD (Arandjelovic et al., 2016). The
 architecture of NetVLAD is shown in Figure 3.
 2. The CNN features are built with output of 17th (fine
 features: length=256) and 30th (coarse features:
 length=512) CNN layers from NetVLAD and dense
 matched in a coarse-to-fine manner, in which the
 matches of finer features are restricted by the
 correspondences of the matches of coarse features. In
 Figure 1. Overview of the proposed system. the next, the camera poses of N candidate images are
 computed using associated 3D model with Perspective-
 3-Points Random Sample Consensus (P3P-RANSAC)
 (Fischler & Bolles, 1981). Then top 10 candidates are
 picked out based on the number of RANSAC inliers.
 3. In the final pose verification step, the best 6DOF pose
 estimation is picked from the previous 10 camera poses
 by comparing the differences between the query image
 and the re-projected synthetic image.
 In this work, the original CNN model3 in InLoc is used,
 since it was trained with a bigger dataset (254,064 images)
 than our test dataset.

 Figure 2. Workflow of the Wi-Fi fingerprinting positioning Figure 3. CNN architecture with the NetVLAD layer.
 (Arandjelovic et al., 2016)
 system.

2 3
 https://developers.google.com/maps/documentation/geolocatio https://www.di.ens.fr/willow/research/netvlad/
 n/intro

 This contribution has been peer-reviewed.
 https://doi.org/10.5194/isprs-archives-XLIII-B4-2020-391-2020 | © Authors 2020. CC BY 4.0 License. 392
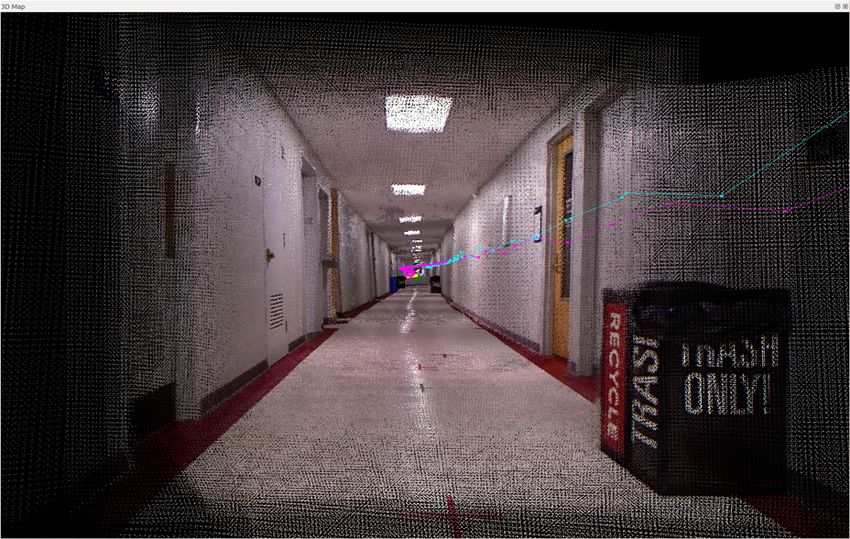
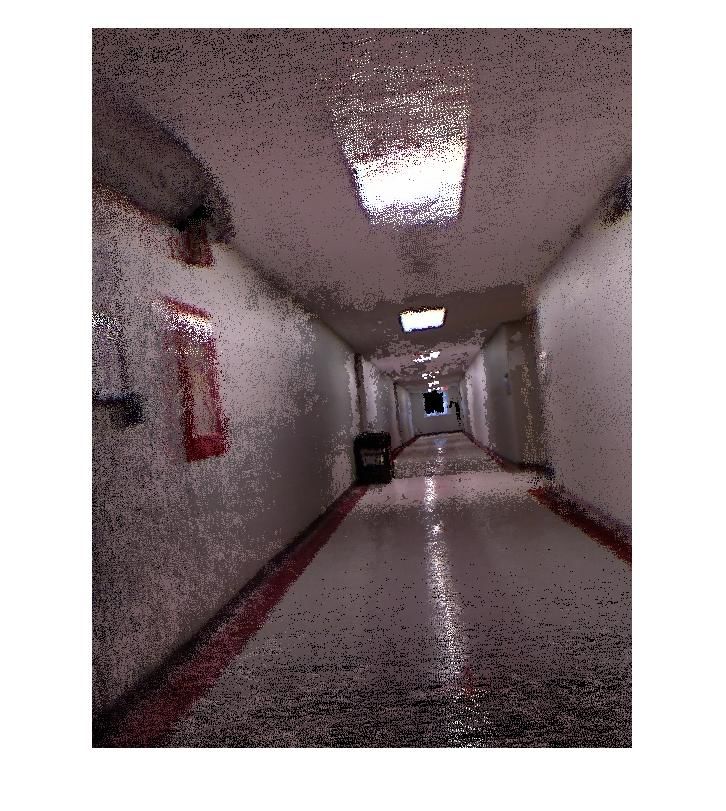
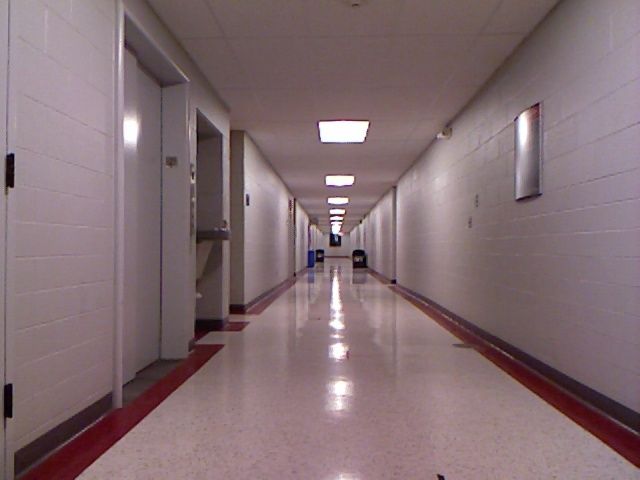
The International Archives of the Photogrammetry, Remote Sensing and Spatial Information Sciences, Volume XLIII-B4-2020, 2020
 XXIV ISPRS Congress (2020 edition)

In this work, we improve the efficiency and robustness of InLoc 3.1.1 Radio Map: For the Wi-Fi radio map, 18 calibration
by (1) applying Wi-Fi positioning results as initial information to points are used for collecting fingerprints at the center of cells.
significantly reduce the image retrieving search space as well as As a trade-off between accuracy and effort (Cherntanomwong et
the map matching space; particularly, effective in large-scale al., 2009), we set the interval between every two calibration
environment, (2) the Wi-Fi positioning results can also be offered points to 3 m, hence the length of cells is also 3 m. The
to user as the final localization estimation when InLoc failed. In measurement time of fingerprints varied from 50 to 60 seconds,
our tests, we use images with top-2 Wi-Fi fingerprinting and the MAC addresses and IP information of APs are also
matching posteriors for InLoc processing. More details of the recorded. A VAIO Z Canvas laptop was used for Wi-Fi data
methods are given in the experiment section. collection. The coordinates of CP are manually picked from 3D
 model rendered from RGBD SLAM.
 3. EXPERIMENTS
 3.1.2 3D Indoor Map: The platform used for indoor 3D
3.1 Mapping mapping is the LooMo robot with a Kinect V1 RGBD camera
 mounted on the top, see Figure 5, and data was collected at 10Hz.
The map used in this research contains two components: (1) Wi- The data is processed with an RGBD SLAM technique, named
Fi radio/fingerprint map, and (2) RGBD-based 3D indoor map, RTAB-map4 (Labbé and Michaud, 2019), which resulted in an
including RGB images, depth maps, and 3D indoor models. To indoor 3D model of about 55 million points in color, see Figure
minimize the drifting of RGBD SLAM algorithm, data was 4 b and c, 5122 key frames including RGB images (640*480),
collected in a typical office hallway (55m x 3m) at the Ohio State 3D scan data, and 6DoF camera poses.
University, see Figure 4.

 Figure 5. 3D mapping platform.
 (a) (b)
 After optimizing and noise filtering, the 3D indoor map dataset
 is integrated with the Wi-Fi radio map by (1) sampling and
 storing 5 RGB images from key frames for each cell with an
 average 0.6m interval between images, (2) the depth maps for
 each stored images are made with the registered and optimized
 3D scans within 8 m range from the camera location, see Figure
 6, (3) in order to reduce the calculation cost for the final step in
 InLoc, the 3D model of the floor is segmented and stored in each
 cell. The length of segments varies from 6m to 30m.

 (c)
 Figure 4. Experiment area (a) and the 3D model rendered by
 RTAB-map (b and c).

4
 http://introlab.github.io/rtabmap/

 This contribution has been peer-reviewed.
 https://doi.org/10.5194/isprs-archives-XLIII-B4-2020-391-2020 | © Authors 2020. CC BY 4.0 License. 393
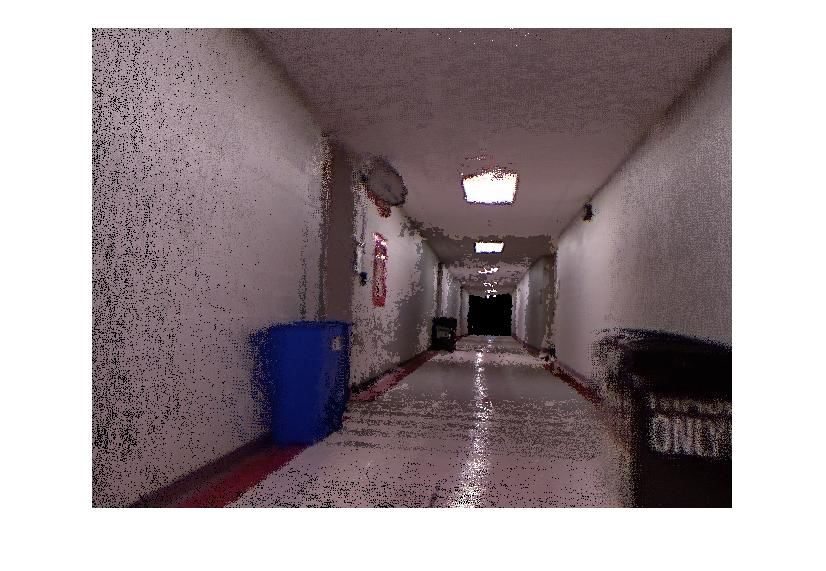
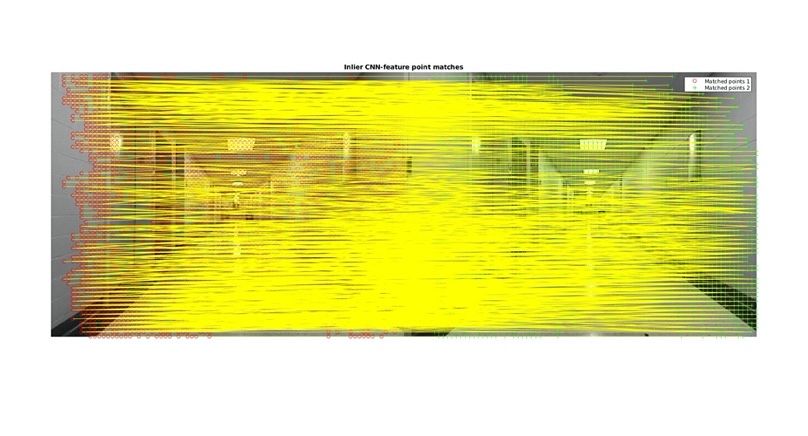
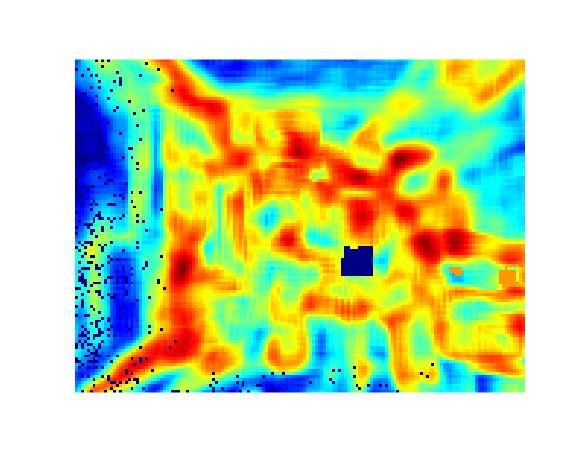
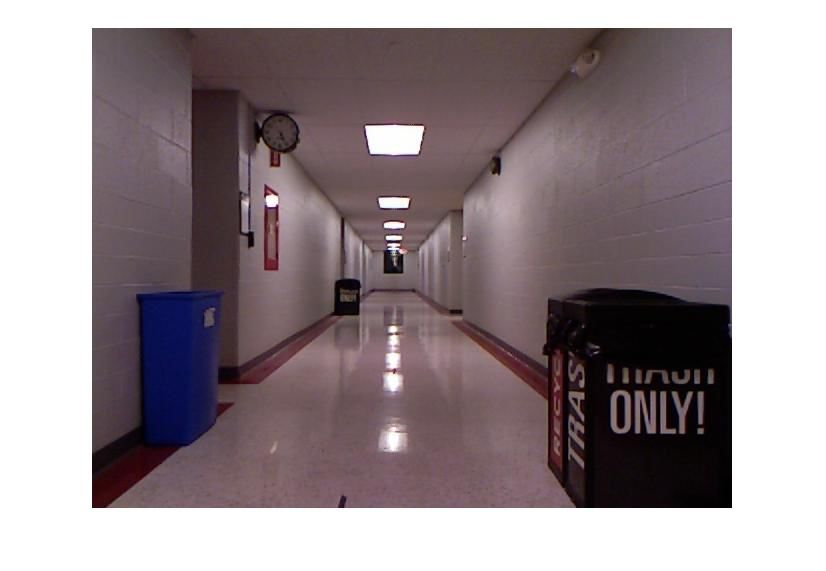
The International Archives of the Photogrammetry, Remote Sensing and Spatial Information Sciences, Volume XLIII-B4-2020, 2020
 XXIV ISPRS Congress (2020 edition)

 Figure 7. Examples of markers (left), in which CP is denoted in
 red, Group 2 test point is in black and Group 1 test point is in
 green; (Right) shows markers in the 3D model.

 3.3 Test Results

 Comparing to the original InLoc system, our workflow has
 efficiently reduced the search space for image retrieving and
 computation cost, see Table 1.
 InLoc WFP+InLoc
 Search in a certain
 Brute-force search
 region with unique IP
 Searching space in whole dataset
 and MAC address
 (global)
Figure 6. Stored RGB image (top) and corresponding depth map information (local)
 (bottom). Number of
 10 images from top-2
 candidates for 100 images
 cells after WFP
3.2 Test Data P3P-RANSAC
 Number of
Test dataset is created on 13 points, including two groups: (1) six candidates for 10 images 3 images
query images, selected from 3D map dataset with 6DoF camera pose verification
pose as ground-truth, (2) seven query images, taken by a cell
phone with 2D location ground-truth (X, Y). The Wi-Fi Table 1. Comparison of the original InLoc to our system.
fingerprints are collected on all test points with about 10 second
measuring time for each fingerprint. In order to avoid scale For the step 2 in InLoc pipeline, dense matching with CNN-based
problem, the coordinates of CP and ground-truth of test points (VGG-16) feature significantly outperforms the classic features,
are manually picked from the 3D model, according to the markers such as SURF in the texture-less hallway testing area, see Figure
of different colors, see Figure 7. Then Group 1 query images, 8, and Table 2.
associated with 6DoF camera poses are selected from the 3D map
dataset as the ones, which are closest to corresponding locations In the next step, the best pose estimation is determined by
of black markers. A SONY XPERIA X cellphone is used for Wi- evaluating image similarity on comparing local patch descriptors
Fi data collection and taking query images (2160*2880) on green between query image and synthetic image. The examples of best
markers. For Group 2 test data, Wi-Fi fingerprint is measured pose estimation on Group 1 and Group 2 data are visualized in
right after taking image on each point. For Group 1 test data, Wi- Figures 9 and 10, respectively. Warm colors denote large errors.
Fi fingerprints are collected after the robot stopped on the green
markers when 3D mapping processing is ongoing. The intrinsic
parameters of the cellphone camera are calculated with
MATLAB camera calibration function, and those of Kinect are
manufacturer data, which are used in RTAB-map as default
setting.

 This contribution has been peer-reviewed.
 https://doi.org/10.5194/isprs-archives-XLIII-B4-2020-391-2020 | © Authors 2020. CC BY 4.0 License. 394
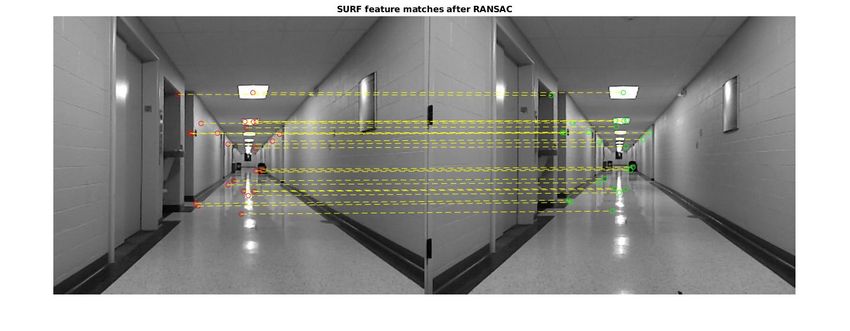
The International Archives of the Photogrammetry, Remote Sensing and Spatial Information Sciences, Volume XLIII-B4-2020, 2020
 XXIV ISPRS Congress (2020 edition)

Figure 8. RANSAC feature matching inliers with CNN features
 (top) and SURF (bottom) on Group 1 testing data.

 Matching method Inliers
 CNN feature + RANSAC 3742
 SURF + RANSAC 23
Table 2. Comparison on feature matching performance between
 CNN and SURF features in texture-less area.

The statistic of localization and pose estimation (for group 1
data) performance are summarized in Table 3.
 Localization ME of Horizontal MAE of Rotation
 method localization (m) estimation (radian)
 WFP (Group 1
 1.39 NAN
 data)
 WFP (Group 2
 1.54 NAN
 data)
 WFP + InLoc
 1.06 0.13
 (Group 1 data)
 WFP + InLoc
 0.44 NAN
 (Group 2 data)
 Table 3. Mean absolute error of rotation and mean error of
 horizontal localization estimation with different positioning
 methods and test datasets.

 Figure 9. Example of pose verification with synthetic image
 (2nd row) on Group 1 data (1st row) and error map.

 Figure 11. CDF of horizontal localization error of WFP and
 WFP + InLoc with 13 test datasets.

 This contribution has been peer-reviewed.
 https://doi.org/10.5194/isprs-archives-XLIII-B4-2020-391-2020 | © Authors 2020. CC BY 4.0 License. 395
The International Archives of the Photogrammetry, Remote Sensing and Spatial Information Sciences, Volume XLIII-B4-2020, 2020
 XXIV ISPRS Congress (2020 edition)

 results. Note that the performance of system with Group 2 data is
 better than with Group 1 data. The reason may be related to the
 accuracy of intrinsic parameters. Most of the WFP + InLoc
 localization results are better than WFP, though the error budget
 is higher than WFP, as plotted in Figure 11. Clearly, the quality
 of the 3D model directly impacts the performance of InLoc (Taira
 et al., 2018). Note that the quality of 3D model in this study is
 limited by the performance of RGBD SLAM on data obtained by
 inexpensive sensors.

 4. CONCLUSION

 In this study, we have demonstrated the efficiency of our system
 in terms of increased search and computation speed. With the
 help of InLoc, the localization performance is better than using
 only WFP. However, the localization accuracy is impact by the
 quality of 3D model. In the future work, we will try to (1) make
 improvement on the quality of 3D model, and then (2) test the
 system on large-scale indoor environment.

 REFERENCES

 Anagnostopoulos, G. (2017). Addressing Crucial Issues of
 Indoor Positioning Systems, 2017, University of Geneva.

 Anagnostopoulos, G. G., Deriaz, M., Gaspoz, J., Konstantas, D.,
 & Guessous, I. (2017). Navigational needs and requirements of
 hospital staff: Geneva university hospitals case study. 2017
 International Conference on Indoor Positioning and Indoor
 Navigation (IPIN), pp. 1-8.

 Arandjelovic, R., Gronat, P., Torii, A., Pajdla, T., & Sivic, J.
 (2016). NetVLAD: CNN architecture for weakly supervised
 place recognition. Proceedings of the IEEE Conference on
 Computer Vision and Pattern Recognition, pp. 5297-5307.

 Brown, G., Nagel, C., Zlatanova, S., & Kolbe, T. H. (2013).
 Modelling 3D topographic space against indoor navigation
 requirements. Progress and new trends in 3D geoinformation
 sciences (pp. 1-22) Springer.

 Cherntanomwong, P., Takada, J., Tsuji, H., 2009. Signal
 subspace interpolation from discrete measurement samples in
 constructing a database for location fingerprint technique. IEICE
 Transactions on Communications 92 (9), 2922-2930.

 Ficco, M., Palmieri, F., & Castiglione, A. (2014). Hybrid indoor
 and outdoor location services for new generation mobile
 terminals. Personal and Ubiquitous Computing, 18(2), 271-285.

 Fischler, M.A., & Bolles, R.C. (1981). Random sample
 consensus: a paradigm for model fitting with applications to
 image analysis and automated cartography. Communications of
 the ACM 24 (6), 381-395.

 He, S., & Chan, S. G. (2015). Wi-fi fingerprint-based indoor
 positioning: Recent advances and comparisons. IEEE
 Communications Surveys & Tutorials, 18(1), 466-490.

 Holman, C. Passively mapping WiFi device positions in to a
 virtual world (Vol. 121031). Tech. Rep.
 Figure 10. Example of pose verification with synthetic image
 (2nd row) on Group 2 data, in which the image contains a Honkavirta, V., Perala, T., Ali-Loytty, S., & Piché, R. (2009). A
 moving person (1st row) and error map. comparative survey of WLAN location fingerprinting
 methods. Positioning, Navigation and Communication, 2009.
The Table 3 shows that the horizontal positioning accuracy WPNC 2009. 6th Workshop on, pp. 243-251.
increased after InLoc process compared to WFP standalone

 This contribution has been peer-reviewed.
 https://doi.org/10.5194/isprs-archives-XLIII-B4-2020-391-2020 | © Authors 2020. CC BY 4.0 License. 396
The International Archives of the Photogrammetry, Remote Sensing and Spatial Information Sciences, Volume XLIII-B4-2020, 2020
 XXIV ISPRS Congress (2020 edition)

Kim, Y., Shin, H., & Cha, H. (2012). Smartphone-based wi-fi
pedestrian-tracking system tolerating the RSS variance
problem. Pervasive Computing and Communications (PerCom),
2012 IEEE International Conference on, pp. 11-19.

Labbé, M., Michaud, F., 2019. RTAB‐Map as an open‐source
lidar and visual simultaneous localization and mapping library
for large‐scale and long‐term online operation. Journal of Field
Robotics 36 (2), 416-446.

Li, K., Zlatanova, S., Torres-Sospedra, J., Perez-Navarro, A.,
Laoudias, C., & Moreira, A. Survey on indoor map standards and
formats. 2019 International Conference on Indoor Positioning
and Indoor Navigation (IPIN), pp. 1-8.

Mallozzi, R. S., Paciesas, W. S., Pendleton, G. N., Briggs, M. S.,
Preece, R. D., Meegan, C. A., et al. (1996). The ν F ν peak energy
distributions of gamma-ray bursts observed by BATSE. AIP
Conference Proceedings, , 384. (1) pp. 204-208.

Sarlin, P., Cadena, C., Siegwart, R., & Dymczyk, M. (2019).
From coarse to fine: Robust hierarchical localization at large
scale. Proceedings of the IEEE Conference on Computer Vision
and Pattern Recognition, pp. 12716-12725.

Sattler, T., Maddern, W., Toft, C., Torii, A., Hammarstrand, L.,
Stenborg, E., et al. (2018). Benchmarking 6dof outdoor visual
localization in changing conditions. Proceedings of the IEEE
Conference on Computer Vision and Pattern Recognition, pp.
8601-8610.

Taira, H., Okutomi, M., Sattler, T., Cimpoi, M., Pollefeys, M.,
Sivic, J., et al. (2018). InLoc: Indoor visual localization with
dense matching and view synthesis. Proceedings of the IEEE
Conference on Computer Vision and Pattern Recognition, pp.
7199-7209.

Xu, H., Koppanyi, Z., Toth, C., Grejner-Brzezinska, D., 2017.
Indoor Localization using Region-based Convolutional Neural
Network, In: Proceedings of the 2017 International Technical
Meeting of ION.

Yassin, A., Nasser, Y., Awad, M., Al-Dubai, A., Liu, R., Yuen,
C., et al. (2016). Recent advances in indoor localization: A survey
on theoretical approaches and applications. IEEE
Communications Surveys & Tutorials, 19(2), 1327-1346.

 This contribution has been peer-reviewed.
 https://doi.org/10.5194/isprs-archives-XLIII-B4-2020-391-2020 | © Authors 2020. CC BY 4.0 License. 397

You can also read