Level(s) indicator 5.1: Protection of occupier health and thermal comfort - User manual: introductory briefing, instructions and guidance ...
←
→
Page content transcription
If your browser does not render page correctly, please read the page content below
Level(s) indicator 5.1:
Protection of occupier
health and thermal
comfort
                     User manual: introductory
                     briefing, instructions and
                     guidance
                     (Publication version 1.1)
                     Nicholas Dodd, Shane Donatello,
                     Mauro Cordella (JRC, Unit B.5)

                     January 2021

                 1
European Commission
Joint Research Centre
Directorate B, Growth and Innovation
Unit 5, Circular Economy and Industrial Leadership

Contact information
Shane Donatello
Address: Edificio Expo. c/ Inca Garcilaso, 3. E-41092 Seville (Spain)
E-mail: jrc-b5-levels@ec.europa.eu
https://ec.europa.eu/jrc
https://susproc.jrc.ec.europa.eu/product-bureau/product-groups/412/home

Legal Notice
This publication is a Technical Report by the Joint Research Centre, the European Commission’s in-
house science service. It aims to provide evidence-based scientific support to the European policy-
making process. The scientific output expressed does not imply a policy position of the European
Commission. Neither the European Commission nor any person acting on behalf of the Commission
is responsible for the use which might be made of this publication.

How to cite: Dodd N., Donatello S. & Cordella M., 2021. Level(s) indicator 5.1 Protection of occupier
health and thermal comfort user manual: introductory briefing, instructions and guidance (Publication
version 1.1)

Title
Level(s) indicator 5.1 Protection of occupier health and thermal comfort user manual: introductory
briefing, instructions and guidance (Publication version 1.1)

Abstract

Developed as a common EU framework of core indicators for assessing the sustainability of office
and residential buildings, Level(s) can be applied from the very earliest stages of conceptual design
through to the projected end of life of the building. As well as environmental performance, which is
the main focus, it also enables other important related performance aspects to be assessed using
indicators and tools for health and comfort, life cycle cost and potential future risks to performance.

Level(s) aims to provide a common language of sustainability for buildings. This common language
should enable actions to be taken at building level that can make a clear contribution to broader
European environmental policy objectives. It is structured as follows:

    1.   Macro-objectives: An overarching set of 6 macro-objectives for the Level(s) framework that
         contribute to EU and Member State policy objectives in areas such as energy, material use,
         waste management, water and indoor air quality.
    2.   Core Indicators: A set of 16 common indicators, together with a simplified Life Cycle
         Assessment (LCA) methodology, that can be used to measure the performance of buildings
         and their contribution to each macro-objective.

In addition, the Level(s) framework aims to promote life cycle thinking. It guides users from an initial
focus on individual aspects of building performance towards a more holistic perspective, with the aim
of wider European use of Life Cycle Assessment (LCA) and Life Cycle Cost Assessment (LCCA)
methods.

                                          2
Contents

The Level(s) document structure .................................................................................................................. 4
How this indicator user manual works ......................................................................................................... 5
Introductory briefing..................................................................................................................................... 6
Instructions on how to use the indicator at each level ................................................................................ 8
   Instructions for Level 1 .............................................................................................................................. 8
   Instructions for Level 2 ............................................................................................................................ 11
Guidance and further information for using the indicator ......................................................................... 13
   Instructions for using Level 2 .................................................................................................................. 13
      L2.2. Step 8: Projected weather file time representativeness and uncertainty .................................. 13

                                                                             3
The Level(s) document structure
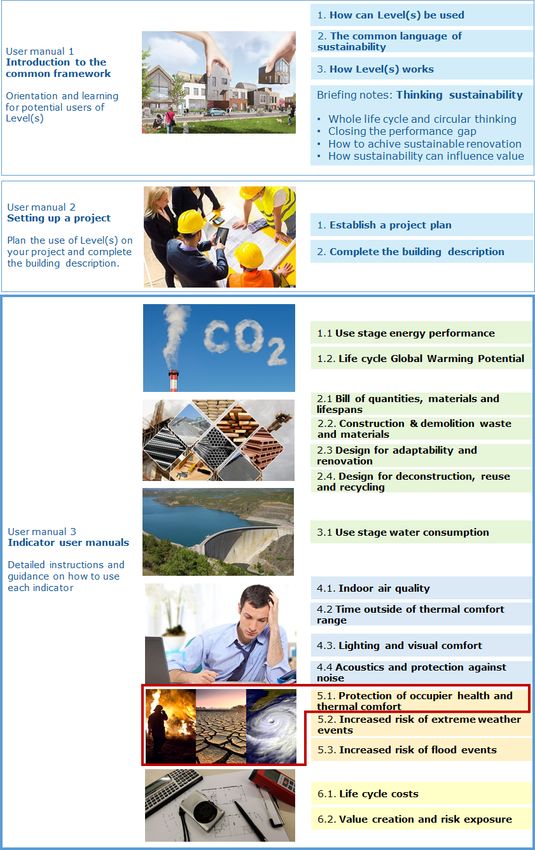
Figure 1. The Level(s) document structure
4How this indicator user manual works
Level(s) is a framework of core indicators of sustainability that can be applied to building projects in order to report
on and improve their performance. The supporting documentation has been designed to be accessible to all the
actors that may be involved in this process.
If you are new to the assessment of building sustainability, we recommend reading the first part of the Level(s) user
manual. This will provide you with an introduction to the basic concepts behind Level(s) and how you can apply it
to a building project.
If you haven’t yet set up your building project to use Level(s), including completing the project plan and the building
description, then we recommend reading the second part of the Level(s) user manual.
This indicator user manual forms part of the third part of the Level(s) user manual where you will find instructions
on how to use the indicators themselves. It is designed to help you apply your chosen indicator to a building project.
It will help you to do this in the following way:
• Introductory briefing: This section provides an overview of the indicator, including:
why you may wish to measure performance with it,
what it measures,
at which stages in a project it can be used,
the unit of measurement, and
the relevant calculation method and reference standards.
• Instructions on how to use the indicators at each level: This section provides:
step by step instructions for each level,
what is needed to make an assessment,
a design concept checklist (at Level 1), and
the reporting formats.
The instructions often refer to the guidance and further information section, which can be found after the
instructions.
• Guidance and further information for using the indicator: This section provides more background
information and guidance to support you in following specific steps in the instructions, including the design
concepts introduced at Level 1 and the practical steps to calculate or measure performance at Levels 2 and
3. They are all cross-referenced to specific instruction steps at either level 1, 2 or 3.
This indicator user manual is structured so that once you are familiar with using the indicator and you know how to
work with it, you may no longer need to refer to the guidance and background information, but only work directly
with the instructions at the level of your choice.
5Introductory briefing
Why measure performance with this indicator?
The design of more climate change proof buildings requires a focus on adaptation measures that can be incorporated
into buildings now or, if necessary, are possible to incorporate at a future point in time.
This indicator makes use of the same methodology described for indicator 4.2, with the difference being that instead
of using present and past weather as the basis for modelling performance, it encourages users to use projections for
future climates in 2030 and 2050 under different “degree scenarios”. By simulating and evaluating future scenarios
for the thermal comfort and resilience of a building, and by using climatic projections for 2030 and 2050 developed
by scientists, designers can identify measures that have the potential to minimise future risks and liabilities. In line
with the scenarios that form the basis for targets set at European level, one of the scenarios to be tested should be
stabilisation of CO2 emissions with a 2 degree increase in global temperatures by 2050.
This indicator has been selected to re-inforce the focus of the Energy Performance of Buildings Directive 2010/31/EU
(EPBD), as amended by Directive (EU) 2018/844 1, on measures which avoid overheating, as well as reflecting its
identification as an important aspect in the EU Strategy on adaptation to climate change 2.
This indicator also allows users to explore the potential positive influence of “green infrastructure” (also referred to
as nature-based solutions) at the building level, for which there is evidence that certain features can moderate
temperatures around a building.
What does it measure?
This indicator measures the proportion of the year when building occupiers are comfortable with the summer
thermal conditions inside a building. Linked to this it also seeks to measure the ability of a building (with and without
building services) to maintain pre-defined thermal comfort conditions during the cooling season 3.
At what stage of a project
Level Activities related to the use of indicator 5.1
1. Conceptual design (following Thermal comfort risk assessment as part of the design of the building.
design principles) Selection of tailored solutions for major renovation works.
2. Detailed design and Calculated building permitting assessment - as part of an overheating assessment
construction (based on
calculations, simulations and Consideration of different aspects of thermal comfort, including localised
drawings) discomfort effects
Measured EPB assessment sub types: climate corrected, use corrected or standard
3. In-use performance (based on
Commissioning: functional performance testing
commissioning, testing and
metering) Comparison of estimated satisfaction levels with those obtained from occupier
surveys.
The related additional cooling consumption can also be reported in terms of primary energy demand using indicator
1.1 and projected life cycle costs using indicator 6.1.
The unit of measurement
The unit of measurement is the percentage of the time out of range from defined maximum temperatures during
the cooling seasons. The reference temperature range shall be 18oC to 27oC.
1
Directive (EU) 2018/844 of the European Parliament and of the Council of 30 May 2018 amending Directive 2010/31/EU on the energy
performance of buildings and Directive 2012/27/EU on energy efficiency
2
COM(2013)216, Communication from the Commission to the Council, the European Parliament, the European Economic and Social
Committee and the Committee of the Regions, An EU Strategy on Adaptation to Climate Change
3
The EU Energy Poverty Observatory and the EU Building Stock Observatory provide data and indicators in relation to the comfort conditions of
Europe’s building stock
6The performance of a building should be assessed with and without mechanical cooling. The reported performance
shall apply to those spaces or zones that account for >10% of the total useful floor area of the building.
System boundary
The assessment boundary is the building. Heat losses and gains, both internal and external, that may affect the
comfort conditions within the building, as well as the cooling energy that may be required to maintain these
conditions, are to be factored into calculations.
Scope
The scope of the indicator shall comprise the internal operating temperature and comfort condition of the occupiers
within the building.
Buildings which have full or mixed mode mechanical cooling shall additionally assess the performance of the building
fabric without these mechanical systems operating. The same shall apply to buildings with central heating systems.
This is intended to assess the inherent thermal resilience of the building envelope.
Calculation method and reference standards
Calculation of the reported performance shall be based on a dynamic energy simulation and in accordance with the
method described in Annex A.2 of EN 16798-1. An overheating assessment that forms part of a National Calculation
Method shall be accepted if it is based on a dynamic simulation method. If a more advanced calculation method is
used, it shall be compliant with the ISO EN 52000-1 series.
Dynamic simulations shall be carried out using weather files for the location or region that are based on authoritative
climatic projections for 2030 and 2050. The modelling shall, as a minimum, be based on the UN IPCC 'mitigation'
(SRES E1 or RCP 6.0) emissions scenario. A second worst case scenario 'medium-high' (SRES A1B or RCP 2.6)
emissions scenario may also be considered. The source of the climatic projections and associated weather files for
2030 and 2050 shall be clearly reported.
7Instructions on how to use the indicator at each level
Instructions for Level 1
L1.1. The purpose of this level
This level is for those users who would like to:
• Assess the risks of occupier thermal discomfort during the cooling seasons for the building type being
assessed.
• Understand and identify measures that can be taken to future-proof a building’s thermal environment
and/or incorporate adaptation measures.
L1.2. Step-by-step instructions
1. Determine the required level of thermal comfort necessary/required for the spaces within the building, in
line with national / regional building codes
2. Consult the checklist under L1.4 of thermal comfort design concepts and read the background
descriptions in the Level 1 technical guidance
3. Within the design team, review literature for local area /region in respect to projected future climate
change and identify the extent of anticipate change. Check also for associated local building codes and
requirements.
4. Taking into account the degree of anticipated climate change, review how the thermal comfort design
concepts can be introduced into the design process.
5. Once the design concept is finalised with the client, record the thermal comfort design concepts that were
taken into account using the L1 reporting format.
L1.3. Who should be involved and when
Actors involved at the conceptual design stage, led by the concept architect and engineers. The thermal comfort
design concepts can be translated into detailed designs once professionals such as service engineers, energy
auditors, energy/sustainability consultants and quantity surveyors become involved in the project.
L1.4. Checklist of thermal comfort design concepts
The following thermal comfort design concepts have been identified from best practice and literature reviewed by
the Joint Research Centre as proxies for achieving better performance.
Although many EU Member States require some form of overheating assessment in order to obtain a building
permit, the checklist can be used to inform design concepts and to improve performance without necessarily
having to make more advanced assessments of the building’s thermal comfort conditions.
Level 1 design
Brief description
concept
A number of risk factors can be identified that can contribute to the risk of summer thermal
discomfort:
• Site location: A number of factors should be taken into account:
- Orientation will influence exposure to the sun
1. Identify and
- Obstructions such as other buildings or nearby trees may reduce solar gains
assess risk
factors - The urban microclimate may raise summer temperatures compared to data from
local weather stations
• Building design: A number of design factors can lead to excessive solar gain in summer:
- Glazing ratio: High glazing ratios on S/SE/SW facades can, without sufficient solar
control, lead to overheating.
8Level 1 design
Brief description
concept
- Insulation: Insufficient or poorly installed insulation with thermal bridging of the
building envelope
- Thermal mass: Insufficient thermal mass within the building envelope may result in
significant temperature swings.
- Aspect: Where the aspect of a residential dwelling does not allow for sufficient
natural ventilation.
- Shading: Where balconies, patios and shutters are not designed to provide adequate
shading on S/SE/SW facades
- Solar glass: Where the glazing is not specified to control infrared or ultraviolet
radiation
In some EU locations, an overheating assessment may be required and if carried out should be noted
in the Level 1 reporting.
In designing a new building or major renovation, a range of decisions influence the thermal
conditions in, on and around the building:
• Building design: Design decisions in three key areas can be used to minimise seasonal
swings in temperature and localised discomfort:
- Envelope: A high performance, insulated building envelope with effective solar
control measures will protect against outdoor conditions and minimise seasonal
swings in internal temperatures.
2. Design for - Structure: Structural designs that provide natural ventilation and exposed thermal
comfortable mass.
thermal - Servicing: Integration of heating and cooling design with the building structure and
conditions consideration of ventilation pathways. Localised indoor effects such as draughts and
hot/cold spots should be avoided.
• Landscape design: A number of nature-based design features can contribute to
moderating the surrounding microclimate:
- the presence of trees and vegetation in streets, courtyards, patios as well as on
facades and roofs
- The presence of water features such as ponds, drainage swales and fountains
- Unsealed surfaces instead of hard, paved or dark surfaces
In designing the building or major renovation, take into account:
• site specific conditions in order to better understand the microclimate. Steps that can be
taken include:
3. Take into - Reference to local weather data in order to understand the distinct seasonal,
account the site monthly, weekly and daily conditions.
specific - Reference to information about any localised microclimate conditions, such as
conditions prevailing winds, the urban heat island effect and air or noise pollution levels.
In this way, the physical design, elevations and servicing can be designed to respond to the local
climate, including the potential for passive heating/cooling, intelligent structures, high yield
renewables and useful daylighting.
In seeking to renovate a building, use information gathered in a baseline survey to adapt the
improvements to the performance and conditions of the existing building location, fabric and
landscaping, taking into account:
4. Take into
account • The orientation and exposure of facades and roofs
renovation • Existing floor layouts and ventilation pathways
specific • Existing solar control features
conditions • The seasonal response of the building fabric to weather conditions, including structural
thermal bridging
• Existing technical services (if they are to be retained and upgraded)
9Level 1 design
Brief description
concept
Information obtained from prior occupants may yield useful information about the buildings
performance.
L1.5. Reporting format
To complete the reporting format for Level 1 you should answer yes or no for each of the design concepts that you
have addressed and provide brief descriptions of the measures or decisions taken for each one.
Thermal comfort design Addressed? How has it been incorporated into the building design concept?
concept (yes/no) (provide a brief description)
1. Identify and assess risk
factors
2. Design for comfortable
thermal conditions
3. Take into account the
site specific conditions
4. Take into account
renovation specific
conditions
10Instructions for Level 2
L2.1. The purpose of this level
This level is for those users who are at the stage of having to assess the energy requirements of a building and wish
to make a quantitative assessment of the indoor thermal conditions under projected future climate conditions.
L2.2. Step-by-step instructions
These instructions should be read in conjunction with the accompanying technical guidance and supporting
information (see page 13).
Follow the same instructions as for indicator 4.2 except at for step 8 the simulation shall additionally be made for
the 2030 and 2050 climate change scenarios. With the results being reported in the additional reporting format
for indicator 5.1.
L2.3. What do you need to make an assessment?
The main items needed are as follows:
An appropriate calculation software tool that can run a dynamic simulation and which is compliant with
the national/regional calculation method for the relevant Member State and/or EN ISO 52000-1
A building design sufficiently advanced to provide the input data required to make the calculations using
the compliant calculation software tool.
Access to an authoritative set of weather data that has been obtained from modelled climate change
projections for the years 2030 and 2050. If suitable future projections are not available at national,
regional or local level, design reference weather files derived from extreme hot and cold weather events
in the last 20-30 years may be used.
Optional for going a step further: the appropriate input data and assumptions to make a dynamic
simulation according to the method described in EN 16798-1 (see L2.6)
L2.4. Who should be involved and when?
Those actors involved at the detailed design stage, led by the architect or engineer. Input data may need to be
obtained from, amongst others, the architect, service engineers, energy auditor and quantity surveyor. Simulations
may be carried out by the service engineers or energy/sustainability consultants.
L2.5. Ensuring the comparability of results
Comparative performance assessments shall be made on the basis of:
• Use of standard input data for the thermal simulation: Default input data provided as part of national /
regional calculation methods or the default data provided in Annex G of EN ISO 13790 (or EN ISO 52016-1)
shall be used. This shall include the use of standard occupancy and conditions of use data for the building
type (see Annex G.8).
• PPD thermal parameter input data: For the six parameters identified in EN ISO 7730, the default or
reference national or regional data for the building type shall be used.
• Weather data: Where made available the projected weather data set or design reference data sets for
2030 and 2050 scenarios stipulated/provided by the national or regional calculation method for
overheating shall be used.
• Heating and cooling seasons: The heating and cooling seasons defined in the relevant national calculation
method shall be used.
• Temperature ranges: The Category I temperature ranges, as stipulated in EN 16978-1 (or national
equivalent), shall be used in all cases.
11L2.6. Going a step further – Optimisation steps to improve the assessment and building performance
The following step can be taken in order to optimise the thermal simulations:
• Building occupancy and condition of use data: Real-life assumptions and values for the building shall be
used instead of the default values established by national calculation methods or laid down in EN 16798-
1.
• Site specific weather data: The use of projections that are as representative as possible of the location of
the building. This could include for the use of data sets that have been adjusted to reflect the Urban Heat
Island effect in a specific urban location.
L2.7. Format for reporting the results of an assessment
Part 1 - Climate change projections used
Basis for simulation Climate change projection of or design summer year
Weather file source
Climate change scenarios modelled e.g. IPCC E1, A1B
Part 2 - Performance assessment results
2030 scenario 2050 scenario
Performance aspect High emissions 2Co
High emissions
2oC trajectory
trajectory scenario trajectory
Time out of range (%)
- without mechanical cooling
Time out of range (%)
- with mechanical cooling
12Guidance and further information for using the indicator
For using Level 2
In this section of the manual, additional background guidance and explanations are provided for:
• L2.2. Step 8: Projected weather file time representativeness and uncertainty.
L2.2. Step 8: Projected weather file time representativeness and uncertainty
The availability of detailed projections of climate change across the EU varies, with some Member States having used
highly complex models to develop weather files. In other Member States, only high level projections developed at
EU level may be available, and designers may have to resort to the use of worse case existing scenarios for heat
waves as a proxy for future extreme weather.
The baseline year for the projection shall, as far as possible, be chosen to be consistent with those of the present
day weather file used. The level of probability for the 2030 and 2050 projections shall be reported, if available.
An additional level of precision can be introduced if any localised Urban Heat Island (UHI) effects have been factored
into the present weather files, thereby ensuring that the baseline (and projected) climate reflects any significant
local effects. This is described further in the guidance for indicator 4.2.
Learn more about:
Possible sources and background to future climate change projections and weather files
There are broadly three possible sources of climate change projections currently available to users of the
Level(s) framework. Each, in turn, is associated with an increasing level of precision and certainty:
1. Worst case scenario based on recent heat wave events: Average data for summers in which heat
wave events 4 occurred in local area during the last 30 years. An example source at EU level is the
European Climate Assessment & Dataset 5. National meteorological offices can also provide this data
based on established definitions of a heat wave event 6.
2. Dynamic downscaling of UN IPCC models to regional or local scale: Use of a weather file generator
that is based on UN IPCC General Circulation Models, such as the Climate Change World Weather file
generator 7 or the Climate Cost project 8.
3. Probabilistic downscaling of large-scale models and interpolation of regional or local weather station
data: The interpolation of local or regional weather files based on statistical modelling at a larger
scale, such as the Ensembles project 9.
The scenario E1 is a newer ‘mitigation’ scenario developed for the EU. It is intended to be representative of
the projected conditions if mitigation keeps the global temperature increase to below 2 degrees centigrade.
Weather files for E1 have been developed with reference to the EU Ensembles project. Alternatively, weather
files for the equivalent IPCC ‘RCP’ scenario could be used.
The IPCC since the 5th Assessment Report in 2014 now refer to a new set of scenarios - the Representative
Concentration Pathways (RCPs) – although A1B and E1 are referred to in the instructions because the weather
files that are available were developed prior to the new RCP scenarios being developed. In terms of
4 According to the World Meteorological Organisation a heat wave is defined as when ‘the daily maximum temperature of more than five
consecutive days exceeds the average maximum temperature by 5 °C, the normal period being 1961-1990’
5 European Climate Assessment & Dataset project, http://www.ecad.eu/
6 See the following example for Spain – AEMET, AEMET analiza las "olas de calor" registradas en España desde 1975
http://www.aemet.es/en/noticias/2015/05/olasdecalor
7
University of Southampton, Climate Change World Weather File Generator for World-Wide Weather Data – CCWorldWeatherGen, Energy and
Climate Change Division, UK http://www.energy.soton.ac.uk/ccworldweathergen/
8 ClimateCost, http://www.climatecost.cc/
9 ENSEMBLES, Project overview, http://ensembles-eu.metoffice.com/index.html
13equivalence between both A1B and the EU E1 scenario, A1B is closest to RCP6.0 (high CO2 emissions) and E1
to RCP2.6 (mitigation to achieve 2oC stabilisation).
14You can also read