2020 US CONSUMER BEHAVIOR REPORT - TURNING CONSUMER INSIGHTS INTO VA LUA B LE CUS TOMER INTER AC TIONS - FIS
←
→
Page content transcription
If your browser does not render page correctly, please read the page content below
2020 US
CONSUMER
BEHAVIOR
REPORT
TURNING CONSUMER INSIGHTS INTO
VALUABLE CUSTOMER INTER AC TIONS
METHODOLOGY

In August 2019, we commissioned the global online
market research firm Dynata to survey a representative
sample of over 2,500 consumers across the US and
analyze their purchasing behavior across different
buying channels.

We’ve split out some of the findings by age range to
highlight the interesting differences between each
generation’s shopping habits. For this report, the
generations were divided as follows:

GENER ATION –Z (1998 - 20 01)      18 —21 Y E A RS OLD
MILLENIA L S/
GENER ATION Y (198 4 - 1997)       22—35 Y E A RS OLD
GENER ATION –X (1970 - 198 3)      36 — 49 Y E A RS OLD
B A BY BOOMERS (1950 - 1969)       50 — 69 Y E A RS OLD

Respondents were selected from those registered with
Dynata to participate in online surveys, therefore no
sampling error estimates can be calculated. All sample
surveys and polls may be subject to multiple sources of
error, including but not limited to sampling, coverage,
and measurement. The margin of error is +/- 1.6% at
the 90% confidence level with our sample size.

Please note that for single response questions, total
responses may not add up to 100% due to rounding.
For multi-response questions, totals do not add up to
100% as more than one response could be selected.

CONTENTS
   INTRODUCTION

   WELCOME TO THE 2020 US
   CONSUMER BEHAVIOR REPORT
   PA RT 1

   MOBILE AND SOCIAL:
   THE NEW NORMAL
                SEC TION 1: THE RISE OF SOCIAL SHOPPING
                SEC TION 2: THE MOBILE E XPERIENCE
                SEC TION 3: DELIVERY: GET IT QUICKER OR GET IT CHE APER

   PA RT 2

   BIOMETRICS AND FRAUD:
   HOW TO PROTECT YOUR
   BUSINESS IN 2020 AND BEYOND
                SEC TION 1: ARE CONSUMERS ON BOARD WITH BIOMETRIC S?
                SEC TION 2: FR AUD AND PERSONAL DATA

   PA RT 3

   WHAT OUR PAYMENT
   PREFERENCES MEAN
   FOR THE FUTURE
                SEC TION 1: INTELLIGENT PAYMENTS
                SEC TION 2: GOING C A SHLESS?

   CONCLUSION

   KEY TAKEAWAYS
                LE ARNINGS FROM OUR REPORT
W O R L D PAY F I S : 2 0 2 0 U S CO N S U M E R B E H AV I O R R E P O R T   INTRODUCTION

4

W O R L D PAY F I S : 2 0 2 0 U S CO N S U M E R B E H AV I O R R E P O R T   INTRODUCTION

Welcome to the
2020 US consumer
behavior report

The face of retail is constantly changing. The engine
of that change is the sum of consumer behavior.
Consumers drive change through the expression of
their evolving needs, desires, and expectations—all in
the context of today’s technology.

Retailers work tirelessly to provide customer
experiences that meet and exceed these evolving
expectations. The foundation of that work starts with
a more complete understanding of consumer behavior
as it exists today.

The 2020 US Consumer Behavior Report is part of
Worldpay’s ongoing efforts to help US retailers better
understand their customers. We explore how US
consumers are buying, how they are paying, and what
they think about topics such as new payment methods.

We’ll probe the deepening connections between
shopping and social media, while also understanding
their fears around data hacking and fraud. We
examine mobile purchasing and the ways in which
consumers are adjusting to biometrics. We look at
the future of cash and ask consumers, “What if cash
was no longer available?”

Worldpay’s 2020 US Consumer Behavior Report offers
actionable insights based on these behaviors with an
emphasis on payments, an essential building block of
superior customer experiences.
                                                                                             5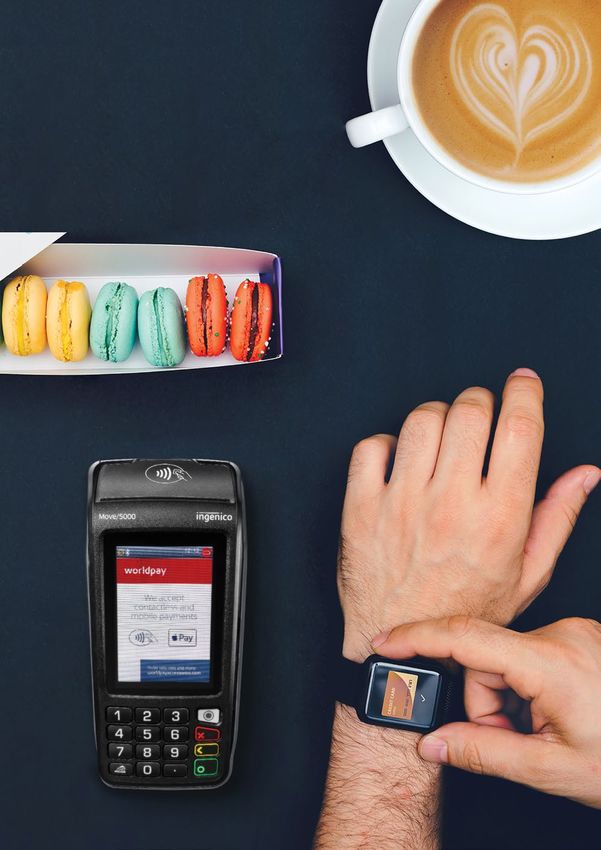
W O R L D PAY F I S : 2 0 2 0 U S CO N S U M E R B E H AV I O R R E P O R T   PA R T 1 — M O B I L E A N D S O C I A L : T H E N E W N O R M A L

PART 1

MOBILE AND
SOCIAL: THE
NEW NORMAL

The growth of online shopping
and the use of mobile devices
means that consumers are now
shopping anytime, anywhere,
and on virtually any device.

But that doesn’t mean anything goes. Convenience is
vital as commerce becomes more mobile and more
social—while a foundation of trust and security remains
as important as ever.

In this section, we’ll explore the ways in which mobile
and social media-driven purchasing have become
second nature to many consumers—and ways retailers
can respond.

6
W O R L D PAY F I S : 2 0 2 0 U S CO N S U M E R B E H AV I O R R E P O R T   PA R T 1 — M O B I L E A N D S O C I A L : T H E N E W N O R M A L

                                                                                                                                                   7
W O R L D PAY F I S : 2 0 2 0 U S CO N S U M E R B E H AV I O R R E P O R T     PA R T 1 - S EC T I O N 1 : T H E R I S E O F S O C I A L S H O P P I N G

                                                         PA RT 1 — SEC TION 1

                                                         THE RISE
                                                         OF SOCIAL
                                                         SHOPPING

8
W O R L D PAY F I S : 2 0 2 0 U S CO N S U M E R B E H AV I O R R E P O R T   PA R T 1 - S EC T I O N 1 : T H E R I S E O F S O C I A L S H O P P I N G

Gen Z and
the power of
social media

Social media has grown so                                                     The power of social among this demographic is
                                                                              something that brands are eager to tap into. Our survey
much that it’s difficult to                                                   found 85% of Gen Z respondents follow brands on social
imagine a world without it.                                                   media, with nearly half making purchases via social
                                                                              media platforms. Among those Gen Z respondents
That’s especially true for Gen Z,                                             who have made purchases via social media, more than
who’ve only known a world                                                     a third (34%) do so every day.

where social media was part                                                   The combination of mobile and social is increasingly
of their daily lives.                                                         proving to be a perfect setting for commerce. New
                                                                              payment integrations like mobile wallets and buy-now-
                                                                              pay-later options are making purchases on social media
                                                                              platforms easier and more convenient than ever. Social
                                                                              commerce is opening doors for brands to connect with
                                                                              consumers where they are—and to deliver frictionless
                                                                              customer experiences.

                                                                              34
                                                                              OF GEN Z- ERS MAKE PURCHA SES THROUGH
                                                                              SOCIAL MEDIA E VERY SINGLE DAY
                                                                                                                       %

                                                                                                                                                          9
W O R L D PAY F I S : 2 0 2 0 U S CO N S U M E R B E H AV I O R R E P O R T                 PA R T 1 - S EC T I O N 1 : T H E R I S E O F S O C I A L S H O P P I N G

What type of brands attract the
most followers on social?

Social media creates opportunities for virtually every
type of brand to engage with their customers—although
some verticals may find traction easier than others
when it comes to social commerce.

Among all US consumers surveyed, food and
restaurant brands have the highest overall social media
following, with clothing and footwear businesses
a close second. There are often substantial variations
across generations: clothing brands resonate most
strongly with Gen Z (73%) and least with Boomers
(41%). Almost two-thirds (66%) of Millennials follow
food and restaurant brands, while Baby Boomers
were most likely of all generations to follow charities
and nonprofits.

THE T YPES OF COMPANIES OR BR ANDS OUR RESPONDENTS SAID THE Y FOLLOW ON SOCIAL MEDIA

                                                                              8%

     59                     %                                                 OTHER
                                                                                                    23              %                                        39%
                                                                              25
                                                                                                           GAMBLING/                                                    ELEC TRONIC S
                                                                                   %                        GAMING

            CLOTHING/FOOT WE A R

                                                                                                                                                                            22%
                                                                                                      62                         %
                                                                               A IRLINE S

 28             %                                                                                                                                                           AUTOMOBILE S/

CH A RIT Y/NONPROFIT
                                                       28%                                                                                                                  MOTORC YCLE S

                                                                                                                 FOOD/RE S TAUR A NTS
                                                                     HOTEL

10
W O R L D PAY F I S : 2 0 2 0 U S CO N S U M E R B E H AV I O R R E P O R T PA R T 1 - S EC T I O N 1 : T H E R I S E O F S O C I A L S H O P P I N G
11W O R L D PAY F I S : 2 0 2 0 U S CO N S U M E R B E H AV I O R R E P O R T PA R T 1 - S EC T I O N 1 : T H E R I S E O F S O C I A L S H O P P I N G Do consumers think social media is a secure place to buy? US consumers are clearly comfortable engaging with brands on social media. Companies looking to social media as a sales channel should be asking whether consumers are comfortable with the security of social media for purchases. Over a third (34%) of US social media users surveyed have made a purchase via a social platform. Of those who hadn’t made such a purchase, 29% say they are likely to do so in the next year, rising to 40% among Gen Z. Among those US consumers who were unlikely to make a purchase via social media, 51% said they don’t trust social media sites for secure purchases, while 46% would rather shop on retailer sites and apps directly. 12
W O R L D PAY F I S : 2 0 2 0 U S CO N S U M E R B E H AV I O R R E P O R T   PA R T 1 - S EC T I O N 1 : T H E R I S E O F S O C I A L S H O P P I N G

K E Y TA K E A W A Y

Be prepared for the rise of
social commerce.
Social media has emerged as a viable direct sales channel that is
poised for significant growth. Social media is a hub in many consumers’
omnichannel purchase journey. That presents big opportunities
for brands who can leverage their existing social media presence to
elevate customer engagement. Brands will want to broaden their
social strategy to use social media as a direct sales channel.

                                                                                                                                                          13
W O R L D PAY F I S : 2 0 2 0 U S CO N S U M E R B E H AV I O R R E P O R T PA R T 1 - S EC T I O N 2 : T H E M O B I L E E X P E R I E N C E
PA RT 1 — SEC TION 2
THE MOBILE
EXPERIENCE
14W O R L D PAY F I S : 2 0 2 0 U S CO N S U M E R B E H AV I O R R E P O R T PA R T 1 - S EC T I O N 2 : T H E M O B I L E E X P E R I E N C E
Cards vs. Phones:
Who is winning
where?
How do US consumers prefer The remaining 20% —including 25% of Millennials—
prefer to use a mobile wallet like Amazon Pay, Apple
to pay online? Our survey found Pay or PayPal.
that credit and debit cards
remain king—at least for now.
When buying online, almost 80%
of US consumers indicated that
they preferred using a debit or
credit card.
WE A SKED CONSUMERS: “WHY DO YOU USE A MOBILE WALLET ?”
57% 54% 50%
IT’S FA STER IT’S SAFER CONVENIENCE
15W O R L D PAY F I S : 2 0 2 0 U S CO N S U M E R B E H AV I O R R E P O R T PA R T 1 - S EC T I O N 2 : T H E M O B I L E E X P E R I E N C E
PERCENTAGE OF THOSE WHO PREFER MOBILE PERCENTAGE OF THOSE WHO PREFER MOBILE
WALLETS BEC AUSE ‘THE Y ’RE FA STER’ WALLETS BEC AUSE ‘THE Y ’RE SAFER’
62% 62% 61% 43 % 61% 58% 48% 46%
G EN Z MILLENNI A L S G EN X B O O MER S B O O MER S G EN X MILLENNI A L S G EN Z
Checkout speed was cited The safety of mobile wallets is
as important more among critical and becomes even more
younger generations important as US consumers
become more mature.
16W O R L D PAY F I S : 2 0 2 0 U S CO N S U M E R B E H AV I O R R E P O R T PA R T 1 - S EC T I O N 2 : T H E M O B I L E E X P E R I E N C E
Responses of consumers who
hadn’t made an online purchases
with a mobile phone.
50 THE SCREEN IS
TOO SMALL
%
49
HARD TO INPUT
DETAILS TO COMPLETE
%
A PURCHASE
37 HARD TO
%
CORRECT T YPOS
17W O R L D PAY F I S : 2 0 2 0 U S CO N S U M E R B E H AV I O R R E P O R T PA R T 1 - S EC T I O N 2 : T H E M O B I L E E X P E R I E N C E 18
W O R L D PAY F I S : 2 0 2 0 U S CO N S U M E R B E H AV I O R R E P O R T                 PA R T 1 - S EC T I O N 2 : T H E M O B I L E E X P E R I E N C E

How do US consumers prefer
to pay in-store?

Point of sale payment methods have evolved rapidly in
just a few years. Until recently, credit and debit cards
were authenticated by slow dial-up terminals and
confirmed by customer signature. These days, faster
and safer chip and PIN acceptance is the norm, while
contactless acceptance is increasingly common.

The next phase of the evolution to the use of
smartphone-based mobile wallets for payment in-store
is well underway. US consumers have lagged in their
adoption of mobile payments relative to consumers in
Europe and Asia, but that’s changing.

PERCENTAGE WHO HAVE USED A SMARTPHONE TO
MAKE A PAYMENT IN -STORE

   75% 70%                                                        52%          25%

        G EN Z                    MILLENNI A L S                    G EN X    B O O MER S

In fact, 56% of all respondents in our survey believe
that in five years, smartphones will replace credit
or debit cards as their primary payment method.
The percentage of believers is unsurprisingly the
highest among Generation Z, at 75%.

But if that change is going to happen, what obstacles are
businesses going to have to help consumers overcome?

                                                                                                                                                                19
W O R L D PAY F I S : 2 0 2 0 U S CO N S U M E R B E H AV I O R R E P O R T PA R T 1 - S EC T I O N 2 : T H E M O B I L E E X P E R I E N C E
RE A SONS US CONSUMERS GIVE FOR NOT USING
MOBILE PAYMENTS IN -STORE
6%
9%
36% 44%
IT TAKES TOO
MUCH TIME
RETAILERS DON’T
32 % OFFER CONTACTLESS
PAYMENTS
IT’S EASIER TO USE 4% I DON’T TRUST IT AS
MY CONTACTLESS A PAYMENT METHOD
C ARD
I DON’T KNOW HOW MY SMARTPHONE IS TOO
TO USE IT OLD FOR CONTACTLESS
20W O R L D PAY F I S : 2 0 2 0 U S CO N S U M E R B E H AV I O R R E P O R T PA R T 1 - S EC T I O N 2 : T H E M O B I L E E X P E R I E N C E
Our survey shows there’s still a level of mistrust
about mobile contactless payments. There’s
a lack of widespread knowledge about how
mobile contactless payments work, as well as
misperceptions based on outdated information.
Through education and familiarity with this
increasingly common, safe, and convenient
payment method, the long-awaited tipping
point seems at hand.
K E Y TA K E A W AY
Make payments safe,
easy and accessible.
Retailers need to offer a variety of payment
methods that their customers know and trust.
That starts with an awareness of how customers
like to buy, while paying close attention to providing
quick, secure and convenient checkout experiences.
Serving the needs of US consumers requires
a comprehensive strategy that supports both
new and traditional payment methods whether
in-store, online, or on-the-go.
21W O R L D PAY F I S : 2 0 2 0 U S CO N S U M E R B E H AV I O R R E P O R T PA R T 1 - S EC T I O N 3 : D E L I V E R Y: G E T I T Q U I C K E R O R G E T I T C H E A P E R ?
PA R T 1 — SEC TION 3
DELIVERY:
GET IT QUICKER
OR CHEAPER?
22W O R L D PAY F I S : 2 0 2 0 U S CO N S U M E R B E H AV I O R R E P O R T PA R T 1 - S EC T I O N 3 : D E L I V E R Y: G E T I T Q U I C K E R O R G E T I T C H E A P E R ?
Quicker
or cheaper?
Pay to get next-day delivery or We posed a scenario to US consumers and the
results showed a bias against paying extra for
wait and get it delivered for free? faster delivery.
These are the dilemmas that In this scenario, when deciding which retailer to choose
from, almost three-quarters of respondents (73%)
confront countless consumers, would rather wait longer than have to pay the extra
so knowing the answers can be delivery fee. Older generations were particularly
unwilling to pay, including 74% of Gen X and 89% of
invaluable to retailers. Baby Boomers.
73
OF RESPONDENTS WOULD R ATHER WAIT
LONGER THAN PAY FOR AN E X TR A DELIVERY FEE
%
23W O R L D PAY F I S : 2 0 2 0 U S CO N S U M E R B E H AV I O R R E P O R T PA R T 1 - S EC T I O N 3 : D E L I V E R Y: G E T I T Q U I C K E R O R G E T I T C H E A P E R ?
SCENARIO
Imagine that two retailers offered the exact same
product at the exact same purchase price: $50
• Company A offers next day delivery for $4.99
• Company B offers 3-5 day delivery, but for no charge
company
CO M PA N Y
N E X T D AY D E L I V E R Y 3 - 5 D AY
$4.99 FREE DELIVERY
PERCENTAGE OF RESPONDENTS CHOOSING PERCENTAGE OF CONSUMERS WILLING TO
COMPA N Y B – 3 -5 DAYS WITH FREE DELIVERY PAY E X TR A FOR SAME DAY DELIVERY OF THE
TOTAL OF ALL RESPONDENTS: 73% FOLLOWING PRODUC TS:
G EN X G EN Z
%
40% 37% 32%
74 %
53
NONE FOOD ITEMS PRESCRIPTIONS/
HEALTH
%
89 58
%
25% 24%
B O O MER S MILLENNI A L S ELECTRONICS CLOTHING/
FOOT WEAR
15%
BEAUT Y
PRODUCTS
24W O R L D PAY F I S : 2 0 2 0 U S CO N S U M E R B E H AV I O R R E P O R T PA R T 1 - S EC T I O N 3 : D E L I V E R Y: G E T I T Q U I C K E R O R G E T I T C H E A P E R ?
Arguably more important than
fast delivery is being able to offer
a specific timeslot— 88% of US
consumers we surveyed said it
would be either very or somewhat
convenient to be able to select a
one-hour delivery slot.
K E Y TA K E A W AY
Think carefully about
delivery charges.
Speed is important, but it isn’t
everything. Having to pay for delivery
isn’t popular among consumers,
so consider providing a variety of
options that trade-off speed for cost.
Be transparent and specific about
delivery options and avoid surprises
that can lead to cart abandonment.
25W O R L D PAY F I S : 2 0 2 0 U S CO N S U M E R B E H AV I O R R E P O R T PA R T 2 : B I O M E T R I C S A N D F R A U D PART 2 BIOMETRICS AND FRAUD PROTECTING YOUR BUSINESS IN 2020 AND BEYOND How do consumers prove their identity? Are they prepared to embrace biometrics such as fingerprint scans and facial recognition? As payment methods become even more sophisticated, do people remain concerned about their personal data falling into the wrong hands? Our survey probed US consumer attitudes towards biometrics, personal data, and fraud. In this section we explore the highlights, including some surprising findings. 26
W O R L D PAY F I S : 2 0 2 0 U S CO N S U M E R B E H AV I O R R E P O R T   PA R T 2 : B I O M E T R I C S A N D F R A U D

                                                                                                                               27
W O R L D PAY F I S : 2 0 2 0 U S CO N S U M E R B E H AV I O R R E P O R T PA R T 2 - S EC T I O N 1 : B I O M E T R I C S A N D CO N S U M E R I D E N T I T Y
PA R T 2 — SEC TION 1
BIOMETRICS
& CONSUMER
IDENTITY
28W O R L D PAY F I S : 2 0 2 0 U S CO N S U M E R B E H AV I O R R E P O R T PA R T 2 - S EC T I O N 1 : B I O M E T R I C S A N D CO N S U M E R I D E N T I T Y
Are consumers
on board with
biometrics?
Proving who you are is essential Today biometrics are seemingly everywhere.
US consumers routinely use fingerprint scans or facial
to remote commerce. Biometrics recognition to unlock their smartphones. Biometrics
relies on attributes of identity that allow us to issue commands tied to the sounds of our
unique voices and unlock doors simply by looking
can’t be hacked, like your unique at them.
fingerprint or your voice—why
But how do US consumers feel about biometrics,
remember passwords when you especially when it comes to payments?
can just look at a screen or say
When asked how appealing it would be if they could
a command? ditch their credit and debit cards and make all their
payments via biometrics, 46% of US consumers said
it would be very or somewhat appealing. Generation Z
are the biggest fans (62%) and Baby Boomers are the
least (31%).
60 % Of those who didn’t find the idea appealing,
60% saw biometrics as an invasion of their privacy,
59% indicated that “it just doesn’t feel right,” and
54% of consumers worried about identity theft.
OF RESPONDENTS WHO DISLIKE BIOMETRIC S SAID
IT WA S BEC AUSE IT’S AN INVA SION OF PRIVAC Y
29W O R L D PAY F I S : 2 0 2 0 U S CO N S U M E R B E H AV I O R R E P O R T PA R T 2 - S EC T I O N 1 : B I O M E T R I C S A N D CO N S U M E R I D E N T I T Y Retailers wanted to know whether there is a type of biometric payment US consumers favor. Fingerprint scanning is now ubiquitous as proof of identity on mobile devices, which explains why it’s the most preferred biometric payment method in our survey. Biometrics using methods other than a fingerprint are less well understood and so inspire less confidence among US consumers as a payment method—at least for now. 30
W O R L D PAY F I S : 2 0 2 0 U S CO N S U M E R B E H AV I O R R E P O R T                PA R T 2 - S EC T I O N 1 : B I O M E T R I C S A N D CO N S U M E R I D E N T I T Y

PERCENTAGE OF CONSUMERS WHO SAID THE Y WOULD FEEL COMFORTABLE
MAKING A PAYMENT TO A BUSINESS USING THE FOLLOWING METHODS

                                  50              %                                                                                         27%

                                                                                       17%                             FACIAL RECOGNITION
              FINGERPRINT SC AN

                                                                              VOICE RECOGNITION
                                                                                                                                                                                  29%
                                                 29%
                                                                                                                                                      NOT COMFORTABLE USING
                                                                                                         19         %                                     ANY BIOMETRIC

                                EYE RECOGNITION

                                                                                           HAND GEOMETRY
                                                                                              (PRINT)

K E Y TA K E A W A Y

Seize the opportunity
of biometrics.
Much like mobile and social payments, it won’t be long
before fingerprint scanning, facial recognition,
and other biometrics become the new normal.
Retailers should look to incorporate biometric
authentication of payment transactions to improve
customer experiences, reduce fraud, and improve
operational efficiencies.

                                                                                                                                                                                        31
W O R L D PAY F I S : 2 0 2 0 U S CO N S U M E R B E H AV I O R R E P O R T PA R T 2 - S EC T I O N 2 : F R A U D A N D P E R S O N A L D ATA
PA R T 2 — SEC TION 2
FRAUD AND
PERSONAL
DATA
32W O R L D PAY F I S : 2 0 2 0 U S CO N S U M E R B E H AV I O R R E P O R T PA R T 2 - S EC T I O N 2 : F R A U D A N D P E R S O N A L D ATA
US consumers are
worried about
being hacked
US consumers are concerned These concerns are well-founded, fueled by the
regularity of organizations and individuals that
about security, especially when it fall victim to hacking accompanied by widespread
comes to their personal data. media coverage.
Our survey found that 63% of US consumers are either
extremely or very concerned about their private/
personal data being compromised. Meanwhile, 35%
think it’s very likely that their private/personal data will
be stolen by a hacker “in the near future.”
63
OF US CONSUMERS ARE CONCERNED ABOUT THEIR
PERSONAL DATA BEING HACKED
%
33W O R L D PAY F I S : 2 0 2 0 U S CO N S U M E R B E H AV I O R R E P O R T PA R T 2 - S EC T I O N 2 : F R A U D A N D P E R S O N A L D ATA
Concerns about data security PERCENTAGE OF RESPONDENTS VERY OR
span across the generations, yet E X TREMELY CONCERNED ABOUT THEIR DATA
BEING HACKED:
Gen Z consumers are perhaps
more aware of the risks, with 74%
of respondents being very
or extremely concerned about
their personal and private data 74% 57 %
being compromised. G EN Z G EN X
65% 64%
B O O MER S MILLENNI A L S
What if the worst happens We asked consumers to think about a retail brand
that you’ve previously purchased from online.
and a retailer suffers a data Imagine you’ve been made aware that the brand had
breach? How does this affect suffered a data breach and customer details have
been compromised.
consumer trust?
HOW LIKELY WOULD YOU BE TO PURCHA SE FROM
THEIR ONLINE WEBSITE IN THE FUTURE?
42%
UNDECIDED
16%
UNLIKELY
16%
QUITE LIKELY 13%
12% VERY LIKELY
VERY UNLIKELY
34W O R L D PAY F I S : 2 0 2 0 U S CO N S U M E R B E H AV I O R R E P O R T PA R T 2 - S EC T I O N 2 : F R A U D A N D P E R S O N A L D ATA
Data breaches introduce
uncertainty with consumers,
with 41% undecided as to how
they’d react to a specific retailer
breach. What was surprising is
that data breaches aren’t
a retail death sentence—only
28% were unlikely or very
unlikely to revisit a retailer
who had suffered a breach.
K E Y TA K E A W AY
Don’t mess around
with data security.
With 63% of consumers either extremely or very
concerned about their private and personal data
being compromised or hacked, retailers need to
make a concerted effort to reassure their customers
and establish trust. Data breaches represent
a serious threat to the reputation of any business.
Retailers need to prioritize comprehensive data
security plans and transparently communicate
those efforts to customers.
35W O R L D PAY F I S : 2 0 2 0 U S CO N S U M E R B E H AV I O R R E P O R T PA R T 3 : O U R PAY M E N T P R E F E R E N C E S PART 3 OUR PAYMENT PREFERENCES A N D W H AT I T M E A N S FO R T H E FU T U R E How are consumers willing to pay for products? Is there a willingness to access more flexible payment options? In this section, we’ll look at consumer payment preferences now and what they mean for the future of retail. 36
W O R L D PAY F I S : 2 0 2 0 U S CO N S U M E R B E H AV I O R R E P O R T   PA R T 3 : O U R PAY M E N T P R E F E R E N C E S

                                                                                                                                   37
W O R L D PAY F I S : 2 0 2 0 U S CO N S U M E R B E H AV I O R R E P O R T PA R T 3 - S EC T I O N 1 : I N T E L L I G E N T PAY M E N T S
PA RT 3 — SEC TION 1
INTELLIGENT
PAYMENTS
38W O R L D PAY F I S : 2 0 2 0 U S CO N S U M E R B E H AV I O R R E P O R T PA R T 3 - S EC T I O N 1 : I N T E L L I G E N T PAY M E N T S
Credit card
or card-free?
From cars and refrigerators to
printers, more and more of the
things we use every day are
connected. We wanted to know
how comfortable US consumers
are with ceding control for
ordering and making payments
when something needs to be
restocked or refueled.
Are consumers comfortable
allowing a built-in computer to
make automatic payments? To
explore this question, our survey
included the following scenario:
39W O R L D PAY F I S : 2 0 2 0 U S CO N S U M E R B E H AV I O R R E P O R T PA R T 3 - S EC T I O N 1 : I N T E L L I G E N T PAY M E N T S
SCENARIO
Imagine you are in a gas station and you have
just filled up. What would you think if your car had
a built-in computer that could automatically make
the payment to the gas station?
Would consumers be comfortable
allowing a built-in computer to
make automatic payments?
80%
OF US CONSUMERS WOULD
BE COMFORTABLE WITH THIS
71%
WOULD FIND THIS
PAYMENT CONVENIENT
55%
WOULD TRUST THIS
PAYMENT METHOD
40W O R L D PAY F I S : 2 0 2 0 U S CO N S U M E R B E H AV I O R R E P O R T PA R T 3 - S EC T I O N 1 : I N T E L L I G E N T PAY M E N T S
K E Y TA K E A W AY
The future of intelligent
payments is now.
Payment innovation is all around us. From gas
stations to cars, self-service kiosks to unattended
retail, secure payments are being woven into the
commerce experience in all its forms. Intelligent
payments are redefining the scope of what’s
possible. Keeping ahead of the changes will help
you better serve your customers, allowing them to
focus on the exceptional products and experiences
your business offers.
41W O R L D PAY F I S : 2 0 2 0 U S CO N S U M E R B E H AV I O R R E P O R T PA R T 3 - S EC T I O N 2 : G O I N G C A S H L E S S
PA R T 3 — SEC TION 2
GOING
CASHLESS
42W O R L D PAY F I S : 2 0 2 0 U S CO N S U M E R B E H AV I O R R E P O R T PA R T 3 - S EC T I O N 2 : G O I N G C A S H L E S S
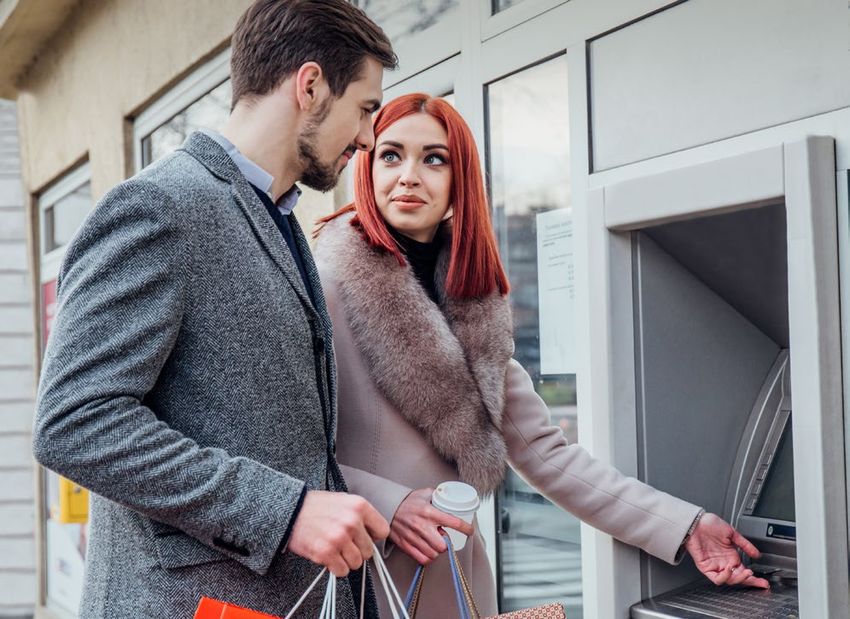
Is there still a
need for cash
machines?
US consumers are using less cash,
but they don’t want to dispense
with it completely. At least for now,
cash and the automated teller
machine still play a vital role.
PERCENTAGE OF RESPONDENTS WHO GO TO THE ATM FOR MONE Y:
TOTAL MALE FEMALE GEN Z MILLENNIALS GEN X BOOMERS
DAILY 5% 7% 3% 9% 11% 3% 1%
WEEKLY 26% 28% 24% 39% 32% 27% 16%
MONTHLY 26% 25% 26% 20% 24% 27% 28%
43W O R L D PAY F I S : 2 0 2 0 U S CO N S U M E R B E H AV I O R R E P O R T PA R T 3 - S EC T I O N 2 : G O I N G C A S H L E S S
ATMs are still being used regularly, PERCENTAGE OF RESPONDENTS WHO ARE USING
but is there a downward trend LESS C A SH COMPARED TO A YE AR AGO:
TOTAL AMOUNT OF RESPONDENTS: 41%
in the use of cash generally?
In short, yes.
We asked US consumers whether they use cash more 48% 41%
or less than they did a year ago. While 41% of consumers
said they use less cash than a year ago, 44% said they G EN Z G EN X
used it the same, and only 12% reported using cash
more often.
41% 36%
MILLENNI A L S B O O MER S
We also asked how people would How about a scenario where cash wasn’t available?
We asked how respondents would feel if cash was no
pay a friend or family member, longer available and only digital payments (credit/debit
for example if they had prepaid cards and apps) were to be used for payment.
for concert tickets. The answer: 41% of US consumers said that they
wouldn’t want cash to go away as they like to pay with
Cash was the most popular choice at 49%, showing its cash, including 56% of Gen Z and 57% of Baby Boomers.
enduring utility. Person-to-person payment apps like Yet almost half of respondents were ready to see cash
PayPal and Venmo followed at 28%, while checks were become a thing of the past: 21% of consumers said
favored by 12% of US consumers. that they could do without cash now, while 28% of all
respondents would be happy to get rid of cash—so long
as digital payments were accepted everywhere.
44W O R L D PAY F I S : 2 0 2 0 U S CO N S U M E R B E H AV I O R R E P O R T PA R T 3 - S EC T I O N 2 : G O I N G C A S H L E S S
K E Y TA K E A W AY
Cash isn’t dead—yet the
digital future is now.
Significant numbers of people regularly visit ATMs
and like to make payments using cash. But there
is a definite change, as illustrated in the decline
in people using cash compared to a year ago.
Retailers need to ensure they’re prepared for
the digital payments consumers expect, but
shouldn’t stop accepting cash just yet, as it’s still
an essential payment option for many consumers.
45W O R L D PAY F I S : 2 0 2 0 U S CO N S U M E R B E H AV I O R R E P O R T CO N C LU S I O N 46
W O R L D PAY F I S : 2 0 2 0 U S CO N S U M E R B E H AV I O R R E P O R T   CO N C LU S I O N

2020 US
CONSUMER
BEHAVIOR
REPORT
CONCLUSION
KE Y LE ARNINGS AND WORLDPAY FROM FIS
PRODUCTS & SERVICES

                                                                                                  47
W O R L D PAY F I S : 2 0 2 0 U S CO N S U M E R B E H AV I O R R E P O R T CO N C LU S I O N - K E Y L E A R N I N G S F R O M O U R R E P O R T
CONCLUSION
KEY
LEARNINGS
FROM OUR
REPORT
1 - B
E PREPA RED FOR THE R ISE OF
SOCIAL COMMERCE
Social media has emerged as a viable direct sales
channel that is poised for significant growth. Social
media is a hub in many consumers’ omnichannel
purchase journey. That presents big opportunities for
brands who can leverage their existing social media
presence to elevate customer engagement. Brands
will want to broaden their social strategy to use
social media as a direct sales channel.
48W O R L D PAY F I S : 2 0 2 0 U S CO N S U M E R B E H AV I O R R E P O R T CO N C LU S I O N - K E Y L E A R N I N G S F R O M O U R R E P O R T
2 - M A K E P AY M E N T S S A F E , E A S Y, A N D A C C E S S I B L E
Retailers need to offer consumers a variety of payment methods that their
customers know and trust. That starts with an awareness of how customers like to
buy, while paying close attention to providing quick, secure, and convenient checkout
experiences. Serving the needs of US consumers requires a comprehensive strategy
that supports both new and traditional payment methods whether in-store, online,
or on-the-go.
3 - T H I N K C A R E F U L LY A B O U T D E L I V E R Y C H A R G E S
Speed is important, but it isn’t everything. Having to pay delivery isn’t popular
among consumers, so retailers should consider providing a variety of options that
trade off speed for cost. It’s important to be transparent and specific about
delivery options while avoiding surprises that can lead to cart abandonment.
4 - SIEZE THE OPPORTUNIT Y OF BIOMETRICS
Much like mobile and social payments, it won’t be long before fingerprint scanning,
facial recognition, and other biometrics become the new normal. Retailers
should look to incorporate biometric authentication of payment transactions to
improve customer experiences, reduce fraud, and improve operational efficiencies.
5 - D O N ’ T M E S S A R O U N D W I T H D ATA S E C U R I T Y
With 63% of consumers either extremely or very concerned about their private and
personal data being compromised or hacked, retailers need to make a concerted
effort to reassure their customers and establish trust. Data breaches represent
a serious threat to the reputation of any business. Retailers should prioritize
comprehensive data security plans and transparently communicate those
efforts to customers.
6 - T H E F U T U R E O F I N T E L L I G E N T P AY M E N T S I S N O W
Payment innovation is all around us. From gas stations to cars, self-service kiosks
to unattended retail, secure payments are being woven into the commerce
experience in all its forms. Intelligent payments are redefining the scope of
what’s possible. Keeping ahead of the changes will help retailers better serve
customers, allowing them to focus on the exceptional products and experiences
the business offers.
7 - C A S H I S N ’ T D E A D —Y E T T H E D I G I TA L F U T U R E I S N O W
Significant numbers of people regularly visit ATMs and like to make payments using
cash. But there is a definite change, as illustrated in the decline in people using
cash compared to a year ago. Retailers need to ensure they are prepared for the
digital payments consumers expect, but shouldn’t stop accepting cash just yet,
as it’s still an essential payment option for many consumers.
49W O R L D PAY F I S : 2 0 2 0 U S CO N S U M E R B E H AV I O R R E P O R T CO N C LU S I O N - D I S CO V E R F I S PAY M E N T S O LU T I O N S
DISCOVER
WORLDPAY
FROM FIS
Worldpay from FIS (NYSE: FIS) is With an integrated technology platform, Worldpay
offers a comprehensive suite of products and services,
a leading payments technology delivered globally through a single provider.
company with unique capability
Worldpay processes over 75 billion transactions
to power global omni-commerce, annually through more than 300 payment types
processing 75 billion transactions across 146 countries and 126 currencies.
annually around the globe. We lift
economies and communities by
advancing the way the world pays,
banks and invests.
© 2020 FIS. Advancing the way the world pays, banks and invests™ Worldpay, the logo and any associated brand names are trademarks or registered trademarks of FIS.
All other trademarks are the property of their respective owners.
50V I S I T U S AT W O R L D PAY.CO M
You can also read