US ELECTION PREDICTION PREMIUM REPORT
←
→
Page content transcription
If your browser does not render page correctly, please read the page content below
US ELECTION PREDICTION PREMIUM REPORT
                                        NOVEMBER 3rd 2020

Page | 1
           US ELECTION PREDICTION
           PREMIUM REPORT
           November 3rd 2020

           © 2020 Oraclum Intelligence Systems Ltd. By receiving or reading Oraclum’s Prediction Report you agree that this material is
            confidential intellectual property of Oraclum Intelligence Systems Ltd. Under no circumstances may you directly or indirectly
            copy, modify, publish or redistribute this report or the information within or make any commercial use without explicit written
                 consent from Oraclum. Oraclum is not responsible for any decisions you make based on the findings of our report.
                                       All rights reserved. Oraclum Intelligence Systems Ltd. www.oraclum.co.uk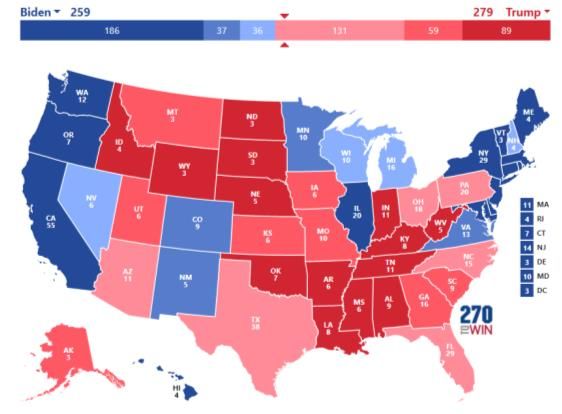
US ELECTION PREDICTION PREMIUM REPORT
NOVEMBER 3rd 2020
Oraclum’s prediction polling over the outcome of the
2020 US Presidential election
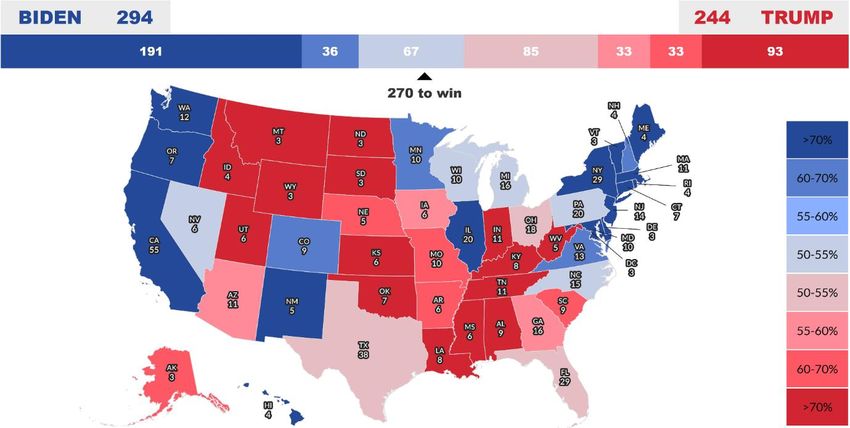
Page | 2 According to our final prediction Joe Biden is likely to become President, winning both the
popular vote and the electoral college vote. At the moment he has an 85% probability of
winning the race. The electoral college distribution is the following: 294 for Biden to
Trump’s 244 (a candidate needs 270 electoral college votes to win the election).
Our final prediction for the electoral college distribution, on November 3rd:
Bottom line: The race is still tight, as the candidates are holding on to their very narrow
leads, specifically Trump in FL (which is virtually a tie at this point), and Biden in NC (also
very close). We are projecting Trump to win in FL, AZ, OH, TX, GA, and IA (including all other
less uncertain Red states), while we see Biden winning MI, WI, MN, NV, NC and PA. This
gives Biden a more likely path to victory given that Trump needs to overturn at least two
states (PA and NC to be specific) and keep his narrow lead in all other states. This is why
Biden has a higher probability of winning given the distribution of votes in these states.
If the results stay this way – a closer than expected Biden victory – we are looking at a high
probability of post-electoral uncertainty and a contested election scenario. In fact, 64% of
our users anticipate a contested election. The reason is simple: if Trump holds on to wins in
FL and AZ (with NC also borderline), this will be known already on Election Night which
means waiting for vote counts in PA and WI to confirm the winner of the race. In both of
these states Biden is in front (and has been continuously since the start of our polling),
however it will take time before this is confirmed which could result in continued market
uncertainties next week.
© 2020 Oraclum Intelligence Systems Ltd. By receiving or reading Oraclum’s Prediction Report you agree that this material is
confidential intellectual property of Oraclum Intelligence Systems Ltd. Under no circumstances may you directly or indirectly
copy, modify, publish or redistribute this report or the information within or make any commercial use without explicit written
consent from Oraclum. Oraclum is not responsible for any decisions you make based on the findings of our report.
All rights reserved. Oraclum Intelligence Systems Ltd. www.oraclum.co.uk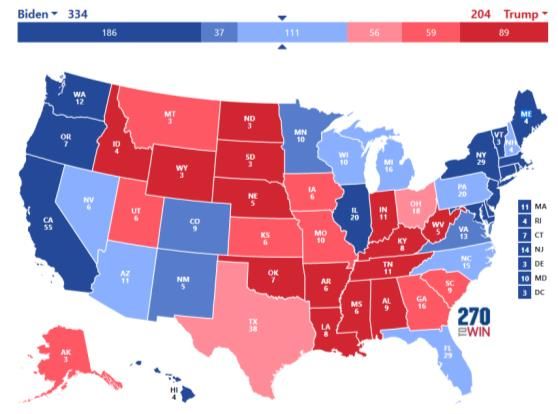
US ELECTION PREDICTION PREMIUM REPORT
                                        NOVEMBER 3rd 2020

           Here is our final state-by-state probability distribution for the crucial 12 swing states:

Page | 3

           Notice that in Florida the outcome is very close, both candidates have a 50% probability of
           winning, as they are divided by 0.1%. Taking Florida will be a tipping point in the race and
           will signal what we might expect in the coming days and weeks, but thus far we are still
           narrowly calling it for Trump.

           The table below gives our vote share predictions for each of the key swing states:

                             State               Trump                           Biden                         Margin
                          Arizona                  48.7                           48.2                            0.5
                           Florida                 48.8                           48.7                            0.1
                          Georgia                  48.7                           45.7                            3.0
                        Iowa                       49.1                           47.6                            1.5
                    Michigan                       48.0                           48.9                            0.9
                   Minnesota                       45.1                           49.8                            4.7
                      Nevada                       48.1                           49.3                            1.2
               North Carolina                      48.2                           48.7                            0.5
                        Ohio                       49.4                           47.4                             2
                Pennsylvania                       47.5                           48.5                             1
                       Texas                       48.5                           47.5                            1.0
                      Wisconsin                    48.8                           49.3                            0.5

           © 2020 Oraclum Intelligence Systems Ltd. By receiving or reading Oraclum’s Prediction Report you agree that this material is
            confidential intellectual property of Oraclum Intelligence Systems Ltd. Under no circumstances may you directly or indirectly
            copy, modify, publish or redistribute this report or the information within or make any commercial use without explicit written
                 consent from Oraclum. Oraclum is not responsible for any decisions you make based on the findings of our report.
                                       All rights reserved. Oraclum Intelligence Systems Ltd. www.oraclum.co.uk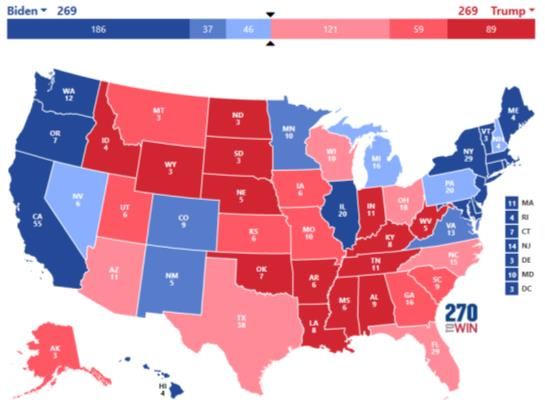
US ELECTION PREDICTION PREMIUM REPORT
                                        NOVEMBER 3rd 2020

           Anticipating different scenarios

           As we have pointed out in our previous report the race will come down to a few important
           swing states. On Election Night pay close attention to FL, AZ, and NC.
Page | 4
           If Biden wins all three on Election Night, his probability of winning jumps to >99%. The race
           is then as good as over. Biden is expected to pick up around 334 electoral college votes.

           If Trump wins all three on Election Night, his probability of winning jumps to 60%. The
           outcome in that case hinges on three Midwestern states (MI, WI, MN) and PA. Trump then
           needs a win in only one of those states (either PA or MI) to win for sure, or WI or MN to tie
           the vote and get a 269 to 269 scenario. The likelihood of this happening is, however, small.

           Panel A: Trump winning at least PA (Trump win)                             Panel B: Trump winning at least WI (a tie)

           In our most likely scenario, Trump is barely winning FL and AZ (while also keeping TX, GA, IA,
           and OH), while Biden is taking NC. If this scenario occurs on Election Night, Trump’s
           probability of winning is 20%. In this scenario we are once again forced to wait for the vote
           counts in PA and the three Midwestern states. In this scenario Trump needs a win in at least
           two of those four states in order to win. Taking only PA in that scenario will not be enough.
           This scenario brings the anticipated post-electoral uncertainty with a Biden win down the
           road (taking PA, MI, WI, MN), and is still our most likely scenario.

           © 2020 Oraclum Intelligence Systems Ltd. By receiving or reading Oraclum’s Prediction Report you agree that this material is
            confidential intellectual property of Oraclum Intelligence Systems Ltd. Under no circumstances may you directly or indirectly
            copy, modify, publish or redistribute this report or the information within or make any commercial use without explicit written
                 consent from Oraclum. Oraclum is not responsible for any decisions you make based on the findings of our report.
                                       All rights reserved. Oraclum Intelligence Systems Ltd. www.oraclum.co.uk
US ELECTION PREDICTION PREMIUM REPORT
                                         NOVEMBER 3rd 2020

           I. Deep analysis of state-wide results
           According to our projections we estimate Trump to be winning in at least 3 out of the 6 major swing
           states across the country (FL, AZ, OH). In this election cycle we estimate the crucial states will be
Page | 5   Florida (FL), Pennsylvania (PA), Ohio (OH), North Carolina (NC), Michigan (MI), and Arizona (AZ). In
           addition to these key 6 swing states we are also looking closely into Iowa (IA), Wisconsin (WI),
           Nevada (NV), Minnesota (MN), Colorado (CO), New Mexico (NM), Georgia (GA), and Texas (TX).

           There is a reason for focusing on each of these. The typically important swing states in each election
           are PA, FL, OH, and NC, but this time MI and WI are also in the loop due to Trump winning there
           back in 2016. These two states are particularly interesting as they used to be Democratic
           strongholds, but in 2016 they delivered one of the biggest surprises on Election Night. This cycle a
           reverse scenario might happen in GA or even TX, typically Republican strongholds, where polling
           seems to suggest a much tighter race between the two candidates.

           However, the crucial swing states which we will pay particularly close attention to will be the
           following three: Florida, North Carolina, and Arizona.

           The reason: mail-in voting due to COVID. By November 2nd 97.6 million votes were already cast (70%
           of total 2016 votes), 49.9 million of which were cast via mail. Most of these were done in Florida (6m),
           followed by Michigan (3.3m), Ohio (3.1m), Pennsylvania (3.1m), etc. The problem is the partisan
           distribution of mail-in ballots during this election. Much more absentee ballots were requested by
           Democrats than by Republicans, which could bias the results on Election Night in favor of Trump for
           those states that count absentee ballots on or after Election Day.

           But not the three aforementioned states. These states will be processing and counting their mail-in
           ballots long before Election Day which means there will be no delay on Election Night and that a
           winner in these states will already be known on November 3rd. Similar for Georgia and Nevada,
           although there is less uncertainty over who carries the states. Ohio — a state which every winning
           presidential candidate typically wins — is also starting early but they could experience a delay in
           results, and are more likely to have full results by Wednesday rather than Tuesday. For other states,
           like Pennsylvania or Wisconsin we might wait for weeks before we know the actual results.

           Therefore, by focusing on the aforementioned three states (FL, NC, and AZ) in addition to OH, we will
           be able to anticipate whether or not the elections will cause huge post-electoral uncertainty over the
           outcome or not.

           For example, if Biden secures a sweeping victory in each of these, it is highly unlikely that there will be
           uncertainty over the final outcome after Election Night. If, however, these states are split between
           the candidates, or the margins of victory are very low, then the electoral uncertainty might drag on
           for weeks, or even months.

           If Trump wins in all three on Election Night, then the outcome of the election will depend on the
           results in PA and WI, states that will take a long time to count their mail-in ballots. In that case
           uncertainty could drag on for months.

            © 2020 Oraclum Intelligence Systems Ltd. By receiving or reading Oraclum’s Prediction Report you agree that this material is
             confidential intellectual property of Oraclum Intelligence Systems Ltd. Under no circumstances may you directly or indirectly
             copy, modify, publish or redistribute this report or the information within or make any commercial use without explicit written
                  consent from Oraclum. Oraclum is not responsible for any decisions you make based on the findings of our report.
                                        All rights reserved. Oraclum Intelligence Systems Ltd. www.oraclum.co.uk
US ELECTION PREDICTION PREMIUM REPORT
                                         NOVEMBER 3rd 2020

           If the situation remains as it is under our most likely prediction, where Trump wins FL and AZ, in
           addition to OH, GA, TX, IA and all the other states going as expected then there will be no clear
           winner on Election Night, and the results will depend on late vote counting in PA and WI.

           If Biden however wins FL and AZ, while keeping all the others based on our projections, then he will
Page | 6
           have 270 electoral college votes already on Election Night (accounting for all the states going in the
           expected direction except for swing states).

           The scenario with a higher likelihood after this week’s polling numbers is the first scenario, where
           the country will be engulfed in weeks of post-electoral uncertainty over who the winner is while
           votes are being counted in PA and WI.

           Currently our method is predicting that Biden is leading in both of these states. Were this a normal
           election this result would be obvious already on Election Night and there would be much less post-
           electoral uncertainty. But given that this election depends on mail-in ballots, where half of the
           country already voted this way, the significance of PA will be even bigger than it usually is.

           To conclude, Biden still has a much clearer path to victory, and if keeps PA, even if he loses FL and AZ
           (and even NC), he will come on top. But this might not be obvious on Election Night.

           II. Impact of the election on markets
           Investors looking for signals on how the market is likely to react to election results should be less
           concerned over who will win and more concerned over which scenario is more likely:
               (1) A blue-wave Biden victory sweeping across most swing states, or
               (2) A Trump resurgence in FL and NC or AZ which would signal weeks and perhaps months of
                   post-electoral uncertainty and a contested election.

           The probability of a sweeping Trump victory obvious already on Election Night is highly unlikely given
           that we will not know the results in PA, WI and probably even OH. The results in FL, AZ, and NC will
           give a powerful signal on what will happen next in the race.

           Our prediction – based on our latest polling – is a contested election in which Biden does not have a
           clear victory on Election Night, and in which Trump is holding on to at least FL. In this case Trump’s
           optimal scenario will be to exert pressure on all other states which are still counting their votes thus
           stirring confusion and uncertainty, which is traditionally bad for markets.

           In other words, our prediction is a negative impact of post-electoral uncertainty on markets.

           In 2016 Oraclum’s BASON method was better than every single pollster in correctly predicting the
           outcome in PA, FL, and NC within 1 p.p. (no other pollster was giving these states to Trump, some of
           which had a 95% probability of going to Clinton). Our method is once again hoping to beat the
           pollsters on an individual state level. Our superiority in eliminating polling bias (read more below),
           increases our confidence in predicting the negative impact on markets, provided that we can still say
           on Election Day that Biden is not likely to grab a sweeping victory across at least two of those three
           states (one of which should be Florida).

            © 2020 Oraclum Intelligence Systems Ltd. By receiving or reading Oraclum’s Prediction Report you agree that this material is
             confidential intellectual property of Oraclum Intelligence Systems Ltd. Under no circumstances may you directly or indirectly
             copy, modify, publish or redistribute this report or the information within or make any commercial use without explicit written
                  consent from Oraclum. Oraclum is not responsible for any decisions you make based on the findings of our report.
                                        All rights reserved. Oraclum Intelligence Systems Ltd. www.oraclum.co.uk
US ELECTION PREDICTION PREMIUM REPORT
NOVEMBER 3rd 2020
In addition to tracking the probabilities of candidates winning each of the states and how this might
impact markets we have asked our survey participants whether they expect a contested election and
how they think markets might react post-election.
Page | 7
According to their responses, 64%
expect a contested election, while
44% expect the market to go down
(either slightly or a lot) after the
election as a consequence of post-
electoral uncertainty.
Interestingly, roughly an equal
number of previous Democrat and
Republican voters are expecting a
contested election – around 65%.
Slightly more voters who expect a
Trump win in their state expect a
contested election. Altogether, this
means that the majority of voters
are aware that there will be no clear
winner on November 3rd.
When asked about the market reaction,
Republican voters are more likely than
other voters to anticipate a market
decline (28% expect a large market
decline, compared to 25% on average
expecting this outcome; overall 33% of all
Republican voters expect a negative
reaction). This is lower than it was for last
week’s numbers and the reason could be
that Republican voters are becoming
more excited about a potential Trump
victory that, according to them, will send
markets up.
The negative market expectations, still the
majority of expectations in both camps, is
linked to a contested election scenario,
not necessarily a Biden victory, although
some of the negative expectations among
Republicans are surely linked to an expectation of a Democrat in the White House. For Democrats
the opposite is true.
© 2020 Oraclum Intelligence Systems Ltd. By receiving or reading Oraclum’s Prediction Report you agree that this material is
confidential intellectual property of Oraclum Intelligence Systems Ltd. Under no circumstances may you directly or indirectly
copy, modify, publish or redistribute this report or the information within or make any commercial use without explicit written
consent from Oraclum. Oraclum is not responsible for any decisions you make based on the findings of our report.
All rights reserved. Oraclum Intelligence Systems Ltd. www.oraclum.co.ukUS ELECTION PREDICTION PREMIUM REPORT
NOVEMBER 3rd 2020
In terms of voter preferences expressed by gender, age, ethnicity, education, and party affiliation,
things are moving in expected directions.
Trump is gaining larger support among male, while, middle-aged and older, lower educated (high
school or less) voters, whereas Biden’s base is higher among women, younger, higher educated
Page | 8
(college or more) voters and voters of all non-white ethnicities (African-American, Hispanic, Asian).
Figure: Distributions of preferences by age and gender
The party affiliation is also clear, however it is showing interesting trends. Over 97% of those who
voted for Democrats in 2016 are supporting Biden, while 85.5% of those who voted Republican in
2016 are supporting Trump. Trump has therefore lost about 15% of voters, 11% of which are going
to Biden. The net effect is +9% in favor of Biden, which is rougly equal to his national level lead in the
polls. This could be the main reason for his decline across the country, and particularly in the key
swing states.
Figure: Distributions by party preference in 2016
© 2020 Oraclum Intelligence Systems Ltd. By receiving or reading Oraclum’s Prediction Report you agree that this material is
confidential intellectual property of Oraclum Intelligence Systems Ltd. Under no circumstances may you directly or indirectly
copy, modify, publish or redistribute this report or the information within or make any commercial use without explicit written
consent from Oraclum. Oraclum is not responsible for any decisions you make based on the findings of our report.
All rights reserved. Oraclum Intelligence Systems Ltd. www.oraclum.co.ukUS ELECTION PREDICTION PREMIUM REPORT
NOVEMBER 3rd 2020
III. What is the probability of winning actually telling us?
In 2016 Trump won the electorate college even though Clinton had a higher probability of winning
the elections. Discussions on this outcome are mostly focused on percentages from polls in each
Page | 9 state because polls are easy to understand: either a candidate has a higher percentage of votes than
the other or not. It is not easy for people to understand what the margin of error with some
confidence level actually means.
For example, which of the following is easier to grasp:
a) candidates A and B have 51% and 49% of support in a poll with some margin of error and
confidence level, or
b) candidate A has 55% of chance winning?
Unlike a 3 percentage points lead in the poll, the 55% probability does not sound very reassuring as
we perceive it to be very close to a 50:50 outcome.
The reported probability can therefore help us get a better feeling of election uncertainties. This can
be even more helpful in the case of the electoral college when non-intuitive situations may arise. We
will first illustrate this with an example and then discuss what Trump’s victory in 2016 taught us.
Imagine a pseudo-USA with only three states: A,B & C.
Each state has one electoral vote, so two votes are needed
to win. Imagine now that polls are projecting Biden to win
state A with probability pB, while Trump is projected to win
states B and C with probability pT. This means that Trump is
projected to win the elections.
However, the twist in this story is that Biden’s probability
pB is very high, while the Trump’s probability pT is just
barely above 50%. Since we have only three states, it is
easy to calculate exactly the probability for Biden to win
the electoral college. There are three ways how this can
happen:
Option 1: lose A, win B & C. The probability for this is p1 =
(1- pB)*(1- pT) *(1- pT)
Option 2: win A & B, lose C: probability p2= pB*(1- pT) *pT
Option 3: win A & C, lose B: probability p3= pB *pT*(1- pT)
Option 4: win A & B& C: probability p4= pB*(1- pT) *(1- pT)
The total probability for Biden’s victory is p1+p2+p3+p4.
When we do the math, it turns out that Biden has a higher
probability of wining than Trump! This can be a
significantly higher probability, even though Trump has the
lead in two states. The image on the left shows Biden’s
probability of winning for given probabilities pB and pT.
Hence, Biden’s victory in this pseudo-election should not surprise us.
© 2020 Oraclum Intelligence Systems Ltd. By receiving or reading Oraclum’s Prediction Report you agree that this material is
confidential intellectual property of Oraclum Intelligence Systems Ltd. Under no circumstances may you directly or indirectly
copy, modify, publish or redistribute this report or the information within or make any commercial use without explicit written
consent from Oraclum. Oraclum is not responsible for any decisions you make based on the findings of our report.
All rights reserved. Oraclum Intelligence Systems Ltd. www.oraclum.co.ukUS ELECTION PREDICTION PREMIUM REPORT
NOVEMBER 3rd 2020
This example shows that probability is a more informative way of illustrating who will win than
just simple counting of who has how many electoral votes based on polling results.
Now we can get back to the current US elections. It turns out that Biden’s chances of winning are
over 80% and it will stay there even if Trump flips toss-up states to his advantage. This means that
Biden will have higher chances of winning the electoral college even if Trump leads by simply
Page | 10
counting the votes based on polls. The explanation for this is visible in our probability distribution
bar below:
It shows how Biden has lots of electoral votes covered by high probabilities, unlike Trump who holds
low probability advantage in many of his states. When the chances for winning the presidency are
calculated, Trump is fighting an uphill battle. It is like our pseudo-USA example where Biden can
reach victory more easily than Trump. In short, Trump can win only if he scores surprises in a series
of light blue states (swing states leaning towards Biden), without letting Biden surprise him in any of
the red leaning states. This is why we estimate that Biden has a much clearer path to victory than
Trump.
But, in 2016 exactly that happened – Trump’s victory against the odds! How is that possible?
What makes Democrats nervous is that in 2016 Clinton also had a seemingly solid advantage, but
Trump won with a big margin in electoral college votes. It turns out that this was not a fluke of
chance, but rather a systemic error in
the polls. When we looked at the
predicted difference between Trump
and Clinton in polls compared to the
actual election results by states, we
noticed a highly correlated trend
(orange line in the image) that was
underestimating the support for
Trump. For comparison, our BASON
survey results were scattered evenly
around the actual election results,
closer to the 45 degree line (in other
words they had better calibration).
This exposes an important hidden
assumption that errors in polling
should be “reasonably random”. This
means that polling errors are blind toward candidates and should not be systemically biased against
one candidate. But 2016 showed us that exactly this is possible due to intrinsic problems with the
polling methodology (read more on that here). This is where the fear comes from: can we trust polls
to have corrected their anti-Trump bias?
© 2020 Oraclum Intelligence Systems Ltd. By receiving or reading Oraclum’s Prediction Report you agree that this material is
confidential intellectual property of Oraclum Intelligence Systems Ltd. Under no circumstances may you directly or indirectly
copy, modify, publish or redistribute this report or the information within or make any commercial use without explicit written
consent from Oraclum. Oraclum is not responsible for any decisions you make based on the findings of our report.
All rights reserved. Oraclum Intelligence Systems Ltd. www.oraclum.co.ukUS ELECTION PREDICTION PREMIUM REPORT
NOVEMBER 3rd 2020
Our method differs from traditional polling methods (read more of that in the next section). This
makes it a proxy for possible systemic errors in the traditional polling results. In 2016 our results
predicted an anti-Trump bias. This year we also noticed a potential anti-Trump bias, but not as
strong or as large as it was in 2016. This is why we see Biden having higher chances for an overall
victory.
Page | 11
IV. BASON survey: A new polling methodology
The logic of our approach is simple. Our survey (https://elections.oraclum.co.uk/) asks the
respondents not only who they intend to vote for, but also who they think will win, by what margin,
as well as their view on who other people think will win. It is essentially a wisdom of crowds concept
adjusted for the question on groupthink.
The wisdom of crowds is not a new thing, it has been tried before. But even pure wisdom of crowds
is still not enough to deliver a correct prediction. The reason is because people can fall victim to
group bias if their only source of information are polls and like-minded friends. We used social
network analysis to overcome this effect. Using Facebook and Twitter to see how you and your
friends predict the election outcome (only if your friends also solve our survey, all of it completely
anonymously), we were able to recognize if you belong to groups where groupthink bias was
strong. People living in bubbles (homogenous likeminded groups) tend to only see one version of the
truth — their own. This means they’re likely to be bad forecasters. On the other hand, people living
in more diverse, heterogenous groups are exposed to both sides of the argument. This means they
are more likely to be better forecasters, so we value their opinions more. By performing this network
analysis of voter preferences we are able to eliminate groupthink bias from our forecasts and
therefore eliminate the bias from polling.
Our solution to the aforementioned traditional issues with online polls is the very idea of combining
wisdom of crowds with a network analysis to remove the selection and non-response bias. Asking a
© 2020 Oraclum Intelligence Systems Ltd. By receiving or reading Oraclum’s Prediction Report you agree that this material is
confidential intellectual property of Oraclum Intelligence Systems Ltd. Under no circumstances may you directly or indirectly
copy, modify, publish or redistribute this report or the information within or make any commercial use without explicit written
consent from Oraclum. Oraclum is not responsible for any decisions you make based on the findings of our report.
All rights reserved. Oraclum Intelligence Systems Ltd. www.oraclum.co.ukUS ELECTION PREDICTION PREMIUM REPORT
NOVEMBER 3rd 2020
respondent how people around them think means that we are including a group of people instead of
an individual. So all we have to do is to correct for each groups’ bias, which is easier than correcting
for individual bias.
To summarize, when we do a survey on social media this is what it looks like:
Page | 12 • We poll people on social media to find the best “observers” who tell us what their friends &
other people think who will win.
• Our users-observers then invite their friends to the survey, which enables us to see their
preference pattern and measure their group bias (only if the friends solve the survey).
• We then place a weight on each individual’s predictions based on their group’s bias and
draw patterns of behavior.
This methodology has enabled us to accurately predict not only election outcomes (like Brexit,
Trump or Macron), but also consumer sentiment and demand, market trends, optimal pricing, and
even the economic consequences of the COVID-19 pandemic.
V. What the others are saying?
In addition to our own predictions we are closely following the benchmarks and comparing our
predictions to theirs. We are looking at the most prominent polling aggregators, models, prediction
markets, and betting odds. And we are updating their predictions weekly on our blogs. The bellow
numbers are for November 3rd:
The first category are polling aggregators:
Polling aggregation Biden Trump Biden Trump Biden Trump
Probabilities Electoral college Vote share
FiveThirtyEight 89.0 10.0 348 190 53.4 45.4
RCP average of polls 319 219 50.7 44.0
Princeton Election Consortium 99.0 1.0 342 196 51.8 46.0
PollyVote 77.0 23.0 333 205 52.2 47.8
Upshot* 351 187 52.0 44.0
The Economist 96.0 4.0 350 188 54.2 45.8
Mean 90.3 9.5 340.5 197.5 52.4 45.5
As you can see from the table, all the polling aggregators are giving Biden much higher chances of
winning — on average 90%. These are for the first time higher than for Clinton this time four years
ago (her average probability of winning was around 88% on Election Day). The electoral college
distribution is also clearly in Biden’s favor, as is the estimated vote share.
© 2020 Oraclum Intelligence Systems Ltd. By receiving or reading Oraclum’s Prediction Report you agree that this material is
confidential intellectual property of Oraclum Intelligence Systems Ltd. Under no circumstances may you directly or indirectly
copy, modify, publish or redistribute this report or the information within or make any commercial use without explicit written
consent from Oraclum. Oraclum is not responsible for any decisions you make based on the findings of our report.
All rights reserved. Oraclum Intelligence Systems Ltd. www.oraclum.co.ukUS ELECTION PREDICTION PREMIUM REPORT
NOVEMBER 3rd 2020
Next are prediction markets and betting
Prediction markets Biden Trump
odds. Prediction markets were historically
shown to be even better than regular polls in Probabilities
predicting the outcome (except in the IEM 90.0 10.0
previous election where they were giving PredictIT 62.0 44.0
Page | 13
Clinton on average 75% probability of
winning). Their success is often attributed to Election betting odds 62.7 36.7
the fact that they use real money so that Hypermind 75.2 23.8
people actually “put their money where their Mean 72.5 28.6
mouth is”, meaning they are more likely to
make better predictions.
Interestingly, the prediction markets are still giving Biden lower chances of winning than they were
giving Clinton this time 4 years ago. She was at 82% on average, whereas Biden is at 72%.
Betting firms are giving Biden even lower odds. Last time they were favoring Clinton at about 82%,
today Biden’s probabilities are at 62%. Back then every single benchmark was clearly in Clinton’s
favor and by a large margin. Today, the polls are pulling stronger in favor of Biden, but the betting
and prediction markets are more bearish. This is not surprising as these markets are purely based on
expectations — and people tend to be more careful this time.
Betting odds Biden Trump
Probabilities
Betfair 66 34
Betsson 62 36
Bovada 61 38
Bwin 63 38
Smarkets 59 36
SpreadEx 64 38
Unibet 59 39
Vbet 64 35
Mean 62.3 36.8
Finally we compare our method against the Superforcaster crowd of the Good Judgement Project.
Superforcasters Biden Trump
Probabilities
Overall 72.0 28.0
By state:
Florida 62.0 38.0
Ohio 42.0 58.0
Pennsylvania 85.0 15.0
Michigan 94.0 6.0
Arizona 68.0 32.0
Wisconsin 89.0 11.0
Texas 29.0 71.0
© 2020 Oraclum Intelligence Systems Ltd. By receiving or reading Oraclum’s Prediction Report you agree that this material is
confidential intellectual property of Oraclum Intelligence Systems Ltd. Under no circumstances may you directly or indirectly
copy, modify, publish or redistribute this report or the information within or make any commercial use without explicit written
consent from Oraclum. Oraclum is not responsible for any decisions you make based on the findings of our report.
All rights reserved. Oraclum Intelligence Systems Ltd. www.oraclum.co.ukUS ELECTION PREDICTION PREMIUM REPORT
NOVEMBER 3rd 2020
The superforecasters too are playing it safer this time. They are estimating about 72% in favor of
Biden, compared to 75% for Clinton this time four years ago. The swing states are also interesting —
only Ohio is predicted to be more in favor of a Trump win. These numbers across the key swing
states (FL, OH, PA) are almost identical as they were 4 years ago.
Page | 14
100
90
80
Biden polls
70
Trump polls
60 Biden markets
50 Trump markets
Biden GJP
40
Trump GJP
30 Biden odds
20 Trump odds
10
0
01.10. 15.10. 22.10. 29.10. 03.11.
The summary of other predictions is given by the graph above. Biden is clearly in front under all
indicators and polls, but betting odds and prediction markets tend to be more careful than the polls.
Thank you for trusting Oraclum’s predictions!
Oraclum is a data science company that builds prediction models. We have created a disruptive innovation that will be the
future of market research, and used it to successfully predict Brexit and Trump and deliver value to our clients across
multiple industries in Europe, United States, and Asia.
It was founded by three scientists and academics with PhDs in physics, computer science and economics (from Oxford,
Princeton, and Singapore), and has assembled a team of high-quality data scientists and statisticians that help us perform
our analyses. We stand by our predictions with our scientific merit and professional credibility.
© 2020 Oraclum Intelligence Systems Ltd. By receiving or reading Oraclum’s Prediction Report you agree that this material is
confidential intellectual property of Oraclum Intelligence Systems Ltd. Under no circumstances may you directly or indirectly
copy, modify, publish or redistribute this report or the information within or make any commercial use without explicit written
consent from Oraclum. Oraclum is not responsible for any decisions you make based on the findings of our report.
All rights reserved. Oraclum Intelligence Systems Ltd. www.oraclum.co.ukYou can also read


