ABSTRACT Three Reports on a Page and 4-Page Layouts on the Fly with SAS and the Output Delivery System
←
→
Page content transcription
If your browser does not render page correctly, please read the page content below
Paper 4085-2020
Three Reports on a Page and 4-Page Layouts on the Fly with SAS® and the
                        Output Delivery System
                 Derek Morgan, PAREXEL International, Billerica, MA

ABSTRACT
This paper details the creation of a ready-to-publish document with multiple data sources
and differing page layouts of the same type of information based on page fit. Each set of
information is placed on one, two, or three pages depending on fit, and requires three calls
to the REPORT procedure using three different data sets. This solution does not involve ODS
DOCUMENT. Instead, we calculate how much horizontal and vertical space the report
requires and use the macro language to execute code conditionally. This allows us to
dynamically determine which page layout to apply, including setting or suppressing page
breaks with ODS STARTPAGE=. This solution makes extensive use of inline formatting as
well. The output was produced as an RTF file using SAS® University Edition running on a
Microsoft Windows 10 machine.

INTRODUCTION
This is a part of a simplified railroad simulation. This reporting challenge is to create a
passenger railroad timetable using a vintage US timetable as the template. There are three
distinct pieces of information required: the train schedules themselves, as shown in Figure
1:

Figure 1: Train Schedule Template
The second piece is the explanation of the symbols and letters within the schedules (Figure
2:)

                                             1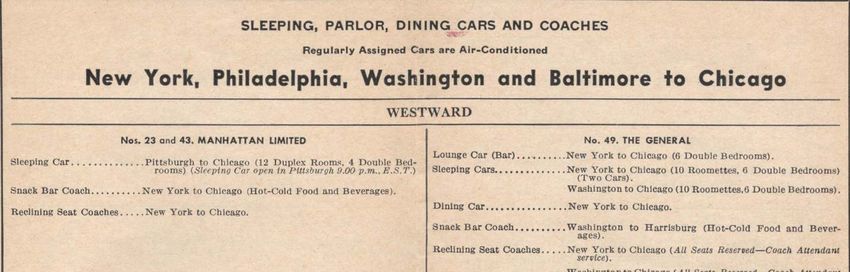
Figure 2: Reference Mark Template
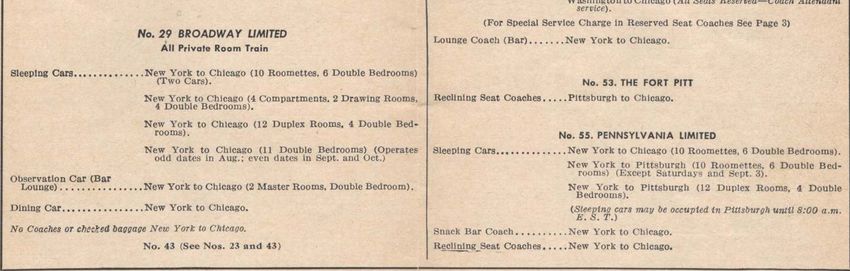
The last piece is a list of what type(s) of cars and amenities are available on each train
(Figure 3.)
Figure 3: Accommodations and Amenities Template
Railroads had to print millions of these, so a key requirement was to use as little paper as
possible, necessitating the tiny print. The modern method of timetable distribution is via
PDF files or the web, so we used a larger, non-proportional font. There is some post-
processing with Visual Basic to change the font in the RTF file generated by SAS due to the
limited selection of fonts available in SAS University Edition.
PAGE LAYOUTS AND EXAMPLES
The timetable document uses four distinct layouts, determined on the fly.
1. Both directions in one table spanning a page, reference marks/services on same
page, shown in Appendix 1.
2. Both directions in two tables, reference marks and services on same page, shown in
Appendix 2.
3. One direction on a page with services on the same page, shown in Appendix 3.
4. One direction on a page with services on a separate page, shown in Appendix 4.
2DATA SOURCES
The document uses data from seven datasets, several of which are created from Excel
workbooks. Microsoft Excel was chosen as the user interface for this project because of its
general availability. The SAS datasets and their descriptions are in Table 1:
Data Source Description
RR.SERVICES One record per train, contains train number, train name, how
often the train runs, what types of equipment, and how many of
each type are used for this train.
RR.TT_REFMARKS Standard time table reference marks.
RR.TT_NOTES_OUT Timetable reference marks for outbound trains. One record per
train, per station.
RR.TT_NOTES_IN Timetable reference marks for inbound trains. One record per
train, per station.
RR.TTBASE_OUT Actual schedule of outbound trains. One record per station per
train. Each train’s schedule is a variable in the dataset, and
schedules are maintained as SAS time values.
RR.TTBASE_IN Actual schedule of inbound trains. One record per station per
train. Each train’s schedule is a variable in the dataset. Order of
stations is reversed from RR.TTBASE_OUT, schedules are
maintained as SAS time values.
RR.TRAINS2ADD Extra trains running on “special service” days. Contains train
numbers, one record per “special service” date.
RR.TRAINS2RMV Trains that will not run on “special service” days. Contains train
numbers, one record per “special service” date.
Table 1 : Data Sources for Timetable
CHOOSING A PAGE LAYOUT
All three sections are required for a complete timetable page. The pages are arranged by
route, and we loop through the routes individually with a macro %DO loop. We have set the
width of each train schedule column at .65 inches. Given a page width of 8.5 inches, and
accounting for margins (.5 inches) and the mandatory STATION column (1.25 inches,) the
horizontal space available for train columns is 6.75 inches. Therefore, a maximum of eight
schedule columns will fit horizontally on each page (Figure 4):
3Figure 4: Maximum Eight Train Columns Across a Page
It took some trial and error to determine that 62 lines will fit on a page vertically. Although
each train’s schedule section is displayed vertically, some routes have more than eight
trains. PROC REPORT does a good job breaking columns into groups, so we tested to find
the maximum number of schedule section columns (7) PROC REPORT will print before
breaking by the ID variables. We have to multiply the number of station lines (STACNT,
Example 1) by that (SVCMULT, Example 1) to calculate how many lines the schedule section
will occupy. We add the number of lines required for the services (SVCLINES) and reference
mark sections (REFLINES), and include some slack to ensure we don’t put more information
on a page than will fit. Overestimating the number of lines is better than underestimation.
Example 1 shows the relevant code to calculate vertical page fit:
svcmult = ceil(nservices/7); /* # of grouped schedules on the page */
/*Vertical page length calculation */
pagelen = (svcmult*stacnt)+reflines+svclines+5;
Example 1: Calculating Vertical Page Fit
We store those calculations in macro variables, and use them to execute ODS STARTPAGE
conditionally, shown in Example 2:
/* Approx. 62 lines/pg @ 8.5PT Calibri */
%IF &pagesize LE 62 %THEN %DO;
ODS RTF STARTPAGE=NO;
TITLE "#BYVAL2 Services";
%END;
%ELSE %DO;
ODS RTF STARTPAGE=NOW;
%END;
Example 2: Conditional Page Breaks in ODS
Example 3 demonstrates how this method is also used to execute conditional LINE
statements in a COMPUTE block, which cannot be done with using a simple IF statement
within the COMPUTE block itself:
41. COMPUTE BEFORE ord;
2. /* If service information fits on same page , print service header */
3. %IF &pagesize LE 62 %THEN %DO;
4. routetitl = "~S={TEXTALIGN=center FONT_FACE=Calibri
FONTSIZE=9pt FONTWEIGHT=bold
BORDERBOTTOMCOLOR=white}" ||STRIP(routeName) ||
" Services" || "~S={}";
5. LINE routetitl $255.;
6. %END;
7. /* If there is a service subheader, print it and skip a line */
8. %IF &anysvctitl GT 1 %THEN %DO;
9. LINE svctitl1 $512.;
10. LENGTH skip $ 1;
11. skip = ' ';
12. LINE skip $1.;
13. %END;
14. ENDCOMP;
Example 3: Conditional LINE statement in a COMPUTE BLOCK
Example 3 creates service headers and sub-headers. If services for a route are on their own
dedicated page, then the service header is provided by the TITLE statement in Example 2,
and does not need to be repeated. Otherwise, the header is created and displayed in lines 4
and 5. The second condition in lines 8-13 only prints a service sub-header followed by a
blank line when a sub-header exists.
IT ALL BEGINS WITH THE ODS TEMPLATE
None of the default SAS ODS templates match our desired data display, so we have to
create our own by modifying a standard template. The Calibri font was ultimately chosen as
our timetable font for its readability at smaller font sizes, and the 8.5-point size will
accommodate our data in the minimum number of pages, while somewhat maintaining
legibility. The custom template code is in Example 4:
51. ODS PATH work.templat(UPDATE) sashelp.tmplmst(READ);
2. PROC TEMPLATE;
3. DEFINE STYLE timetbl; PARENT=styles.printer;
4. REPLACE BODY FROM DOCUMENT / LEFTMARGIN=.25in
rightmargin=.25in TOPMARGIN=.25in bottommargin=.25in;
5. STYLE SYSTITLEANDFOOTERCONTAINER FROM SYSTITLEANDFOOTERCONTAINER /
CELLPADDING = 0;
6. STYLE SYSTEMTITLE / FONT=(Calibri) FONTSIZE=11pt FONTWEIGHT=bold;
7. STYLE SYSTEMFOOTER / FONT=(Calibri) FONTSIZE=8.5pt;
8. STYLE TABLE FROM TABLE / CELLPADDING=0pt CELLSPACING=1pt
9. BORDERCOLOR=light gray BORDERBOTTOMCOLOR=light gray
10. BORDERWIDTH=1pt FONTSIZE=8.5pt;
11. STYLE HEADER / FONT=(Calibri) FONTSIZE=10pt FONTWEIGHT=bold;
12. STYLE PAGENO /FONT=(Calibri) FONTSIZE=8.5pt FONTWEIGHT=medium;
13. STYLE DATA / FONT=(Calibri) FONTSIZE=8.5pt TEXTALIGN=right;
14. STYLE USERTEXT FROM USERTEXT / FONT=(Calibri) FONTSIZE=11pt
FONTWEIGHT=BOLD;
15. END;
16. RUN;
17. ODS ESCAPECHAR='~'; /* Necessary for in-line formatting! *?
Example 4: The TIMETBL ODS Template
We use the standard ODS template STYLES.PRINTER as our basis (line 3.) Our template:
● Defines page margins to maximize the printable area of the page while maintaining the
ability to print the output on paper.
● Modifies the font size and selection for each of the ODS objects as we require.
● Changes the amount of padding around the title and footer cells.
● Changes the border and cell spacing parameters of the table.
CREATING THE SCHEDULE SECTION
Figure 5 shows a partial schedule section from a page of our timetable. There are twelve
trains in this direction on this particular route, automatically split into two groups of similar
lines by PROC REPORT. It is color-coded to show how the table is assembled from our
database:
Figure 5: Data Sources for the Schedule Section
6The light blue in Figure 5 indicates the data come from the schedule datasets, TTBASE_IN
and TTBASE_OUT, and green, the SERVICES dataset. Any relevant reference marks (, Ⓗ)
to be added to the days of operation cells are assigned on the fly. Yellow indicates the data
have been assembled from the schedule and timetable notes (TTNOTES_IN/OUT) datasets.
Vertical ordering is done by using a non-printing variable, and the ordering values for train
number, name, and days of operation are defined so they will be the first three lines in
every schedule, in that order. While the schedules themselves are maintained as SAS time
values, the train name and “Days of Operation” values are character variables. Since we
need to add reference marks to the schedule (for example, the “D” on the “South Columbia”
line in Figure 5,), all of the displayed columns except for the mileage are character
variables. The CATS() and PUT() functions create the data for each of the yellow cells.
As for the report itself, the train numbers are column labels; the actual variables used are
temporary, only created for the timetable. The “~{newline}” metacharacter is used where
necessary to break the train name in order to fit the column width defined in the PROC
REPORT step. In-line formatting centers and bolds the train name, centers the “Days of
Operation” cells, and bolds the PM times in accordance with US railroad tradition.
Each PROC REPORT that creates a schedule section must be created dynamically, because
the stations and trains vary by route and the variable names are not known in advance. As
noted earlier, a macro loop runs each route individually. First, we create a temporary
dataset for the schedule cells by merging the schedule and timetable notes datasets from
our database. We can then use DICTIONARY.COLUMNS to determine the names of the
columns to print. In Example 5, &&RID&I is the macro loop index and resolves to the route
number:
1. PROC SQL NOPRINT;
2. SELECT STRIP(PUT(COUNT(name),3.)), STRIP(PUT((COUNT(name))/2,3.))
INTO :nsvcs, :dtrns
3. FROM dictionary.columns
4. WHERE libname EQ 'WORK' AND memname EQ "TT&&rid&i" and
SUBSTR(name,1,1) EQ 'T';
5. SELECT SCAN(name,1,'_') INTO :trn1-:trn&nsvcs
6. FROM dictionary.columns
7. WHERE libname EQ 'WORK' AND memname EQ "TT&&rid&i" AND SUBSTR(name,1,1)
EQ 'T';
8. QUIT;
Example 5: Getting Column Names Dynamically Using Dictionary Tables
The first SQL query in Example 5 (lines 1-4) obtains the number of trains in the route
(&nsvcs), and the number of trains in each direction (&dtrns), which are used to determine
if the schedule will need to be split by direction for printing. We create the dynamic list of
column names in the second query (lines 5-8.) Each column name corresponds to a train
schedule in the given route, and the list of macro variables is generated each time the main
macro loop executes. The character variable displayed by PROC REPORT is created in a
DATA step combining the reference mark for each combination of train and station with the
schedule time. The in-line formatting for the PM times is also done in the same DATA step.
Finally, we add the character schedule dataset to the train name and days of operation
records, and are now ready to execute the PROC REPORT for the schedule section.
Three different PROC REPORT steps are coded to create the schedule section; which one is
used depends on how the information fits on the page. We’ve already calculated the
horizontal and vertical space needed for the schedule information and stored that in macro
7variables. The first test is whether both directions will fit horizontally. If so, then we can use
the bidirectional layout (Appendix 1), shown in Example 6:
1. %IF &nsvcs LE 8 %THEN %DO;
2. OPTIONS ORIENTATION=PORTRAIT CENTER;
3. PROC REPORT DATA=txx&&rid&i NOWD OUT=trace MISSING SPLIT='\';
4. BY lineID routeID RouteName;
5. COLUMNS sbrk lineID routeID routeName milepost
('Read Down' &outvnam) outbd_tt_miles dparout Station
dparin ('Read Up' &invnam);
6. DEFINE lineID / ORDER NOPRINT;
7. DEFINE routeID / ORDER NOPRINT;
8. DEFINE routeName / ORDER NOPRINT;
9. DEFINE milepost / NOPRINT ORDER ORDER=INTERNAL;
10. DEFINE outbd_tt_miles / ORDER ORDER=INTERNAL 'Miles' MISSING
STYLE=[PADDINGRIGHT=2PT];
11. DEFINE dparout / ' ' STYLE=[TEXTALIGN=L PADDINGLEFT=1PT
PADDINGRIGHT=2PT];
12. DEFINE Station / ' ' ID ORDER ORDER=INTERNAL
STYLE=[CELLWIDTH=1.25IN TEXTALIGN=C FONTWEIGHT=BOLD];
13. %DO k=1 %TO &nsvcs;
14. DEFINE &&trn&k / STYLE(COLUMN)=[CELLWIDTH=.65IN];
15. %END;
16. DEFINE dparin / ' ' STYLE=[TEXTALIGN=L PADDINGLEFT=2PT
PADDINGRIGHT=2PT];
17. DEFINE sbrk / NOPRINT;
18. COMPUTE lineID;
19. IF sbrk EQ ' ' THEN
20. CALL DEFINE(_ROW_,'STYLE',
'STYLE=[BORDERBOTTOMSTYLE=HIDDEN]');
21. ENDCOMP;
22. RUN;
Example 6: PROC REPORT Code for Bidirectional Schedule Layout
A maximum of eight trains in both directions will fit across one page, and that is tested in
line 1. Bidirectional schedules are centered on the page (CENTER option, line 2.) The %DO
loop at line 13 creates a DEFINE statement for each schedule column using the list of macro
variables created in the second query from Example 5. The macro variables &OUTVNAM and
&INVNAM (line 5, Example 6) contain the list of outbound and inbound schedule variables,
respectively. These are created using the SQL procedure to put the variable list into a single
macro variable (Example 7.)
1. PROC SQL NOPRINT;
2. SELECT scan(_trainid,1,'_') INTO :outvnam SEPARATED BY ' '
3. FROM outbd
4. WHERE routeID EQ &&rid&I;
5. ORDER BY strttm;
6. QUIT;
Example 7: Using PROC SQL to Create a List of Variables as a Single Macro Variable
Finally, we don’t want a border to show when the value of STATION is repeated. Since it’s
an ID column, PROC REPORT will only print the first occurrence of each value, and it won’t
be actionable in a COMPUTE statement. We have to create a dummy variable SBRK in the
dataset, which is blank if it is not the first occurrence of STATION. We use that in the
8COMPUTE block in lines 18-21 of Example 6 to prevent the printing of the border with the
BORDERBOTTOMSTYLE style attribute. If we changed the border color to match the
background instead, there would be tiny gaps in the vertical cell lines. Yes, it is a minor
issue, but the challenge was to reproduce the template as closely as possible. A magnified
view demonstrates the difference in Figure 6:
Figure 6: BORDERCOLOR=WHITE (top) vs. BORDERSTYLE=HIDDEN (bottom)
The other schedule layouts require printing one direction at a time, so there is a similar
PROC REPORT for each direction. Although the column and display order differs from
Example 6, and they work on different schedule datasets created for each direction, we still
use the macro variables &INVNAM and &OUTVNAM and the macro variable list we created in
Example 5 to specify the columns and generate a DEFINE statement for each variable. We
test to see if both directions will fit on a single page, and execute ODS STARTPAGE=NOW if
they don’t.
CREATING THE REFERENCE MARK SECTION
Reference marks fall into two categories. “Standard” reference marks are maintained in the
TTNOTES datasets and are linked to a specific train at a specific station. “Service
exceptions” are days where a train runs in addition to its regularly scheduled days, or does
not run even though it is scheduled to run. For example, a train scheduled to run Monday
through Friday might not run on Thanksgiving, even though it is a Thursday. Similarly, a
train scheduled to run only on holidays may also run on the Saturday before Thanksgiving,
because more people than usual are traveling that day. Some exceptions don’t have the
same date every year, as in the Thanksgiving examples above. Therefore, the actual dates
of service exceptions have to be calculated for each calendar year. For convenience, the
actual dates and train numbers of each service exception have been compiled for the next
ten years and stored in the TRAINS2ADD/RMV datasets. The process to associate service
exceptions with their actual calendar dates is beyond the scope of this paper.
We do not need to put all ten years of service exception dates in the timetable. Our
timetables are effective for the six-month periods of January 1 through June 30, or July 1
through December 31, unless there is a schedule or service change during the six-month
period. In that case, the start date is adjusted to the date of the change plus one week.
%LET tt_frame=%SYSFUNC(TODAY());
91. PROC SQL NOPRINT;
2. SELECT MAX(MAX(lastchg)+7,INTNX('SEMIYEAR',&tt_frame,0,'B')) as effdt,
3. INTNX('SEMIYEAR',&tt_frame,0,'E') as effend,
4. PUT(CALCULATED effdt,worddate18.) as effdate,
5. PUT(CALCULATED effend,worddate18.) as effendstr,
6. CATX(' ~{unicode 2014} ',CALCULATED effdate,
7. CALCULATED effendstr)
8. INTO :effdt, :effend, :effdate, :effendstr, :effstr
9. FROM
10. (SELECT DATEPART(modate) as lastchg
11. FROM dictionary.tables
12. WHERE libname EQ 'RR' AND memname IN ('SERVICES', 'TTNOTES_IN',
13. 'TTNOTES_OUT','TTBASE_IN','TTBASE_OUT')
14. )
15. ;
16. QUIT;
Example 8 shows how effective dates are calculated:
17. %LET tt_frame=%SYSFUNC(TODAY());
18. PROC SQL NOPRINT;
19. SELECT MAX(MAX(lastchg)+7,INTNX('SEMIYEAR',&tt_frame,0,'B')) as effdt,
20. INTNX('SEMIYEAR',&tt_frame,0,'E') as effend,
21. PUT(CALCULATED effdt,worddate18.) as effdate,
22. PUT(CALCULATED effend,worddate18.) as effendstr,
23. CATX(' ~{unicode 2014} ',CALCULATED effdate,
24. CALCULATED effendstr)
25. INTO :effdt, :effend, :effdate, :effendstr, :effstr
26. FROM
27. (SELECT DATEPART(modate) as lastchg
28. FROM dictionary.tables
29. WHERE libname EQ 'RR' AND memname IN ('SERVICES', 'TTNOTES_IN',
30. 'TTNOTES_OUT','TTBASE_IN','TTBASE_OUT')
31. )
32. ;
33. QUIT;
Example 8: Calculating Effective Dates
The macro variable &TT_FRAME allows us to select any six-month period starting on
January 1 or July 1. The default is TODAY(), which yields the current one, but we can pick a
date in any future six-month period. The beginning and end of the six-month period are
calculated with the INTNX() function (lines 4 and 5), using the adjustment parameters “B”,
and “E”, respectively.
The subquery in lines 12 through 16 obtain the modification dates for the datasets that
would have an effect on the timetable, and the latest modification date is used in line 4 of
the main query (MAX(lastchg)). If that date (plus seven days) is later than the start date of
the six-month period, then the start date is set to that value. The end date of the six-month
period remains the same, regardless of the start date. All of these are stored in macro
variables.
The start and end dates are SAS date values, and used with a WHERE=option and BETWEEN
clause to filter TRAINS2ADD/RMV. Example 9 is the code that creates the reference marks
for additional trains:
101. DATA trains2add;
2. LENGTH serviceDays $ 12 opdate datestr $1024;
3. MERGE rr.trains2add (IN=ina WHERE=(date between &effdt and &effend))
services;
4. BY train_number;
5. RETAIN opdate;
6. IF FIRST.train_number THEN
7. opdate = ' ';
8. datestr = CATX('/',PUT(MONTH(date),2.),PUT(DAY(date),2.));
9. opdate = CATX(', ',opdate,datestr);
10. IF LAST.train_number AND ina THEN DO;
11. IF serviceDays EQ 'Holidays' THEN
12. opdate = CATX(' ','Will operate',cats(opdate,'.'));
13. ELSE
14. opdate = CATX(' ','Will ALSO operate',cats(opdate,'.'));
15. OUTPUT;
16. END;
17. KEEP train_number opdate;
18. RUN;
19. PROC SORT DATA=trains2add OUT=add_opdate (KEEP=opdate) NODUPKEY;
20. BY opdate;
21. RUN;
22. DATA add_unicodes;
23. LENGTH str $ 15 refmark $ 128;
24. DO val = 9398 TO 9405, 9407 TO 9413, 9415 TO 9423;
25. hexval = PUT(val,hex4.);
26. str = CAT('~{unicode ',PUT(hexval,4.),"}");
27. refmark = CATS("~S={FONT_FACE=arial FONTSIZE=6pt
FONTWEIGHT=medium}",str,"~S={}");
28. OUTPUT;
29. END;
30. KEEP str refmark;
31. RUN;
32. DATA add_refmarks;
33. MERGE add_unicodes add_opdate (IN=ina KEEP=opdate);
34. LENGTH reftext $1024;
35. IF ina;
36. reftext = CATS("~S={fontweight=medium}",opdate);
37. KEEP str refmark reftext opdate;
38. RUN;
39. PROC SORT DATA=trains2add;
40. BY opdate;
41. RUN;
42. DATA trains2add;
43. MERGE trains2add add_refmarks;
44. BY opdate;
45. RUN;
Example 9: Generating Reference Marks and Text for Service Exceptions
11Line 3 filters the TRAINS2ADD dataset so we only have the service exceptions for the
timetable’s effective dates. Each time this DATA step iterates, the exception date is
formatted and appended onto a long character variable (lines 7 and 8.) Once all exception
dates for a given train have been processed, we add introductory text and send it to a
dataset (lines 10-16.) Since multiple trains can have the same exception dates, one
reference mark is used for all trains with the same exception dates (for example, the “”
displayed in Figure 7.) We sort the exception date text with the NODUPKEY option to
provide unique values.
The next step is to generate a list of Unicode reference marks. We create an easily
recognized distinction by having service removals use the Enclosed Numerics Unicode block,
and additional services (Example 9, lines 22-31) use the Enclosed Alphanumerics Unicode
block. We merge that Unicode list with the unique exception list text (lines 32-38) to
associate a reference mark with exception text. The last step (lines 39-45) is to merge the
reference marks with the train numbers by the exception text, providing the train-to-
reference mark link used in the schedule section, as seen in Figure 7.
Figure 7: Reference Marks Appended to Days of Operation
Putting the reference marks together is one task; displaying them is another. We chose a
three-column format to minimize the vertical space needed to print the reference marks and
text.
Reference marks are always printed on the same page as the schedule because it simplifies
coding, so ODS STARTPAGE=NO is used before the PROC REPORT that generates the
reference mark section. If we chose to add another possible layout (schedule on one page,
reference marks and services on a separate page), we’d have to test page fit and execute
ODS STARTPAGE=NOW before displaying the reference mark section. If the reference mark
section were on its own page, ODS STARTPAGE=NO for the services section would also be
executed. Otherwise, the reference marks would always be on one page, and the services
section on the next page.
What appears to be three columns is actually six; the reference mark is in a separate
column from the text because it looks nicer when using a proportional font. We rely on
PROC REPORT to wrap the reference mark text, giving us the result in Figure 8:
Figure 8: The Reference Marks Section
CREATING THE SERVICES (ACCOMODATIONS AND AMENITIES) SECTION
The final piece of the timetable is the services information. This is the most complicated
piece of the timetable, as a great deal of data preparation is necessary to create the
services text for display. For brevity, we will focus on the creation of the service description,
and not the formatting of the entire section.
12The SERVICES dataset contains information specific to each train in the simulation,
including the train name, quantity, and types of equipment. It is maintained as an Excel
spreadsheet. A SAS program reads the spreadsheet, creates the SERVICES dataset, and
produces an updated Excel workbook that can be updated. The workbook file has the
creation date in its name, so it is easy to roll back erroneous changes. Table 2 is an excerpt
from the SERVICES dataset (some variable names have been altered to fit):
Train trainName reserved Bag LH BC SLP106 SLP14 Diner
No Coach Coach
1 The White Star Y 0 0 0 2 2 0
Limited
2 The White Star Y 0 0 0 2 2 0
Limited
11 The Capitol Y 1 5 0 2 0 1
12 The Capitol Y 1 5 0 2 0 1
Table 2: Excerpt from SERVICES Dataset
Formatting is only one aspect of the services section. Many questions need to be answered
in the process: what train numbers are on each route? Do all the trains have the same
services? How many unique services are on this route? Is there specific text associated with
a specific train or trains? Let’s look at how the data from the SERVICES dataset are used to
answer these questions and create service descriptions.
The first question is whether a general rule applies to this train requiring standard
introductory text. As an example, if the train number is 10 or less, the text “All-reserved,
extra fare train. Reservations required, fare supplement charged at booking.” should be
displayed as the first item in the services text. If special text is present, the ~{newline}
metacharacter separates it from the remaining service information. Next, we process the
text for each type of car on the train. Each type of car has a standard short description that
is also the label for the variables in the SERVICES dataset. Each type also has a full
description with in-line formatting. The full description was created specifically for use in the
services section of timetables, as shown in Table 3:
Car Type Car Type Description for Timetables
Short Description
Baggage Car ~S={fontweight=bold}Checked baggage service available.~S={}
Long-haul Coach ~S={fontweight=bold}Coaches. ~S={}Reclining seats, leg rests.
Dome Coach ~S={fontweight=bold}Dome Coaches. ~S={}Reclining seats, leg
rests on lower level, unreserved scenic viewing on upper level.
10-6 Sleeper ~S={fontweight=bold}Sleeping Cars. ~S={}Roomettes and double
bedrooms.
4-4-2 Sleeper ~S={fontweight=bold}Sleeping Cars. ~S={}Suites and double
bedrooms.
Full Service Diner ~S={fontweight=bold}Dining Car. ~S={}Full dining service.
Table 3: Sample Car Type Labels and Descriptions
The information in Table 3 is stored in one of the simulation’s core datasets. At initiation of
the simulation, both the short and full descriptions are created as permanent formats in the
simulation’s format library. We use the link between the labels for the variables in the
13SERVICES dataset and these formats to obtain the description text. The code fragment in
Example 10 demonstrates how this works:
1. ARRAY itsrvc{*} Baggage HSCoach LHCoach ARCoach BCCoach DMCoach SLP106
SLP14 SLP442 Dinette Diner TWDiner DMDiner HSLounge
Lounge DMLounge DinerLounge DMOLounge RoundObsLounge
FlatObsLounge MobileOffice TGV1 TGV2 TGV3;
2. DO i=1 to DIM(itsrvc);
3. chk = VLABEL(itsrvc{i});
4. IF itsrvc{i} GT 0 THEN DO;
5. cartyp = PUT(chk,$svcdesc.);
6. IF itsrvc{i} EQ 1 THEN DO;
7. cartyp = TRANWRD(cartyp,'Coaches','Coach');
8. cartyp = TRANWRD(cartyp,'Cars','Car');
9. END;
10. svcdesc = CATS(svcdesc,cartyp,'~{newline}');
11. END;
12. END;
13.
14. svcdesc = CATS(svcdesc,"~{newline}");
Example 10: Creating Services Text from SERVICES Dataset
First, we place the relevant variables from SERVICES into an array, allowing us to loop
through each of the passenger car types. Line 3 gets the label of the variable, and we test
to see if that particular type is in the train (line 4.) Line 5 assigns the formatted version of
the variable label. Lines 6 through 9 change the full description from plural to single when
there is only one of a certain type. Line 10 adds the text for this equipment and a line feed
(‘~{newline}’) to the service description text. That causes the next car type description to
be displayed on the next line in the timetable. We insert another blank line to the end of the
text (line 14) after all car types have been processed. Example 11 shows the actual service
description text the program creates for trains 1 and 12:
Train
Service Description Text (svcdesc)
#
#1 ~S={fontweight=bold}All-reserved, extra fare train. Reservations
required,~{newline}fare supplement charged at
booking.~S={}~{newline}~S={fontweight=bold}Sleeping Cars. ~S={}Roomettes
and double bedrooms.~{newline}~S={fontweight=bold}Sleeping Cars.
~S={}Roomettes.~{newline}~S={fontweight=bold}Sleeping Car. ~S={}Suites
and double bedrooms.~{newline}~S={fontweight=bold}Dining Car. ~S={}Full
dining service.~{newline}~S={fontweight=bold}Sleeper Lounge Car. ~S={}Snacks
and beverages, sleeping car passengers
only.~{newline}~S={fontweight=bold}Mobile Office Car. ~S={}Internet and
business suites.~{newline}~{newline}
#12 ~S={fontweight=bold}All-reserved train. Reservations
required.~S={}~{newline}~S={fontweight=bold}Checked baggage service
available.~S={}~{newline}~S={fontweight=bold}Coaches. ~S={}Reclining seats,
leg rests.~{newline}~S={fontweight=bold}Sleeping Cars. ~S={}Roomettes and
double bedrooms.~{newline}~S={fontweight=bold}Dining Car. ~S={}Full dining
service.~{newline}~S={fontweight=bold}Lounge Car. ~S={}Sandwiches, snacks,
and beverages.~{newline}~S={fontweight=bold}Mobile Office Car. ~S={}Internet
and business suites.~{newline}~{newline}
14Example 11: Actual Service Description Text
When we display the service description text using ODS RTF and PROC REPORT, we get
Result 1 (the train numbers have been added to the table for easy reference to Example
11):
Train Actual Display of Service
# Description Text (svcdesc)
#1 All-reserved, extra fare train. Reservations required,
fare supplement charged at booking.
Sleeping Cars. Roomettes and double bedrooms.
Sleeping Cars. Roomettes.
Sleeping Car. Suites and double bedrooms.
Dining Car. Full dining service.
Sleeper Lounge Car. Snacks and beverages, sleeping car
passengers only.
Mobile Office Car. Internet and business suites.
#12 All-reserved train. Reservations required.
Checked baggage service available.
Coaches. Reclining seats, leg rests.
Sleeping Cars. Roomettes and double bedrooms.
Dining Car. Full dining service.
Lounge Car. Sandwiches, snacks, and beverages.
Mobile Office Car. Internet and business suites.
Result 1: Actual Service Description Text as Generated by the RTF File
As with reference marks, we collapse all service description text into unique values, as it is
possible for multiple trains within a route to have the same accommodations and amenities.
From there, intricate SAS code compiles all combinations of service description text, train
name, and train number before determining how to format the services section of the
timetable. How many lines the services section occupies on the page is calculated at the end
of this process, which yields the data source for the PROC REPORT step that generates the
services section. This is all done in DATA steps because we want the data formatted
properly for display, and the PROC REPORT step can be simplified. In general, for such
intricate formatting, the less work done inside PROC REPORT, the easier it is to debug and
make adjustments.
POST-PROCESSING AND OTHER DISCOVERIES
It was noted earlier that some post-processing was required to create the output in its final
form. It depends on the fonts available on your SAS platform. In this case, we started on
Windows SAS, and the Calibri font was selected for its readability at small sizes. However,
Courier is the default replacement font on SAS University Edition when the specified font is
not available. I created a one-click Visual Basic macro solution to change the Courier font to
Calibri throughout the entire timetable document, including titles, headers, and footers,
because the global find/replace capacity in Microsoft Word only changes the font in the main
body of this document. The Visual Basic code to do this is provided in Appendix 5.
Ultimately, in keeping with modern railroad practice, we want to create our timetable as a
PDF file, and it is a two-step process: generate the timetables as an RTF file, change the
font in Microsoft Word, and then create the PDF from the modified RTF document.
15Interestingly, when we used Windows SAS, rendering issues occurred when creating the
timetable directly via the PDF destination, so this has always been a two-step process of
converting an RTF file into a PDF.
CONCLUSION
Base SAS and the basic capabilities of ODS and PROC REPORT successfully met the many
challenges in reproducing this historical template. This particular exercise demonstrated just
how powerful and comprehensive the reporting facilities in SAS are. In-line formatting can
give you control over the display of your data at the individual character level if necessary.
Metacharacters give you spacing control within a report cell. You even have access to
Unicode characters if needed. Using macros for data-driven conditional execution of code,
you can direct your data into multiple PROC REPORT statements, creating a myriad of layout
possibilities. You can even suppress the display of border lines within a table.
The availability of SAS University Edition makes it possible for anyone to work with the
power of SAS outside the boundaries of work or school. The idea of a railroad simulation
began with an offhand comment. I was able to turn it into a way to grow and maintain my
SAS, database design, and problem-solving skills. This highly specialized report is merely
one aspect of the entire simulation, which has multiple opportunities for skill enhancement
and development.
Finally, are there other ways to have done this in SAS? As with many things in SAS, I’m
sure there are alternate approaches to generate similar output. ODS DOCUMENT, ODS
LAYOUT, or using the DATA step with ODS probably could produce acceptable results, and
possibly with less data manipulation. I may explore those alternatives in the future as a way
to develop those skills.
ACKNOWLEDGMENTS
Thanks to Sharon Hamrick from SAS Technical Support for solving the unwanted table
border problem, and to SAS Technical Support in general for their assistance over the years.
RECOMMENDED READING
Carpenter’s Complete Guide to the SAS® REPORT Procedure
CONTACT INFORMATION
Your comments and questions are valued and encouraged. Contact the author at:
Derek Morgan
mrdatesandtimes@gmail.com
SAS and all other SAS Institute Inc. product or service names are registered trademarks or
trademarks of SAS Institute Inc. in the USA and other countries. ® indicates USA
registration.
Other brand and product names are trademarks of their respective companies.
16Appendix 1 : Both Directions in One Table, Reference Marks/Services on Same
Page
17Appendix 2: Both Directions in Two Tables, One Page
18Appendix 3: One Direction on Page, Services on Same Page
19Appendix 4: One Direction on Page, Separate Services Page
2021
Appendix 5: VB Macro to Replace Courier with Calibri
Sub CouriertoCalibri()
  Application.ScreenUpdating = False
  Dim objSingleWord As Range
  Dim objDoc As Document

  Set objDoc = ActiveDocument

  With objDoc
    For Each objSingleWord In .Words
      If objSingleWord.Font.Name = "Courier" Then
         objSingleWord.Font.Name = "Calibri"
      End If
    Next
  End With
  Call fixHdFt
End Sub

Sub fixHdFt()
  Application.ScreenUpdating = False
  Dim Rng2 As Range, Sctn As Section, HdFt As HeaderFooter
  With ActiveDocument
  For Each Rng2 In .StoryRanges
    Call FndRepRng(Rng2)
  Next
  For Each Sctn In .Sections
    For Each HdFt In Sctn.Headers
       With HdFt
         If .LinkToPrevious = False Then
           Call FndRepRng(HdFt.Range)
         End If
       End With
    Next
    For Each HdFt In Sctn.Footers
       With HdFt
         If .LinkToPrevious = False Then
           Call FndRepRng(HdFt.Range)
         End If
       End With
    Next
  Next
End With
End Sub

Sub FndRepRng(Rng2 As Range)
With Rng2.Find
  .ClearFormatting
  .Text = ""
  .Font.Name = "Courier"
  With .Replacement
    .ClearFormatting
    .Text = ""
    .Font.Name = "Calibri"
  End With
  .Forward = True
  .Wrap = wdFindContinue
  .Format = True
  .Execute Replace:=wdReplaceAll
End With
End Sub

                                          22
You can also read