DATASTREAM FOR OFFICE - USER MANUAL FOR EXCEL ISSUE 2
←
→
Page content transcription
If your browser does not render page correctly, please read the page content below

DATASTREAM FOR OFFICE

USER MANUAL FOR EXCEL
ISSUE 2

 Page 1 of 46
Datastream for Office

CONTENTS

 1 Introduction                                                                                                     4

     The Datastream for Office (DFO) interface                                                                      4
     Using Datastream for Office                                                                                    4

 2 Using DFO Options dialog                                                                                         5

     Setting the Excel Add-In system options                                                                        5
     Request format options                                                                                         6
     Using Proxy settings                                                                                          10
     Creating data requests in Excel                                                                               11
     Creating static data requests                                                                                 13
     Creating time series requests                                                                                 16
     Using lists with time series requests                                                                         16
     Using functions and expressions with time series requests                                                     17
     Using Series Expression Editor in Static and Time Series Dialogs                                              18
     Shortcuts when entering request details                                                                       20
     Format options                                                                                                21
     Editing an DFO formula data request                                                                           21

 3 Using lists                                                                                                     23

     Creating a user list from a set of codes (Datastream, ISINs, SEDOLs, etc) in Excel (for example from a back
     office system)                                                                                            23
     Create a list using Navigator.                                                                                24
     Modify and Edit list                                                                                          24
     Using Custom Header in times series requests                                                                  25
     Using Function Selector for expression creation                                                               26
     Creating Expressions Using Intellisense Feature                                                               27

 4 Using Expressions                                                                                               29

     The Expression Picker                                                                                         29
     Using the Expression Builder                                                                                  30

 5 Using the Request Manager                                                                                       31

 6 Using the Request Table                                                                                         32

     What is the Request Table?                                                                                    32
     Creating a set of requests                                                                                    33
     Converting AFO requests to DFO request tables                                                                 35
     The Series Navigation button                                                                                  37
 Page 2 of 46
Datastream for Office
    Search for Dead Codes                                                               37
    Convert AFO controls to DFO formulas                                                39
    Calculation Mode                                                                    39
    The DFO Index                                                                       40
    User created time series                                                            41
    The user created time series template:                                              41
    Creating a user created time series                                                 42
    Editing an existing user created time series                                        43

7 Using Ribbon based UI for DFO (in MS-Office 2007 and above)                           44

8 Additional notes                                                                      46

    Using volatile functions                                                            46

Page 3 of 46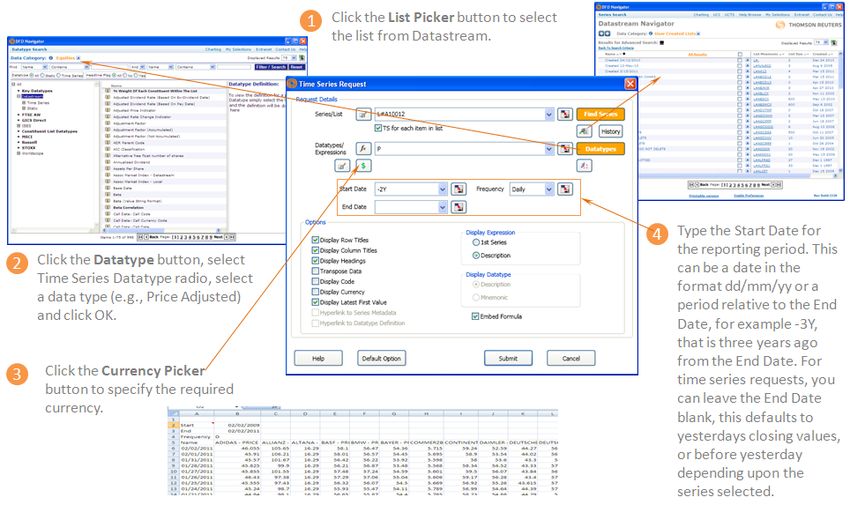
Using Excel with Datastream for Office

1 INTRODUCTION

THE DATASTREAM FOR OFFICE (DFO) INTERFACE

To use Datastream for Office (DFO), use the Datastream Thomson Reuters menu in your Excel application.

DFO menu in Excel 2007 and above

USING DATASTREAM FOR OFFICE

In DFO you can make static, and time series requests.

Static requests

To request data for a specific date. For example, the price, PE and dividend yield for Pepsico and Coca-Cola for
01/01/05.
For more information, see Creating a static request.

Time series requests

To request data over a specific period, defined by a start date, end date, and frequency of data. For example,
the daily price for Pepsico from 01/01/05 to 01/01/06.
For more information, see Creating a time series request.

Request Manager

Use the Request Manager to manage your embedded requests. All the chart and data requests in your Excel
work book are listed with their details. You can edit, delete, or refresh the requests individually or together.

For more information see Using the request manager.

Page 4 of 46

Using Excel with Datastream for Office

2 USING DFO OPTIONS DIALOG
SETTING THE EXCEL ADD-IN SYSTEM OPTIONS

System options are available for you to control the way you use the Excel Add-In and how data is presented.
These options include:
     Request Format options
     Connection Settings
     Request URL Settings
For assistance on using Thomson Reuters Datastream's Excel functionality and content - use the Contact Us
option on the menus.
To select these options:
1.     Choose Options from the Thomson Reuters Datastream menu.
       The Options dialog is displayed.
2.     Select the Request Format tab.
3.     Select the options you require by checking the boxes:

4.     Click OK.

Page 5 of 46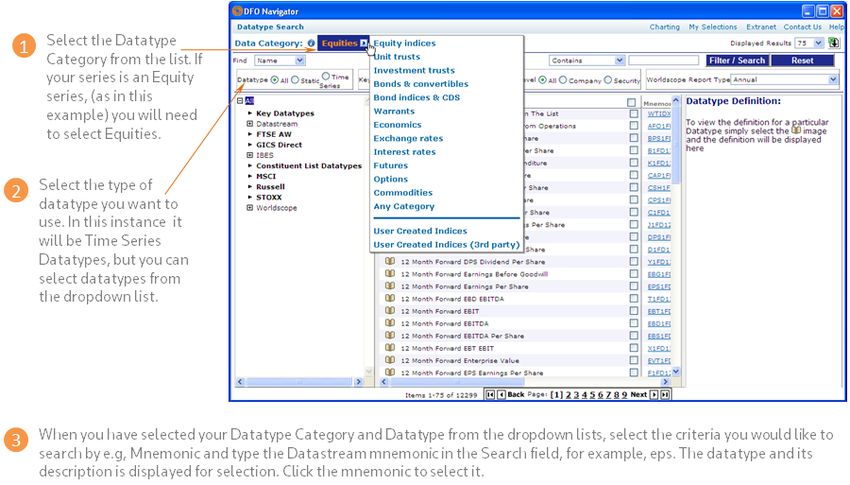
Using Excel with Datastream for Office

REQUEST FORMAT OPTIONS

These options define the default display options for data requests in Excel. They can be overridden by the
request format options on the Static Data Request and Time Series Request dialogs. Clicking the Default
Option button on these dialogs returns the format options back to the default settings on the Options dialog.
Changes to the settings on the Options dialog will only take effect after Excel has been re-launched, or if the
Default Option button on the request dialog is used.

The request format options are:
         Row Titles - displays the series code at the top of each row for each series.
         Column Titles - displays the datatype mnemonic at the top of each column.
         Headings - displays a general heading for row and column titles. For example, the date of the request.
         Currency - displays an additional column with the title Currency and with the traded currency of each
         selected series.
         Transpose Data - displays individual time series data across the Excel spreadsheet in rows. This is
         particularly useful if you are requesting data over very short time periods or larger reporting
         frequencies, that is quarterly or yearly. The maximum number of columns that you can use in Excel is
         255.
         Latest Value First - displays the latest value first in the request result.
         Display code - displays the series mnemonic. This option is available for Time Series request.
         Hyperlink to metadata or Datatype definition - Adds a hyperlink to the series code to link to the
         classifications and metadata pages from Navigator for the series (also enable series that are now dead
         or inactive to be identified in your workbook).
         Cell Referencing - this enables this with or without the trigger cell. This trigger uses a cell above the
         request to detect if the contents of the referenced cells have changed to initiate an update.
         Embed Formula - ensures that the request is embedded in Excel as a dynamic, refreshable object
         when saved. If you do not select this option, the results of the request cannot be refreshed and remains
         as plain text/numbers.
         Suppress Comments - removes row headings e.g Date, Type, Currency etc.

Display Datatype - According to the option selected, the Datatype description or mnemonic is displayed in the
Static request results.

Display Expression - According to the option selected, the Expression description or number is displayed in
the Static and Time Series request results.

Data options - The Not Available String field enables you to type the text that you want displayed in Excel
when data is not available from Datastream. For example, #N/A, Blank.
Note: Enter "Blank" word in Not Available String input field if you have not entered any.

Logging: Select Information or Trace to view and delete logs, note that delete log clears all old logs except the
current day's log.

UCTS Options: Overwrite all values if series exists - to overwrite existing values.

Page 6 of 46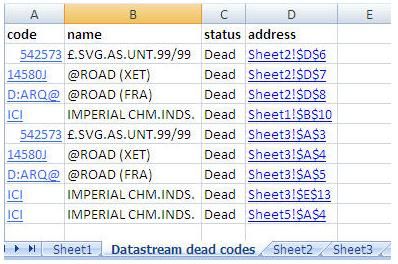
Using Excel with Datastream for Office

Performance and Logging – You can enable parallel request processing to improve the performance. The Enable
     Tracing option allows diagnostics logs to be created during the execution of requests to help track down different
     problems – but will have an impact on the retrieval performance.
Calculation Options
         Suppress Auto Calculation on Open - you can enable the auto calculation on startup.
         Refresh Only DFO Formulas- only DFO Formulas get refreshed.

Menu (right click mouse)
     ShortCut - makes the Static Request, Time Series Request, and Request Management options
     available from the Excel worksheet right mouse click menu.

Recent Series / Datatypes - Recent series to display those used in both static and time series requests in the
dropdowns in static and time series requests.

Auto Correct List
         Autocorrect options Delete "..." from the list is removed from Excel‟s default Autocorrect settings
         whereby "..." is replaced by the symbol "...".

On Startup
         Enable Login on Startup – this option allow you to enable the DFO Add-in on start off Excel.

Proxy Settings – Checks for the Internet / Proxy Settings to access Datastream for Office. Click here for more
information.

Suppress Run on Startup (DFO Index) – overrides the automatic refresh setting of any embedded requests.

Intellisence: This option enables you to see the functions and parameters available for the functions with links
to the help files.

Enable Ctrl+R shortcut (to process RT): You can enable and disable shortcut (Ctrl+R) for process request in
Request Table using options dialog.

SETTING THE USER CREDENTIAL

You can configure user credential options in the Connection Settings tab.
To select these options:
1.     Choose Options from the Thomson Reuters Datastream menu.
       The Options dialog is displayed.
2.     Select the Connection Settings tab.

Page 7 of 46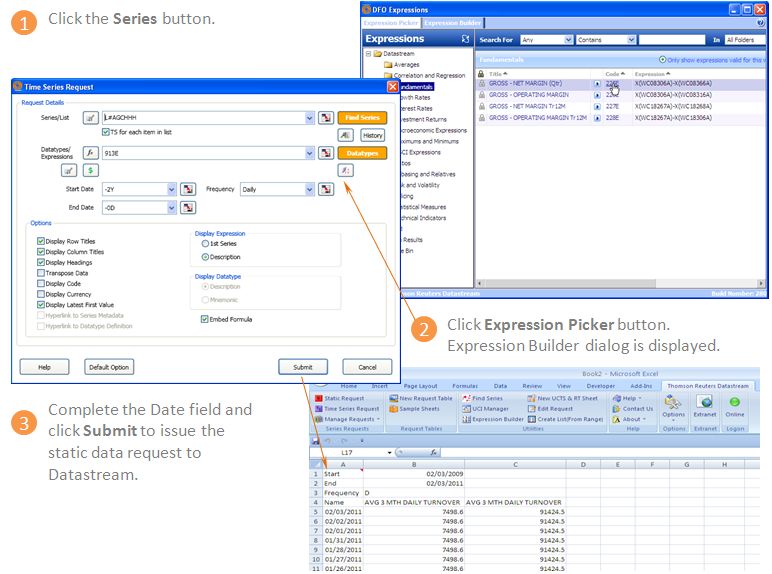
Using Excel with Datastream for Office

3.     In the Credentials for Authentication area, type a user name and password.(Datastream Child ID or
       Thomson One ID and Password)
4.     Click OK to save your new setting and close the Options dialog.

5.     Click the Offline icon from Thomson Reuters Datastream menu to configure the user authentication.

Note: If correct credentials are supplied, Button status will be changed to „Online’. In case of invalid log-in
credentials, proper error message will be displayed. Anytime during the usage of the add-in you can change
user id, password or DSWS URL in Options dialog. If you change any of these parameters, automatically the
ribbon UI will displayed as disabled. You need to click on „Online’ button again to take effect the new changes.
Please note that excel restart is not needed for these changes.

SETTING THE REQUEST URL SETTINGS

You can configure request URL in Request URL Settings tab.
To select these options:
1.     Choose Options from the Thomson Reuters Datastream menu.
       The Options dialog is displayed.
2.     Select the Request URL Settings tab.

Page 8 of 46
Using Excel with Datastream for Office

URL’s
         DSWS (Datastream Webservices): this allows the URL for the DSWS to be configured.
         UCI (User Created Indices): this allows the URL for the UCI Manager to be configured.
         UCTS (User Created Time Series): this allows the URL for the UCTS to be configured.
         Expressions: The Server field enables you to define the location of the server from which you would
         like to run Datastream Expressions Picker / Builder.
         Navigator: The Server field enables you to define the location of the server from which you would like to
         run Datastream Navigator.
               o   You can use Clear Navigator Caches button for clearing Navigator & Internet Explorer temp
                   cache.
         Currency: this allows the URL for the Currency to be configured.
         Functions: this allows the URL for the Functions to be configured.
Path
         DFO Index: This specifies the location where DFO Index file are stored.

Page 9 of 46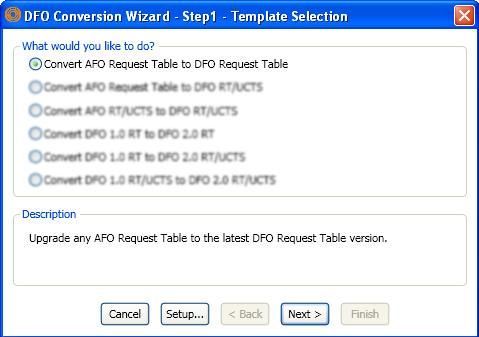
Using Excel with Datastream for Office

Sample Sheet
     Samples URL: This specifies the URL from where DFO Samples can be downloaded.
     Download Path: The download path for the DFO Samples file can be specified here.

USING PROXY SETTINGS
You can now set proxy settings, by checking Enable proxy
checkbox and click on the Advanced button. The Advanced
Proxy Settings dialog allows you to specify proxy related
details.

You have three proxy settings options available:

  a. Automatic Configuration: Use Internet Explorer Proxy
     settings.
  b. Proxy Server: Configure your own proxy settings.
  c. Credentials: Specify proxy logon credentials (User name
     and Password).

Note 1: If Automatic Configuration setting is not working, use
Proxy Server setting with Credentials.

Note 2: Internet Explorer proxy setting is configured by default when you check Enable proxy checkbox and
Save button in Options dialog.

Page 10 of 46
Using Excel with Datastream for Office
CREATING DATA REQUESTS IN EXCEL
Datastream for Office (DFO) enables you to create and issue data requests from within Excel, rather than
creating your data requests in Datastream and then embedding them in Excel. When you issue a request from
Excel, it is passed directly to Datastream, bypassing Datastream. The results are returned as dynamic,
refreshable objects. This means that your data requests can be saved and refreshed within Excel without having
to launch Datastream. The breadth of Datastream‟s historical data is available for use in your spreadsheets. Any
number of data requests can belong to a spreadsheet and be refreshed as a batch using the Request
Manager. See Using the Request Manager.
The data request creation facilities available in Datastream are also available in Excel.
Static Data Time Series Data
Series selection – including Datastream equities, Series selection – including Datastream equities,
market indices, commodities, bonds, interest and market indices, commodities, bonds, interest and
exchange rates, investment and unit trusts, warrants exchange rates, investment and unit trusts,
and economic series. warrants and economic series.
List selection – including user created mainframe lists List selection – including user created mainframe
and constituent lists. lists and constituent lists.
Datatype selection – static datatypes for Datastream, Datatype selection - time series datatypes for
MSCI, I/B/E/S and FTSE. Datastream, MSCI, I/B/E/S and FTSE.
Expression selection - including Datastream global and Expression selection – including Datastream
user created expressions. global and user created expressions.
Frequency of reported data - including daily,
weekly, monthly, quarterly and yearly.
Currency Convertor - including currency Currency Convertor - including currency.
Date of requested data. Start and end dates for display period.
Format options - including selection of column and row Format options - including selection of column and
title and headings. row title and headings.
The Intellisense option enables you to see the functions and parameters available for the functions with links to
the help files.
The Editor option enables multiple series or datatypes/functions/expressions to be easily reviewed, edited
and extended with links to the metadata.
The Hyperlink to Metadata option enables series codes to be linked to the Navigator classifications and
metadata pages. This also enables series that are now dead or inactive to be identified in your workbook via the
Search For Dead Codes menu options.
The Hyperlink to Datatype Definition option enables series codes to be linked to the Navigator Datatype
Definition page.
Page 11 of 46Using Excel with Datastream for Office Page 12 of 46
Using Excel with Datastream for Office

CREATING STATIC DATA REQUESTS

Static data requests are created using the Datastream Static Request dialog to enter your request parameters.
Choose Static Request from the Thomson Reuters Datastream menu.
The minimum you need to do to create a static data request is select a series, a datatype, and a start date on
the Datastream Static Request dialog. You can then Submit the request to Datastream. The results are
displayed directly in the spreadsheet with row and column headings (if selected).
Example - Five series and static datatypes

Selecting series

The Datastream Navigator, displayed by clicking the Series Navigation button,                    enables you to
select individual series. When you select a series, the series mnemonic is copied to the Series field on the
Request dialog. Multiple selections are automatically separated by commas.

Page 13 of 46
Using Excel with Datastream for Office

Selecting datatypes

The Datatype Mnemonic Picker, displayed by clicking the Datatypes button               , enables you to select
individual datatypes per request. When you select a datatype, the Datastream mnemonic for the Datatype, for
example, MV for Market Value, is copied to the Datatypes field on the Request dialog. Multiple selections are
automatically separated by commas.
The following example shows you how to search and select the Datastream equity datatype EPS (earnings per
share) by typing its mnemonic in the Datatype Mnemonic Picker.

If you don‟t know the Datastream mnemonic for the required datatype but you know the general description,for
example Price, choose to find by Name and type Price in the Search Field. This lists all datatypes for the
chosen Data Category and Datatype with descriptions beginning with Price (e.g. Price (adjusted), Price
(unadjusted), and so on).

Selecting lists

You can use lists stored on the Datastream host, rather than selecting a number of individual series. These lists
include:
     User lists (i.e. L#xxxx lists) that are stored on the Datastream host system. See Creating user lists.
     Constituent lists; for example, LFTSE100.

To select a list, click the List Picker button      , on the Request dialog. When you use a list of series for a data
request, data is displayed for the selected datatypes for every series in the list in the order that they appear in
the list. Selecting a list from the List Picker copies the list code into the Series field. This could be a list code for
mainframe lists (e.g. L#A74953) or a list mnemonic for constituent lists (e.g. LNSABANK).

Page 14 of 46
Using Excel with Datastream for Office Example - User created list and 3 static datatypes Selecting expressions For static data requests, you can browse and select expressions stored on the Datastream host system. The Static Request Expression Picker, displayed by clicking the Expression Builder button , on the Static Request screen, can display all user created expressions or Datastream global expressions, or both. See Using Expressions. A Refresh Grid button enables you to update the list of expressions held on your PC from the Datastream host system. Expressions can be used for static data requests where only one symbolic variable is used. For example, PCH#(X,1Y) calculates the percentage change over one year where X is either a single series or a constituent of a list that you select. Page 15 of 46
Using Excel with Datastream for Office

CREATING TIME SERIES REQUESTS

You can create time series requests for individual series (e.g. price indices, exchange rates, and expression,
etc.) as well as for your User created lists, and Datastream constituent lists. Unlike static data requests, you can
specify a time period which can start as far back as data is held for a specific stock right up to the latest value. A
Frequency format option enables you to define periodicity of the data required.
Time series requests are created by using the Time Series Request dialog from the Thomson Reuters
Datastream menu, supplying the required series (lists or expression), datatypes, time period, and frequency,
and clicking Submit.

Example

USING LISTS WITH TIME SERIES REQUESTS

When you use a Datastream list, or a constituent list with a static data request, between one and ten datatypes
are returned for each series in the list. When you use a Datastream list, or a constituent list with a time series
request, a sequence of data (i.e. the time series datatype and frequency) is returned for each constituent.
To indicate that you want a time series on each datatype that you enter, you must click the TS for each item in
list check box. This can be switched off in the options dialog.

Page 16 of 46
Using Excel with Datastream for Office

USING FUNCTIONS AND EXPRESSIONS WITH TIME SERIES REQUESTS

Selecting expressions

For time series data requests, you can browse and select expressions stored on the Datastream host system.

The Time Series Data Request Expression Picker, displayed by clicking the Expression Picker button          ,
on the Time Series Request screen, can display all user created expressions or Datastream global expressions,
or both. See Using Expressions. A Refresh Grid button enables you to update the list of expressions held on
your PC from the Datastream host system.
Expressions can be used for time series requests where only one symbolic variable is used. For example,
PCH#(X,1Y) calculates the percentage change over one year where X is either a single series or a constituent of
a list that you select.

Example - Percentage change over one year of market index constituents

Selecting dates

You can use locale date format such as mm/dd/yy – and the date will be held in the DSGRID formula in
universal date format, for example 2011-01-01, enabling the sheet to be opened in different locale date formats
(note if dates are entered in formulas in your locale data format, it will not then be possible to open with a
different locale).
Page 17 of 46
Using Excel with Datastream for Office

Dates can be typed as either a fixed date format, that is dd/mm/yy, or as a number of days (D), weeks (W),
months (M), quarters (Q), or years (Y) ago from today, for example -3D which is three days ago from today.
Note: If the Date field is left blank, the last value (which may be prior to the date of the request) will be retrieved.
You can also enter TODAY in the Date field to retrieve the latest intraday values. Latest Intraday prices are only
available for European equities and indices where real time prices are subscribed to.

USING SERIES EXPRESSION EDITOR IN STATIC AND TIME SERIES DIALOGS
The Expression Editor helps you to edit long strings you have entered in the Series/Lists (Time Series dialog) or
the Datatypes/Expressions (Static dialog) text boxes in Excel.
Series / Expression Editor launched from the Series/Lists (Time Series dialog)
In a Time Series request, you can enter series, datatypes and currency conversion combinations.

1.     Click the Editor button       next to the Series/Lists textbox in the Times Series dialog. Edit
       Series/Lists dialog is displayed.

2.     You can construct an expression in the Editor using the Navigator button                         and/or the

       Function/Expression/Currency pickers                           .

3.     Click the fx button    to select a function. Once you select a function and click OK, Function
       arguments dialog is displayed.

Page 18 of 46
Using Excel with Datastream for Office
4. When you click OK in the dialog above, if “X”, “Y”, “Z”, “A” is displayed the Expression field, then in the
text returned to the Editor - Series1, Series2, Series3, Series4 are displayed depending on the number of
substitutable variables in the function. In the example above, MAV#(X,1Y) is returned as
MAV#(Series1,1Y).
5. When you click the Expression Picker button in the Edit Series/Lists the Expression Picker is
displayed showing All the expressions on the ID. When you return the expression to the Editor it
returns the name of the Expression with symbolic placeholders “X”, “Y”, “Z”, “A” replaced by Series1,
Series2, Series3 or Series4, as appropriate.
6. But, when you click the Expression Picker button in the Datatypes/Expressions (both Static and
Time Series dialog) the Expression Picker is displayed showing only those expressions with 1 symbolic
variable.
7. When you click the Currency Picker button available in the Times Series request, Datatype
Currency dialog is displayed. Select a Currency and click Apply Last/Selected button to apply currency
like: SERIES~Currency (Eg: BAY~AL).
Other functionalities in the Expression Editor (both Static and Time Series dialog)
- Click this button to delete the text in the Editor area.
- Click this button to view classifications and metadata displayed from the Navigator. For functions, this
button is not enabled.
- Click this button to replace the selected item in the Selector grid below the text in the Editor area.
- Click this button to add Editor text as new item in Selector.
- Click this button to delete item from Selector.
Page 19 of 46Using Excel with Datastream for Office
- Click these buttons to move items in the Selector up and down.
SHORTCUTS WHEN ENTERING REQUEST DETAILS
The data request dialogs have two features that enable you to speed up your typing of request parameters.
These are:
Series, datatype, and date dropdown lists
This feature enables you to select from a dropdown list, under the Series, Datatype and Date field, series,
datatypes and dates that you have previously used in one Excel session. Simply click on the dropdown list
and select a series, datatype or date to copy it into the field.
Note: You can merge list using “Merge recently used lists” option from Options dialog.
Select last request parameters
You can re-insert the parameters for any of your previously used requests by clicking the History Button
and selecting the request details from the displayed list, for example:
Selecting the request details from this list inserts all the details in the relevant fields. Click Submit to issue
the request.
Page 20 of 46Using Excel with Datastream for Office FORMAT OPTIONS Format options for static and time series requests Format options are available on the Static Request and Time Series Request dialogs. These options enable you to choose how to display the data and what you can do with it. Check the check boxes to select the options. Note: Custom Header, Display Code and Display Latest First Value options are not valid for Static request. TS Format options: Yearly-Date and Quarterly-Date will display the dates in an Excel locale date format rather than 2011 or Q1 11. Select or deselect the required format options and click the Submit button. The selected options are displayed when you make a request. Click the Default Option button to return the format options back to their default settings, which are made on the Options dialog from the Thomson Reuters Datastream menu. EDITING AN DFO FORMULA DATA REQUEST There are two ways to edit data requests in Excel. You can use the Request Manager to view the details of all data requests DFO Formulas in your worksheet, edit the details, and resubmit the requests that are of interest to you. See Using the Request Manager, for further details. The quickest and most convenient method of editing a DFO Formulas data request in Excel is to using Edit Request option from Thomson Reuters Datastream menu. For example: You can also access Edit Request option from mouse right click menu. Page 21 of 46
Using Excel with Datastream for Office

Page 22 of 46
Using Excel with Datastream for Office

3 USING LISTS
CREATING A USER LIST FROM A SET OF CODES (DATASTREAM, ISINS, SEDOLS, ETC)
IN EXCEL (FOR EXAMPLE FROM A BACK OFFICE SYSTEM)

To create a local list:

1.     Select Create List (from Range) from the Thomson Reuters Datastream menu.
2.     The List Creation for Excel dialog is displayed.

3.     Click the Change Selection button to display the List's Code Range selection dialog.
4.     Specify the series for list creation by highlighting a range of cells or entering the cell range in the input
       field.
5.     Click OK button in List's Code Range selection dialog.
6.     Select the X# (User Created Indies) or L# (User Created List) button.
7.     Enter List name, note that list mnemonic must start with L# or X# and not exceed 8 characters.
8.     Check the Validate on Upload checkbox.
9.     Click OK.

Note: You can also use the Create List (from Range) option from Request Table.

Page 23 of 46
Using Excel with Datastream for Office
CREATE A LIST USING NAVIGATOR.
To create new list:
1. Select the Create List > Lists (Create from range) from the Thomson Reuters Datastream menu.
2. The Create New List dialog is displayed.
3. Enter list description in Description input field.
4. Add series in Quick Add input field (multiple codes can be entered separated by commas) or use the
Add Series menu option to find series from Navigator.
5. Use the controls at the top right to change the order or delete series.
6. Use the options at the top left to sort the series based in ascending or descending order.
7. Click the Save link and enter the L# mnemonic to use to retrieve the list.
8. Close the list dialog.
Note:
• If a Datastream maintained or a user list is used the constituents will be expanded out.
• You can also enter expressions – 009E(BARC) and series with datatypes BARC(PE) up to 12 characters.
• In addition to Datastream codes and mnemonics – you can also use other coding systems Datastream
supports such as ISINs and SEDOLs (these must be in the form Datastream recognises - UK3134865).
MODIFY AND EDIT LIST
To modify and edit a list:
1. Select the Modify / Edit List > Lists (Create from range) from the Thomson Reuters Datastream
menu.
2. The Modify / Edit List dialog is displayed.
3. Search the list that you want to edit.
4. Select Modify/ View list from the flyout.
Page 24 of 46Using Excel with Datastream for Office
5. Make the necessary changes.
6. Click the Save link.
USING CUSTOM HEADER IN TIMES SERIES REQUESTS
In a Time Series request, you can enter custom header for datatypes.
1. Choose Time Series Request from the Thomson Reuters Datastream menu.
2. Enter the required series and datatypes for the request.
3. Check Display Custom Header option, Add Datatypes to Custom Header window is displayed.
4. Click Datatype button for pick the required datatypes to use in the header from
Navigator.
5. Click 'DATATYPE' hyperlink to add the datatype selected for the request in the header.
Page 25 of 46Using Excel with Datastream for Office
6. Click button to add datatype to Selector area.
7. Click OK.
Other functionalities
- Click this button to delete the text in the Editor area.
- Click this button to view the datatype definition from the Navigator. For functions, this button is not
enabled.
- Click this button to replace the selected item in the Selector grid below the text in the Editor area.
- Click this button to add Editor text as new item in Selector.
- Click this button to delete item from Selector.
- Click these buttons to move items in the Selector up and down.
USING FUNCTION SELECTOR FOR EXPRESSION CREATION
1. Choose Time Series Request or Static Request from the Thomson Reuters Datastream menu.
2. Click Function Selector button , The Function Help dialog is displayed.
Page 26 of 46Using Excel with Datastream for Office
3. Select a function from the list, for example ABS# and click OK. You can search for a function either by
its Description or by the Group. The Function arguments dialog box is then displayed.
4. Click OK, the expression is displayed in Datatypes / Expression text field
OR
5. If you know the function name already, then you can directly enter the function name in
Datatypes/Expressions text field, and can use button for completing the expression.
Note: You can use Help on this function link for more details.
CREATING EXPRESSIONS USING INTELLISENSE FEATURE
Intellisense automatically lists all the available Datastream functions. You can then select one by using the
arrow keys and hitting a completion character when the correct member function is highlighted (note this feature
can be switched off in the DFO Options).
There are two ways you can create or select an expression with Intellisense:
Using Intellisense feature - Writing directly in Input field, and selecting expression.
Using Datatypes / Expressions Editor dialog.
Using Intellisense feature
Note: You can enable and disable Intellisense option from Options dialog.
1. Choose Time Series Request or Static Request from the Thomson Reuters Datastream menu.
2. Enter a function name manually followed by an opening bracket - eg. VAL# .
3. Then enter a datatype before a function (eg. NAME, VAL#( ) and enter a comma after the datatype.
4. A dynamic drop down list opens, select and enter the function from the list.
5. Expression parameter popup opens, as shown below
Page 27 of 46Using Excel with Datastream for Office
Note: Using these buttons you can see the different expression parameters details overloaded.
6. You can access Function help page by clicking on that particular function link eg. to know
more details.
7. In addition, you can access Function Picker by clicking on the Function Selector button to
complete your expression.
8. You can enter numeric values and/or maths operators before or after a function (eg. X/100*PCH# or
MAV#()+P).
Note: Intellisense functionality is available for both simple and nested functions.
Using Datatypes / Expressions Editor dialog
In a Time Series and Static request, you can enter datatypes and expression using Intellisense.
1. Click the Editor button next to the Datatypes/ Expressions textbox in the Times Series dialog. Edit
Datatypes / Expressions dialog is displayed.
2. Enter a function name manually followed by an opening bracket - eg. VAL# .
3. Then enter a datatype before a function (eg. NAME, VAL#( ) and enter a comma after the datatype.
4. A dynamic drop down list opens, select and enter the function from the list.
5. Expression parameter popup opens, as shown below
Page 28 of 46Using Excel with Datastream for Office
4 USING EXPRESSIONS
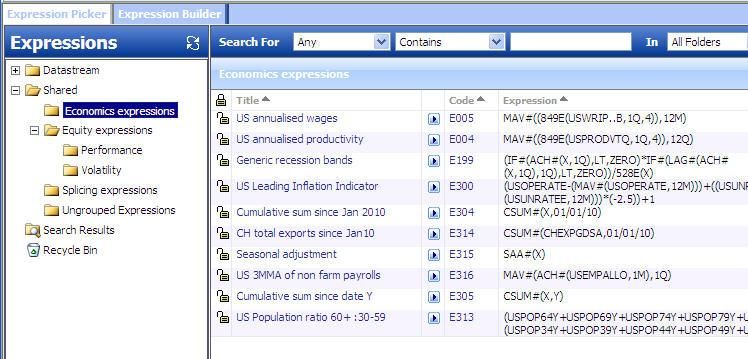
THE EXPRESSION PICKER
Several hundred useful pre-formatted Datastream expressions are available in the Expression Picker, together
with any user created expressions saved on your Datastream logon ID.
To select a stored expression:
Alternatively, you can also access Expression Picker via Expression Build button from Thomson Reuters
Datastream menu.
To find a stored expression:
1. Click the Expression Builder button from Thomson Reuters Datastream menu.
2. The Expression Builder will open in a new window.
3. Click the Expression Picker tab.
4. Select the expression you require by clicking the hyperlinked title or code.
5. If the expression contains any symbolic variables, specify the series or parameters you wish to use.
For more on the Expression Picker, Click the Help icon available on the Expression Picker window.
Page 29 of 46Using Excel with Datastream for Office
USING THE EXPRESSION BUILDER
You can create and edit your own expressions using Datastream‟s Expression Builder, where you can select the
individual components that make up your expressions.
Creating a new expression
1. Click the Expression Builder button from Thomson Reuters Datastream menu.
2. The Expression Builder will open in a new window.
3. If necessary, click on the Create New Expression icon on the toolbar.
4. If you know the syntax you wish to use, type it in the text box and press Enter.
Alternatively, you can build your expression using the tools and links displayed. For more on this, see
Creating a new expression or click the Help icon in the Expression Builder window.
For more on the Expression Builder, Click the Help icon available on the Expression Builder window.
Page 30 of 46Using Excel with Datastream for Office 5 USING THE REQUEST MANAGER You can create and embed any number and type of data requests in a single worksheet. For example, a worksheet could contain an embedded time series data request and a static data request. If you want to change the time period for one request, you would need to search through the worksheet to find the required request and use the right-mouse click Edit option. The Request Management facility, however, enables you to quickly pinpoint the required request and edit, refresh, autorefresh, or delete its details. The Request Manager dialog, displayed by selecting Request Management>Request Manager from the Thomson Reuters Datastream menu, displays details of all embedded requests within an Excel workbook. To edit, refresh, or delete a request, click on the request‟s detail line and click the appropriate button. Each detail line of the Request Manager dialog represents one request. The details include the mnemonics of the series, the cell/row location in the worksheet and the type of request. Buttons GoTo - click to locate the highlighted request within the worksheet. Edit - click to display the Request Type dialog with the details of the highlighted request for editing. Refresh - click to refresh the values/data of the highlighted request(s). Delete - click to delete the highlighted request(s). Select All - click to highlight all the requests displayed on this screen. This is particularly useful if you want to Refresh or Delete all requests. Page 31 of 46
Using Excel with Datastream for Office

6 USING THE REQUEST TABLE

WHAT IS THE REQUEST TABLE?

If your use of Excel involves building models using several requests for data from Datastream, you can use the
Request Table to administrate and edit these refreshable data requests. The request table is an Excel template
with additional facilities for entering request parameters as individual Excel rows.
These parameters include:

Creating and storing regularly used Datastream data requests in the form of a table enables you to:
     Hyperlink to the series metadata or the Datatype Definition.
     Use of the Editor dialogs to edit series and datatypes.
     Option to process the request table when it is opened.
     Facility to specify the “no data” string to use for the request table (overriding the PC option).
     Options to run the Datastream Charting templates in the workbook and refresh all Datastream Charts in a
     workbook after the table has processed.
     Update an L# list using a set of codes in a defined range.
     Options to displayed/not displayed notes/comments.
     Facility to refresh all the UCTS in the sheet(s) when the Request Table has finished processing (combined
     Request Table/UCTS templates only).
     Buttons to upload/download via a single click all UCTS in the sheet(s).
     Enable/disable individual requests when they are required/not required.
     View the details of all requests in one glance.
     Reference request input parameters from other worksheets.
     Construct the requests in the table in an order (sequence) that they need to be processed so that returned
     values can be used as input parameters in subsequent requests).
     Specify different cell and worksheet references for individual requests.
     Schedule the request table to be processed in the future and „out of hours‟.
     Continue processing, even if a datatype within a list of datatypes is invalid.

Page 32 of 46
Using Excel with Datastream for Office
Add a description against each row in the table.
Copy a code button onto work sheets to access the series/datatype lookup.
Link to charts and data.
YES or NO allow you to set request to YES or NO rather than toggle from Yes to No.
Functionality to update mainframe L# lists in the same way as Datastream Equity Screening.
Request Table and UCTS templates merged to allow existing RT sheets to be converted to merged
template.
CREATING A SET OF REQUESTS
To create a set of requests in a Request Table:
Note: You can insert the resulting data, using Data Destination, into several worksheets within the same or
different workbooks.
1. Select the New Request Table option from the Thomson Reuters Datastream menu.
2. You are now prompted to save the request table under a new name. Click Yes, supply the Request Table
name and directory location, and click Save.
Note: It is important that you do not overwrite the default Request Table template (Office 2007 and above
DFORequestTable.xltm) as this will form the basis for all your Request Table generation. We recommend
that you take a back up of the template, which is installed with Datastream in the location: C:\Program
Files\Datastream\Datastream DFO Add-In.
The next stage in creating a set of data requests is to enter the request parameters as a single row in the
worksheet labelled Request Table. To create other rows (i.e. data requests), repeat the following steps for each
request you wish to add.
1. Click on the worksheet tab labelled Request Table. An empty Request Table is displayed.
2. Click the Y, Y/N or N button to select the YES option - that is, refresh this request. This option can be turned
off by clicking the Y/N button again, where the cell contents will change to NO.
3. Select a Request Type by clicking the appropriate button. The buttons are:
S = Static data request
TS = Time series data request
TSL = Time series list data request
L = List update
4. Select a Format layout type from the dropdown list. You can select:
Format options Worksheet codes
No headings X
Row and column headings RC
Titles with row and column headings RCH
Titles with row headings RH
Row and column data transposed with no headings T
Row and column data transposed with row headings TR
Row and column data transposed with column headings TC
Row and column data transposed with row and column headings TRC
Page 33 of 46Using Excel with Datastream for Office
In addition to the above formats, you can display the currency of the series selected in your request table. This
format option is selected by clicking the Always Include Currency check box on the Options dialog. See
Request Table options. This feature is primarily intended to provide compatibility with earlier versions of the
Request Table. If the Always Include Currency option is selected, any format options selected will have the
currency symbol ($) appended to the worksheet code; for example RC$.
5. Select series or lists (i.e Datastream mainframe lists and constituent lists) using the Series Lookup
buttons. If the Request Type you selected is S or TS, click the Series Navigation button to display the
Series Selection screen (see Selecting Series). You can select any number of series. If the Request Type
you selected is TSL, click the List Picker button to display the List Picker (see Selecting lists).
6. Select a datatype, expression, or search format (created in the Datastream interface) by clicking the
appropriate button. If you have selected Request Type S, you can select datatypes (see Selecting
Datatypes) and expressions (see Selecting Expressions). If you have selected Request Types TS and
TSL you can only select datatypes. If you have selected Request Type SCH, you can select the search
format.
7. Place the cell cursor in the next adjacent cell, e.g., G7, and enter either a fixed start date in the form
dd/mm/yy, a relative start date in the form -nY (that is n years ago from the End Date), or -nYE to retrieve
accounts data for n year ends. For static data requests, this field is used to specify the date for which the
data is to be requested.
8. Place the cell cursor in the next adjacent cell, e.g., H7, and specify an End Date in either a fixed date or
relative end date format. This date is only needed for time series requests and can be left blank to specify
previous day values.
9. Place the cell cursor in the next adjacent cell, e.g., I7, and select a data frequency from the dropdown list.
The options are:
Daily
Weekly
Monthly
Quarterly
Yearly
10. Place the cursor in the next adjacent cell, e.g., J7. The next step is to specify where the result of the data
request is to be inserted. This can be a specific cell location in any new worksheet within the same
workbook, or a specific cell location in a different workbook. To specify a cell location in a worksheet
within the same workbook:
○ Insert a new worksheet from the Insert menu.
○ Click on the Request Table tab
○ With the cell cursor at J7, click the Data Destination button. The Create Destination Reference
screen is displayed. Click on the required worksheet tab and then click on the required cell location to
automatically paste the cell reference into the dialog, for example:
○ Click OK to insert the cell reference into the request table.
If you want to specify a cell reference in another workbook, simply click the Data Destination button,
open the required workbook, activate the required cell and click OK on the Create Destination
Reference screen.
11. You must now choose whether you want the data destination cell location to be displayed as either plain
text reference or as a dynamic Excel formula. If you select the Display Destination as Excel Formula
Page 34 of 46Using Excel with Datastream for Office
option, this enables the position of the data results to be moved in the worksheet (e.g. after inserting a
new row or column). If you select this option, any future processing of the Request Table will take into
account the new cell location. If you do not select this option, the data will always be inserted at the
same cell location.
If the destination reference is to a closed external workbook, you must ensure that the Display
Destination as Excel Formula check box is selected to enable the request table to open the workbook.
This is particularly important if you are scheduling the Request Table to be refreshed „out of hours‟ and
the Request Table contains references to external workbooks that will be closed when the process is
run.
12. Skip the cell column for Status as this is used by Datastream to inform you of the status of the latest
update of this request. OK indicates the update has been successful.
13. Place the cursor in the next adjacent cell, e.g., L7, and enter a short (optional) description for the request.
14. From the Excel File menu, select Save to save the details of your Request Table.
The request is now ready to be processed.
CONVERTING AFO REQUESTS TO DFO REQUEST TABLES
1. Select Conversion Wizard from the Thomson Reuters Datastream >New Request Table menu.
2. DFO Conversion Wizard dialog is displayed.
3. Select the Convert AFO Request Table to DFO Request Table option.
4. Click Setup to display the setup screen. Enter the path on your PC where the Datastream for Office
(DFO) Request Table template (DFORequestTable.xltm) resides and click the Backup option check box.
5. Click OK to close Setup options.
6. Click Next.
Page 35 of 46Using Excel with Datastream for Office
7. Click Add and navigate to where the Excel workbooks that contain the AFO embedded links are
located. Select the required .XLS workbooks and click OPEN. The workbooks you have selected
appear in the conversion wizard.
8. Click Next and then click Finish.
9. You are now asked to confirm the conversion. Click OK. The conversion process now starts.
10. When the conversion process is complete, the message appears - Finished, no conversion errors
encountered. Click OK to quit the Conversion Wizard.
Similarly, you can also:
a. Convert AFO Request Table to DFO RT / UCTS
b. Convert AFO RT / UCTS to DFO RT / UCTS
c. Upgrade DFO 1.0 RT to DFO 2.0 RT
d. Upgrade DFO 1.0 RT to DFO 2.0 RT/ UCTS
e. Upgrade DFO 1.0 RT/ UCTS to DFO 2.0 RT / UCTS
Note: Destination cell that was selected using “Set Destination Cell” option will not be retained in the Find
Series control of Request table when AFO RT is converted to DFO RT.
Page 36 of 46Using Excel with Datastream for Office
THE SERIES NAVIGATION BUTTON
You can link the Series Navigation button to a cell in the Request Table, giving you access to
the Datastream series selection dialogs (for all series including user lists). Double click on the Series Navigation
button on the spreadsheet to select a different series.
Note 1: You can use option for to searching a series that match very specific criteria.
Note 2: For more on the Datastream Navigator, Click the Help link available on the Datastream Navigator
window
Alternatively, you can also access Navigation from Thomson Reuters Datastream menu.
SEARCH FOR DEAD CODES
You can search dead code in worksheet or active sheet
Search for Dead Codes in worksheet
1. Submit a Static Request or Time Series Request from the Thomson Reuters Datastream menu.
Note: Make sure the Hyperlink to Metadata box is checked.
The results are displayed in the spreadsheet with row and column headings (if selected). A hyperlink is
added to the series code and when clicked links with the Navigator Classifications and Metadata page
for the series.
Page 37 of 46Using Excel with Datastream for Office
2. Select Thomson Reuters Datastream >Manage Requests >Search for dead codes – Active Sheet.
The series that are now dead or inactive are identified and displayed in the same worksheet in red as
shown below:
Search for Dead Codes in workbook
1. Submit a Static Request or Time Series Request from the Thomson Reuters Datastream menu.
Note: Make sure the Hyperlink to Metadata box is checked.
The results are displayed in the spreadsheet with row and column headings (if selected). A hyperlink is
added to the series code and when clicked links with the Navigator Classifications and Metadata page
for the series.
2. Select Thomson Reuters Datastream >Manage Requests >Search for dead codes - Workbook
The series that are now dead or inactive are identified from the entire workbook and the combined
result is displayed in a new worksheet Datastream dead codes as shown below:
Set Hyperlink to Metadata as a default option
1. Choose Options from the Thomson Reuters Datastream menu. The Options dialog is displayed.
2. Select the Hyperlink to Metadata checkbox and click OK.
Page 38 of 46Using Excel with Datastream for Office
CONVERT AFO CONTROLS TO DFO FORMULAS
1. Select Convert AFO to DFO from the Thomson Reuters Datastream > Manage Requests menu.
2. Click Next.
3. Click Add and navigate to where the Excel workbooks that contain the linked DDE requests are located.
Select the required .XLS workbooks and click OPEN. The workbooks you have selected appear in the
conversion wizard.
4. Click Next and then click Finish.
5. You are now asked to confirm the conversion. Click OK. The conversion process now starts.
6. When the conversion process is complete, the message appears - Finished, no conversion errors
encountered. Click OK to quit the Conversion Wizard.
CALCULATION MODE
You can prevent Thomson Reuters Datastream Add-In from updating data or adding new values by turning the
calculation mode from Automatic to Manual. When you are in Manual calculation mode, no values on your
spreadsheet update.
For example, you can use Manual calculation mode if you are making changes to an expression but do not
want the values to update in it or if you want to add a data item to your spreadsheet but do not want values to
accompany the data item.
If you process a request while you are in Manual calculation mode, the value displays "Manual Calculation."
While you are in Manual calculation mode, you can refresh selected cells, the active worksheet, or the entire
workbook. After you refresh, the items that displayed "Manual Calculation" change to the updated values.
The default calculation mode is Automatic.
When you save a workbook that is in Manual calculation mode, no values update.
To turn off Automatic calculation mode
1. On the Thomson Reuters Datastream menu, select Automatic Calculation from Refresh Data drop
down.
2. To refresh a cell or multiple cells while in Manual calculation mode, highlight the cells, go to the
Thomson Reuters Datastream menu, select Refresh Selected Cell(s) from Refresh Data dropdown.
3. To refresh the active worksheet while in Manual calculation mode, go to the Thomson Reuters
Datastream menu, select Refresh Active Worksheet from Refresh Data dropdown.
4. To refresh the entire workbook while in Manual calculation mode, go to the Thomson Reuters
Datastream menu, select Refresh Entire Workbook from Refresh Data dropdown.
5. To return to Automatic calculation mode, go to the Thomson Reuters Datastream menu, select
Automatic Calculation from Refresh Data drop down.
Page 39 of 46Using Excel with Datastream for Office
THE DFO INDEX
The DFO Index spreadsheet enables you to schedule several request tables to run at a preset time and date.
These tables are opened, updated, and closed when the DFO Index is run.
Using the DFO index with a 3rd Party scheduler
You can use a 3rd party scheduler to run the requests in the DFO index. For example, Schedule Tasks installed
with Internet Explorer 5.
To use the DFO Index:
1. Choose Request Table from Thomson Reuters Datastream menu.
2. Click the Add to Index button.
3. Add to DFO index message box is displayed. Click Yes button to add the current Request Table to
DFO Index or Click No to cancel.
DFO Index is opened.
4. Click the Update button to select the Update option - that is, refresh this request. This option can be
turned off by clicking the Update button again, where you do not want to refresh select Ignore button.
5. Select Request Table path, by clicking Select button, then browse, and select xls files.
6. Check Close down after Processing checkbox if you want to close DFO Index file after the process is
completed. (this optional)
7. Check Run on Startup checkbox if you want to run the DFO Index when opened. (this optional).
Note 1: If your User Account Control (UAC) is high in Windows Vista and above operating system you will not
be able to save Index spreadsheet in Default location.
Workaround: Save Index spreadsheet in different location and configure the same path in Options > Request
URL Settings dialog.
Note 2: The DFO Index only works with request tables.
Note 3: You need to check "Enable Login on Startup" option from Options dialog before scheduling Index
spreadsheet.
Page 40 of 46Using Excel with Datastream for Office
USER CREATED TIME SERIES
This workbook also includes a Request table to enable series to be downloaded manipulated - and then
uploaded these series back to Datastream to be charted.
A user time series is a series of values (data) for different points in time created by you and uploaded for storage
on Datastream. The values can be daily, weekly, monthly, quarterly, or yearly and you can save the series in
management groups to help you organise them. You can combine them with Datastream maintained series and
use functions and expressions to manipulate them. An Excel template is used to create and edit your time
series. You can download an existing series to form the basis of a new one.
THE USER CREATED TIME SERIES TEMPLATE:
Name The series name (up to 64 characters).
Code The series code. Use this to retrieve your series in Datastream and DFO.
This must start with TS followed by 6 characters, eg TSUKRPI1.
Mgmt. Group Management group. 1 - 10 characters. You can have up to 200 series in a group, eg UK.
Decimals The number of decimal places for your values.
As % No indicates the series are actual values. Yes indicates the series are expressed as
percentages.
Freq. Conv. Determines the adjustment to make when you use a series at a lower frequency than it is
stored. For example, using series stored with daily values in a request for weekly values.
Sum Sum all values for a calendar period. Avg - Average all values for a calendar period. End -
The value at the end of a calendar period. Act - The actual value at the calendar intervals.
Page 41 of 46Using Excel with Datastream for Office
Date align. For data adjusted for frequency, select where in the calendar period to align the data for
plotting.
1st - Plot data from the beginning of the calendar period.
Mid - Plot data from the middle of the calendar period.
End - Plot data from the end of the calendar period.
Carry ind. For null values. You can leave the values blank or carry forward the previous value.
Yes - carries the previous value. No - leaves the value at null.
Upload type When editing a series, you can upload only the values that have changed.
Full - uploads all the values in the series.
Partial - uploads the values that have changed.
Set date range This is used to set the start and end dates, and the frequency for new series. Use this to
change the end date when extending the series.
Optional:
Units A qualifying unit for your data. For example: tons, U$ millions, index.
Currency Select a currency for series with monetary values.
Other fields:
Start date The start date for the series data.
End date The end date for the series data. Note, you can change this for Partial uploads - only data
after the end date is uploaded.
Frequency The frequency of values: daily, weekly, monthly, quarterly, or yearly.
CREATING A USER CREATED TIME SERIES
To create a time series:
1. Select New UCTS & RT sheet from the Thomson Reuters Datastream menu and save the workbook.
2. Type a name for the series.
3. Type the series code. This must start with TS followed by 6 characters, example TSUKRPI1.
4. Type the management group you want the series to belong to (up to 10 characters) example UK.
5. Select the number of decimal places for display. Type the number, or select from the drop down box and
click the Add button.
6. Type the units, (optional). This is a qualifying unit for your data. For example: tons, U$ millions, index.
7. Select As %. No indicates the values are actual values. Yes indicates the values are expressed as
percentage. Used in the Latest Values and % change over 3 periods report.
8. Select the type of Frequency conversion. This determines how the series is handled if you use it a lower
frequency than it is stored.
9. Select the Date alignment for data adjusted for frequency.
10. Select a Currency for monetary values (optional).
11. Select the Upload type. Select Full to upload all the values.
Use Partial to upload only the values that have changed when editing a series.
Page 42 of 46Using Excel with Datastream for Office
12. Set the date range. Click the Date range button and type the start and end dates.
Select the frequency of the data: Daily, weekly, monthly, quarterly, or yearly.
The dates are displayed in the date range column, ready for values to be added.
13. Type your values against the dates displayed.
14. Click the Upload button to save your series. Note the cursor must be in the Code field to upload the
series. You can highlight more than one series to upload several series at the same time.
Note: You can also use Upload All button to upload all of the time series in worksheet, or the Download All
button to download all the time series.
You can now use this series in Datastream or DFO requests.
EDITING AN EXISTING USER CREATED TIME SERIES
To edit a user created time series:
1. Select New UCTS & RT sheet from the Thomson Reuters Datastream menu and save the workbook.
2. Click the Select code button. Note the cursor must be in the Code field.
Datastream navigator is displayed with the series set up on your Datastream ID.
3. Search for and select the series you want to edit.
The selected series mnemonic is displayed in the Code field.
4. Click the Download button. Note the cursor must be in the Code field.
5. If you want to add new values, click the Set date range button and type a new end date.
6. Make your changes and select the Upload type.
Use Full upload to overwrite all existing values.
Use Partial upload to update only the new values and change the date in the End date field to indicate
the new values to upload.
Note: see tick box in Options dialog.
7. Click the Upload button to save the series. Note the cursor must be in the Code field.
To delete a time series:
1. Place the cursor in the Code field of the series you want to delete.
2. Click the Delete button to delete the series.
To add a new worksheet to the workbook:
If you want to download or upload a series with an earlier start date or a different frequency, add a new
worksheet.
1. Click the New Sheet button.
A new worksheet is displayed.
To configure the template:
1. Click the Options button.
The Options dialog is displayed.
2. Tick the Overwrite all values if series already exists box to overwrite existing values.
Note: The server for Navigator is configured via the Thomson Reuters Datastream >Options>Request URL
Settings menu.
Page 43 of 46You can also read