Cloud-based traffic data fusion for situation evaluation of handover scenarios - arXiv
←
→
Page content transcription
If your browser does not render page correctly, please read the page content below
27th ITS World Congress, Hamburg, Germany, 11-15 October 2021

                                              Paper ID #

     Cloud-based traffic data fusion for situation evaluation of handover
                                  scenarios

                      Andreas Otte1*, Jens Staub1, Jonas Vogt1, Horst Wieker1
         1. htw saar, University of Applied Sciences Saarbrücken, Germany, andreas.otte@htwsaar.de

Abstract
Upcoming vehicles introduce functions at the level of conditional automation where a driver no longer
must supervise the system but must be able to take over the driving function when the system request
it. This leads to the situation that the driver does not concentrate on the road but is reading mails for
example. In this case, the driver is not able to take over the driving function immediately because she
must first orient herself in the current traffic situation. In an urban scenario a situation that an
automated vehicle is not able to steer further can arise quickly. To find suitable handover situations,
data from traffic infrastructure systems, vehicles, and drivers is fused in a cloud-based situation to
provide the hole traffic environment as base for the decision when the driving function should be
transferred best and possibly even before a critical situation arises.

Keywords:
TRAFFIC DATA FUSION and AUTOMATED DRIVING HANDOVER

Introduction
Modern road infrastructure is already able to capture information about traffic situations. Today,
sensors like traffic cameras, induction loops, or floating car data [1] are mostly used to determine
traffic flow and road utilization. The use of optical sensors like camera systems not only allows the
detection of road users, but also the determination of their location, classification, direction of
movement and speed. This information is especially valuable for automated vehicles: they can store
this information in their Local Dynamic Map (LDM) [2] and use it for their trajectories planning and
for collision avoidance calculations. Furthermore, in conditionally automated vehicles of SAE level
three [3], this information can also help to plan and execute handover manoeuvres between the
automated driving function and the human driver. These manoeuvres require the driver to take over
control of the vehicle and are necessary if the automated vehicle is not capable to handle a current
situation or a situation closely ahead. By using additional sources of information, this handover
process can be performed more safely and foresighted.
The German research project kantSaar [4,5] aims to capture the driver’s state by using sensors inside
of the vehicle. The in-vehicle sensors track information about the vehicle's state and trajectory, as well
as the driver's level of attention and stress. Fusing the neurocognitive data of the driver, the vehicle's
state and the traffic and environmental information from the vehicle and the traffic infrastructure to a
combined data set creates a model of the current traffic situation. The set combines data subjectively
Cloud-based traffic data fusion for situation evaluation of handover scenarios
experienced by the driver and data objectively perceived by the sensors. Up until now, infrastructure
data fusion for intelligent transportation systems is mostly done only from one side, infrastructure or
vehicle (e.g. [6,7,8,9]). Jabber et al. [10] are working on a similar approach as kantSaar but only based
on data from the vehicle and no data from the traffic infrastructure or V2X data. Additionally, they use
an existing data set for the in-vehicle driver information whereas kantSaar creates own passenger data
to be able to create a minimal intrusive system. A database with such traffic situations can be used to
identify and evaluate stressful situations and draw conclusions about the effect of specific parameters
on the vehicle and its driver in specific situation. This knowledge allows the creation of a map,
showing road segments, either difficult for automated vehicles or stressful for the driver. In the future,
an AI-based generalization and transfer of the results to other cities and intersections is planned, which
should minimize the sensor data needed and make monitoring of every driver redundant.
Approach
The neurocognitive data and the traffic data originate from two different (sub-) systems. In a first step,
the data needs to be gathered. As traffic is a highly dynamic environment, it cannot be ensured that a
single local node can collect all information about the current traffic situation. Cooperative vehicles
exchange information about their position, speed and heading by using Cooperative Awareness
Messages (CAM) [11]. In turn, road infrastructure can detect non-cooperative vehicles and vulnerable
road users (VRU) by using sensors and detectors. The information about their position, speed, direction
of movement etc. can be transmitted using Collective Perception Messages (CPM) [12]. Those CAM
and CPM are transmitted using dedicated short-range communications (DSRC) like ETSI ITS-G5 or
C-V2X. The vehicle under test (VUT) as part of the DSRC network cannot ensure to receive every
message and has therefore a possible lack of information. This also applies to the road infrastructure,
which is in addition not aware of a driver’s condition. Therefore, none of the participants possess a
complete set of information and is only able to perform an incomplete data fusion. To fuse all the
gathered data, a cloud service is introduced.
Before the data can be transmitted to the cloud-based Data Fusion service (DF), it needs to be
supplemented with meta information. Time and location information as well as the identity of the data
originator need to be added to the data sets. Positioning information originates from global navigation
satellite systems like GPS. GPS also provides timing information and allows to synchronize the
participants of the DSRC network. The originating system is identified by a temporary identifier, e.g.,
the station ID of the ITS facility layer. The data originating stations need a connection to the cloud-based
data fusion service. In case of the VUT, cellular communication is used to transfer the collected data to
the DF. Regarding differing coverage, the transmission shall be able to be performed with low signal
quality. Therefore, the sensor data and its meta information are packed sparingly. To reduce the
overhead of reliable transmission, the data is collected over a time interval and is then transmitted with a
single transaction. Within each transmission, a meta information block with an absolute reference time,
position and identity is created. Every individual information contains a relative time and position,
which is smaller than the absolute values. To enable interoperability, the data needs to be serialized. The
2Cloud-based traffic data fusion for situation evaluation of handover scenarios
DF is then independent of the implementation of the data aggregators. It receives the collected data and
stores it in a database. First, each type of information, for instance CAM information, CPM information
or the sensor set of the VUT and the infrastructure, gets stored in separate tables. Then, the Data Fusion
checks for and if found deletes duplicates in each information table. The DF processes the data, select
road users from the different sets of raw data, merges them and creates a digital map. Therefore, the data
previously contained in multiple information tables, gets joined into one data structure and duplicate
entries, for example emerging from the simultaneous detection of an object via multiple different ways,
get eliminated. The process described here has not been designed to perform an in situ analysis and to
directly send a recommendation to a partially automated vehicle. The goal is rather to evaluate situations
later, to be able to draw conclusions for similar situations in the future without the need of cloud-based
data processing. This approach is therefore independent of transmission duration by the used cellular
connection and the data can be periodically transmitted in batches.
Architecture
The system architecture of the data aggregators and the Data Fusion is shown in Figure 1. It is split in
two parts: The Remote Station Plane and the Backend Plane. The Remote Station Plane contains
infrastructure systems called roadside ITS stations (ITS-S) and vehicle ITS-S. The VUT is a research
vehicle ITS-S with a driver monitoring system. The backend plane consists of services pre-processing
gathered data of the remote station plane and additional third-party data suppliers as well as the Data
Fusion and the Situation Evaluation. The raw, fused and evaluated data is stored in the Situation Storage.
Figure 1 Aggregation and fusion architecture
3Cloud-based traffic data fusion for situation evaluation of handover scenarios
The Traffic Data Aggregator Client (TDAC) is present in both vehicle and infrastructure system. Its
purpose is the collection of V2X messages that originated from or were received by this station.
Especially Cooperative Awareness Messages (CAM), Decentralized Environmental Notification
Messages (DENM), Signal Phase and Timing Messages (SPAT) and Collective Perception Messages
(CPM) are gathered. MAP Messages describing the topology of an intersection are not transmitted but
already stored in the Traffic Data Aggregator, as they change rarely. From these message types, only a
subset of valuable information is gathered, respectively. Further information is gathered from road
infrastructure, which can be equipped with various sensors. Modern traffic light systems react on
changing traffic conditions and switch signal phases dynamically. The information about different
triggers like induction loops, optical sensors or specialized prioritization systems for public transport
can be gathered as well and sent to the Traffic Data Aggregator on the backend plane.
Environmental sensors, for example to measure air quality, air and surface temperature, or pollution
and noise level can be attached to roadside ITS-S and supplement the sensor data. Those data are sent
to the Environment Data Aggregator in the backend plane.
The Vehicle Data Aggregator (VDA) collects sensor data of the VUT directly from the vehicle’s CAN
bus systems. To allow an efficient use of bandwidth, the different types of CAN data are transmitted in
different temporal intervals, for instance the current lateral acceleration is transmitted more often as
the state of the wiper system. Using a sensor data abstraction layer, so the same implementation of the
aggregator can be used in different VUT, the VDA registers for a subset of the available vehicle data
listed in Table 1.
Table 1 Selection of in-vehicle sensor values
Value Description
Brake System Status of the brake system including brake actuation, status of Antilock
Braking System and if a panic braking is performed
Clutch and Gear Status of the clutch pedal (if available) and the current gear
status
Door position Position of each door (closed, ajar or open)
Exterior Lights Low and High beam status, fog lights, emergency lights, hazard warning
system, turning signals
GNSS GNNS position information
Speed Vehicle speed and longitudinal and latitudinal acceleration
Rain Sensor Rain intensity sensor and wiper system
Yaw Yaw rate, yaw velocity, steering wheel angle and steering wheel velocity
As the transmission of datasets involves overhead, the sensor data is not directly forwarded on
reception but collected and stored in a local vehicle data storage. Therefore, the collected data is
4Cloud-based traffic data fusion for situation evaluation of handover scenarios
transmitted periodically via the interface VDA_DF. The period can be adapted on changing
circumstances (mobile reception quality, number of changes, etc.). If the transmission was successfully
acknowledged, the local storage is cleared.
The Driver-related Data Aggregator (DDA) has access to sensors that monitor the state of a passenger.
A combination of contact-based and contactless sensors tracks heart rate, surface temperature in
specific regions of the driver’s face, skin conduction and brain activity (EEG). Based on this data, the
level of stress, fatigue or even distraction can be determined [13]. Stress is further stripped down to
five-scaled arousal and valence values following the Self-Assessment Manikin (SAM) [14] method.
With the use of SAM, a later self-evaluation of the driver’s emotional state as well as the automated
capturing by the mentioned sensors is enabled.
The function of the Environment Data Aggregator is to collect environment data and provide it to the
Data Fusion. This data is primarily weather data. Weather information is an important part of road
traffic and can significantly affect a traffic situation. The weather data, which is collected in the
Environment Data Aggregator, is bound to a timestamp with a validity as well as a location area. It
describes the current weather condition using information about temperature, precipitation, wind, light
and visibility conditions, pressure, humidity, and cloudiness.
The Traffic Data Aggregator receives information from various TDAC. Its purpose is to preprocess the
information. As V2X messages can be received by different participating stations in an area, its
containing information can be forwarded more than once. The Traffic Data Aggregator identifies and
deletes those duplicates. The resulting set of messages is then sent to the Data Fusion.
The Data Fusion is the central component of the backend plane. It receives all defined data classes:
Environmental data, traffic data, vehicle data and driver-related data. On reception, the Data Fusion
stores the raw data in the Situation Database. The goal of the Data Fusion is a digital representation of
traffic situations merged with information from the environment, the VUT and the driver.
Data Fusion Process
To create traffic situations, the data fusion process is triggered manually on request by an operator by
choosing the VUT identifier and the desired timestamp. In a first step, the data sets to fuse are queried
with the use of time and location information given by the requested timestamp and the location of the
VUT. In order to eliminate duplicated information within the traffic objects provided by various
sources, the traffic objects need to be transformed to a common data format. Duplicates may occur
while joining CAM and CPM information as well as the position vector of the VUT and the
infrastructure sensor set. The quality of the fusion depends on the information quality of the detected
traffic objects. A flawless accuracy cannot be reached in real environments, which leads to unequal
digital representations of the same real traffic object. Only the similarity between the objects can be
used to identify objects representing the same real object. Two objects are similar, if the differences
regarding their positions, directions of movement, speeds and classifications are within defined
thresholds that are chosen by the estimated error of the input sensors. The traffic objects are clustered
using dynamic course ranges depending on the objects speed. A similarity check is performed within
5Cloud-based traffic data fusion for situation evaluation of handover scenarios
the clusters to identify and remove duplicates. Clustering by courses provided a performance
advantage over clustering based on the location of the objects when focusing on intersections as the
number of comparisons could be reduced. Focusing on highways or rural roads, this clustering method
does not provide any advantage.
Another aim of the data fusion process is to provide a structured access for later evaluation. Therefore,
a relational database is used. The data base scheme is provided in Figure 2. A situation is described by
a geographical area and a point in time as well as a unique situation identifier. All matching detected
objects extracted from CAM, CPM and other sensors are merged and again checked for duplicates.
Topology information gathered from MAP messages is directly merged with the signal phase
information stored in corresponding SPAT messages. The sensor data of the VUT and the
driver-related data do not differ to its raw format and therefore just needs to be copied and linked to
the situation. Also, hazardous events, like a panic braking or an emergency vehicle warning are stored
and linked to the situation.
Every data, matching position and time, is linked to the ID of the situation. Additionally, traffic objects
can be linked to a lane, to create a lane-wise representation of a road segment. Eventually the
evaluation of the recorded situations is performed and the suitability for a handover is determined.
Figure 2 Simplified database scheme of situation storage
Results
The described aggregation and fusion architecture has been used in test drives in the German cities of
Saarbruecken and Merzig. Within twelve months, about 6.000 situations have been created by the data
fusion based on 2.0 million camera-based detected objects (as parts of the CPMs), 3.8 million
Cooperative-Awareness Messages (CAM) and 600.000 sensor extracts of the vehicle under test.
6Cloud-based traffic data fusion for situation evaluation of handover scenarios
Additionally, 2.500 records of the driver status were captured.
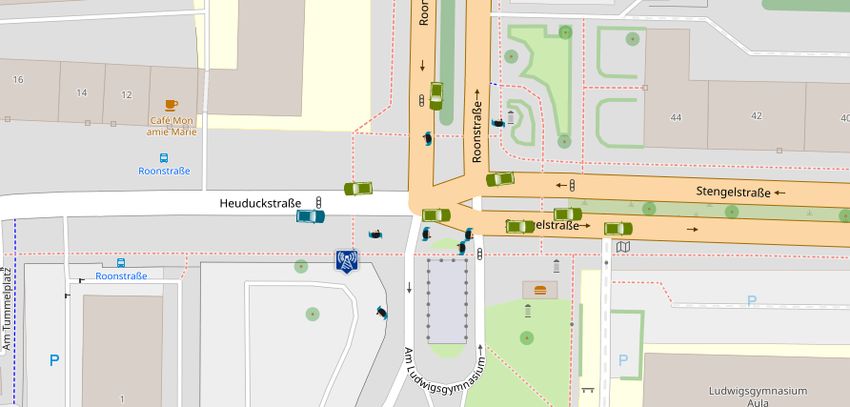
Figure 3 shows an actual created situation visualized by a map application. The blue car represents the
VUT, the green cars and the pedestrians were detected by the infrastructure camera system and sensors
of the VUT including V2X technology. For the map representations in the example shown, map tiles
from OpenStreetMap [15] and CARTO [16] were used.
Figure 3 Visualization of a recorded situation
In addition to the visual representation on the map, Table 2 contains the position vector of each
detected dynamic traffic object as well as four parameters for later evaluation. Besides the distance of
the traffic object to the VUT, two different time to intersection (TTI) and a relative urgency (RU) is
provided. TTIOBJ describes how many milliseconds a traffic object takes to get to the intersection point
with the VUT, TTIVUT accordingly. If TTI is set to -1, there is no intersection between the traffic object
and the VUT in the future. RU provides an estimate of how fast two objects shorten their distance to
each other. The higher the RU value, the smaller the approach.
Table 2 Traffic objects of the resulting situation
ID Classification Lat Lon Speed Course Distance TTIOBJ TTIVUT RU
(°) (°) (m/s) (°) (m) (ms) (ms)
3 PASSENGER CAR 49.2340183 6.9823835 3.46 267.2 11.27 -1 -1 893
2 PASSENGER CAR 49.2339679 6.9826028 7.57 89.0 25.62 -1 -1 6598
47 PEDESTRIAN 49.2339251 6.9826933 1.48 270.8 32.58 -1 -1 2530
10 PASSENGER CAR 49.2339447 6.983114 14.22 90.0 62.78 -1 -1 MAX
188 PASSENGER CAR 49.2340355 6.9827828 3.18 263.6 39.44 -1 -1 2759
143 PEDESTRIAN 49.2338076 6.9824494 0.41 225.0 22.85 -1 -1 2980
58 PASSENGER CAR 49.2339706 6.982973 8.13 89.1 52.50 -1 -1 15811
201 PASSENGER CAR 49.2339473 6.9828387 10.33 90.0 42.80 -1 -1 37118
160 PEDESTRIAN 49.2341248 6.9827959 4.04 3.9 43.36 -1 -1 5194
7Cloud-based traffic data fusion for situation evaluation of handover scenarios
149 PEDESTRIAN 49.2339105 6.9823796 1.69 243.4 11.29 -1 -1 1054
200 PASSENGER CAR 49.2341879 6.9826028 7.57 183.0 35.52 3720 3089 2654
481 PEDESTRIAN 49.2339219 6.9826735 1.48 95.6 31.15 -1 -1 3138
48 PEDESTRIAN 49.2339224 6.9824532 2.57 356.0 15.59 1639 1315 1295
162 PEDESTRIAN 49.2341248 6.9825959 1.86 260.3 30.66 -1 -1 2857
Driver-related data in form of stress stripped in valence and arousal are gathered as well. Valence and
arousal can each take values on a five-point scale. A one as an arousal value means exited or frenzied
whereas a five means calm or sleepy. A one as a valence value means happy or pleased whereas a five
means unhappy or melancholic. A three in both scales corresponds to a neutral stress level. In this very
example, the driver performed a self-evaluation and rated a two in valence and a three in arousal,
which a not very stressful situation. Based on the gathered stress data of the driver along the test track,
a stress-map was created as shown in Figure 4.
Figure 4 Stress-map of the test drive in the city of Saarbruecken
The stress-map utilize a quad tree [17] to store and combine the stress information along the test track.
The used colour code is based on the exemplary matrix shown in Figure 5. The exact interpretation of
the valence and arousal values is to be done in a later step and is not part of this paper.
8Cloud-based traffic data fusion for situation evaluation of handover scenarios
Arousal
1 2 3 4 5
Valence
1 Relaxed
Slightly
2
stressful
Moderate
3
stressful
4 Stressful
5
Figure 5 Exemplary matrix for the interpretation of the level of stress
Conclusion
The project results have shown that the previously described architecture has been implemented and
used successfully. The database of traffic situations, generated during the numerous test drives, in
addition to the driver-related data, creates a new dimension for evaluating traffic situations, by
accounting the drivers levels of stress and attention. This evaluation can be performed in a traffic
control centre to gain and maybe even provide information about current traffic. Furthermore, the data
sets can be used to train neural networks, to forecast stressful traffic situations and provide information
for useful handover manoeuvres between the driver and the automated driving function.
Additionally, our research has shown, that monitoring multiple VUT in the same traffic situation might
give further insight on the complexity and stressfulness of this situation, by providing multiple driver
perspectives. This is a topic for future research.
Acknowledgements
The work of this paper has been funded by the German Federal Ministry of Transport and Digital
Infrastructure within the project kantSaar (grant number 16AVF2129). The operative project
consortium consists of the University of Applied Sciences Saarland and the University of Saarland.
The project approach and the partial project outcomes result from the collaborative work of the entire
kantSaar project team of htw saar.
References
1. Tiedong, Jingjing (2014), Applying floating car data in traffic monitoring, 2014 IEEE
International Conference on Control Science and Systems Engineering, Yantai, pp. 96-99, doi:
10.1109/CCSSE.2014.7224516.
2. European Telecommunications Standards Institute (2014). ETSI EN 302 895 Intelligent Transport
Systems (ITS); Vehicular Communications; Basic Set of Applications; Local Dynamic Map (LDM),
Standard, Sophia Antipolis Cedex, France.
3. SAE International (2018). SAE J3016 Levels of Driving Automation, Standard.
9Cloud-based traffic data fusion for situation evaluation of handover scenarios
4. Otte (2018). kantSaar (2018-2020), Saarbrücken. https://fgvt.htwsaar.de/site/kantsaar-2018-2020/
5. Otte, Vogt, Staub, Wolniak, Wieker (2018). Neurocognitive and traffic based handover strategies,
26th ITS world congress, Singapore, Singapore.
6. Panagiotopoulou (2004), "Eye in the Sky" project - intelligent transport infrastructure for traffic
monitoring and mobility information, 2004 IEEE 59th Vehicular Technology Conference. VTC
2004-Spring (IEEE Cat. No.04CH37514), Milan, pp. 2926-2930 Vol.5, doi:
10.1109/VETECS.2004.1391460.
7. Tulay, Barickman, Martin, Rao, Koksal (2019), Poster: Urban Traffic Monitoring via Machine
Learning, 2019 IEEE Vehicular Networking Conference (VNC), Los Angeles, CA, USA, 2019, pp.
1-2, doi: 10.1109/VNC48660.2019.9062799.
8. Ren, Wang, Han, Zhang (2019), Information Fusion of Digital Camera and Radar," 2019 IEEE
MTT-S International Microwave Biomedical Conference (IMBioC), Nanjing, China, pp. 1-4, doi:
10.1109/IMBIOC.2019.8777799.
9. Warakagoda, Dirdal, Faxvaag (2019), Fusion of LiDAR and Camera Images in End-to-end Deep
Learning for Steering an Off-road Unmanned Ground Vehicle, 2019 22th International Conference
on Information Fusion (FUSION), Ottawa, ON, Canada, 2019, pp. 1-8.
10. Jabbar, Shinoy, Kharbeche, Al-Khalifa, Krichen, Barkaoui (2019), Urban Traffic Monitoring and
Modeling System: An IoT Solution for Enhancing Road Safety, 2019 International Conference on
Internet of Things, Embedded Systems and Communications (IINTEC), Tunis, Tunisia, 2019, pp.
13-18, doi: 10.1109/IINTEC48298.2019.9112118.
11. European Telecommunications Standards Institute (2019). ETSI EN 302 637-2 Intelligent
Transport Systems (ITS); Vehicular Communications; Basic Set of Applications; Part 2:
Specification of Cooperative Awareness Basic Service, Standard, Sophia Antipolis Cedex, France.
12. European Telecommunications Standards Institute (2019). ETSI TR 103 562 Intelligent Transport
Systems (ITS); Vehicular Communications; Basic Set of Applications; Analysis of the Collective
Perception Service (CPS); Release 2, Standard, Sophia Antipolis Cedex, France.
13. Bhamborae, Flotho, Mai, Schneider, Francis, Strauss (2020), Towards Contactless Estimation of
Electrodermal Activity Correlates, 2020 42nd Annual International Conference of the IEEE
Engineering in Medicine & Biology Society (EMBC), Montreal QC, Canada
14. Bradley, Lang (1994), Measuring emotion: The self-assessment maninik and the semantic
differential, Journal of Behavior Therapy & Experimental Psychiatry, 25, 49-59
15. “OpenStreetMap”, www.openstreetmap.org, accessed: 2021-01-26 [Online]
16. “Attribution|CARTO”, https://carto.com/attribution, accessed: 2021-01-26 [Online]
17. Finkel (1974), Quad Tree: A Data Strucutre for Retrieval on Composite Keys, Acta Informatica,
doi: 10.1007/BF00288933
10You can also read