Congestion Pricing of Urban Street Segments along with MRT Route-The Case Study of Dhaka, Bangladesh
←
→
Page content transcription
If your browser does not render page correctly, please read the page content below
Journal of Transportation Technologies, 2021, 11, 168-178
                                                                                                  https://www.scirp.org/journal/jtts
                                                                                                            ISSN Online: 2160-0481
                                                                                                              ISSN Print: 2160-0473

Congestion Pricing of Urban Street Segments
along with MRT Route—The Case Study of
Dhaka, Bangladesh

Mohammad Mushfiqul Islam1, Niloy Saha2*, Md. Sajedur Rahman1, Nasir Uddin Ahmed1
1
    Military Institute of Science and Technology, Dhaka, Bangladesh
2
    North Dakota State University, Fargo, ND, USA

How to cite this paper: Islam, M.M., Saha,      Abstract
N., Rahman, Md.S. and Ahmed, N.U. (2021)
Congestion Pricing of Urban Street Seg-         Dhaka, Bangladesh’s capital, already has a congestion problem to handle the
ments along with MRT Route—The Case             ever-growing demand for traffic. The usage of private cars cannot be stopped
Study of Dhaka, Bangladesh. Journal of
                                                by charging and the town is not encouraged by quality public transport. It is
Transportation Technologies, 11, 168-178.
https://doi.org/10.4236/jtts.2021.112011        impossible to enforce congestion prices here in line with traditional cordon
                                                pricing systems since the region uses unusual land patterns. However, the
Received: March 10, 2021                        current project Mass Rapid Transit (MRT) Line 6, which will be built by 2021,
Accepted: March 27, 2021
Published: March 30, 2021
                                                provides the prospect of congestion pricing. A price and optimum approach
                                                were established for this article. The congestion price is only payable for the
Copyright © 2021 by author(s) and               segments and is accessible for private cars under this system. Two urban
Scientific Research Publishing Inc.
                                                street segments along the MRT route were selected for the study and conges-
This work is licensed under the Creative
Commons Attribution International               tion toll for a private car is estimated for each segment separately. The sum of
License (CC BY 4.0).                            the toll in monetary terms is determined using certain associated parameters
http://creativecommons.org/licenses/by/4.0/     from the discrepancy from the actual Level of Service (LOS) travel time and
                 Open Access
                                                traffic flow to the desired LOS. The outcome has shown that the price per
                                                passenger car is $0.3 - $0.44. The price is flexible, which means it will vary
                                                based on traffic volume. The findings for politicians to enforce congestion pric-
                                                ing are viewed as recommendations.

                                                Keywords
                                                Congestion Price, Urban Street Segment, Level of Service, MRT

                                              1. Introduction
                                              Congestion Pricing has been implemented in many developed countries adopt-
                                              ing different pricing schemes to impose surcharges for the vehicle users in the

DOI: 10.4236/jtts.2021.112011       Mar. 30, 2021                 168                        Journal of Transportation Technologies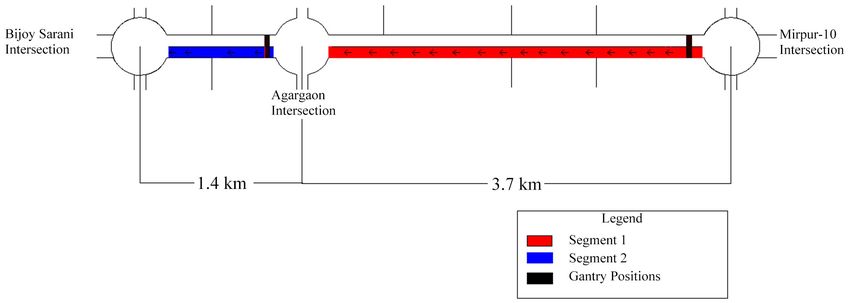
M. M. Islam et al.

                                road network. This results in discouraging passenger vehicles to drive through a
                                particular road segment to reduce congestion. Over the last few decades, Lon-
                                don, Stockholm, Singapore, and several cities implemented this scheme and are
                                still running this process to mitigate congestion [1]. European Union measures
                                have been initiated to research, introduce, and assess a large variety of demon-
                                strations and operating programs for congestion pricing [1]. Singapore is the
                                pioneer in this sector where in 1975, congestion pricing was started with AM
                                peak charging $1.30, resulting in a 73% drop of cars entering the restricted zone.
                                Additionally, bus share increased up to 46% [2]. London started road pricing in
                                2003, charging 8 pounds which resulted in a 15% reduction of traffic during
                                charging time, 30% speed increase, along with a 40% increase in bus usage [3].
                                Stockholm started implementing congestion pricing in 2008 with a rate of $1.33
                                resulting in a 50% reduction in traffic during charging time [4]. Other benefits
                                have been observed such as a reduction in the number of trips, air quality im-
                                provement, and revenue generation [5].
                                   However, Dhaka’s land-use trend does not lend itself to an especially success-
                                ful scheme for congestion pricing. While there is ample north-south connectivi-
                                ty, east-west connectivity is lacking. The only viable form of public transit in
                                certain dense urban areas is by bus. Furthermore, buses are not up to the mark
                                or so-called below standard. In this circumstance, a cordon implementation and
                                toll imposing on private cars to allow mass people to utilize public transit will be
                                challenging. The ongoing construction of Mass Rapid Transit Line 6 (metro rail)
                                will be built by the end of 2021 [6]. From looking at the end of plans for Dhaka
                                Mass Transit Company Limited, we may infer that MRT Line-6 will serve from
                                Uttara to Kamalapur (north-south direction). MRT-6 will be successful public
                                transit if people in the vicinity of the route use this mode instead of the private
                                car. A congestion pricing is necessary to check the benefit of shifting from pri-
                                vate car to MRT-6.
                                   Several methods are followed for road pricing such as cordon-based, time-
                                based, distance-based, and congestion-based [7]. Singapore started using Area
                                Licensing Scheme (ALS) in 1975 based on cordon road pricing methodology to
                                discourage the widespread use of private cars inside the Central business district
                                (CBD) area, especially in the morning peak hours to reduce traffic jams [8]. How-
                                ever, the validity of the toll was raised as a question of whether the amount was
                                correct [9] [10].
                                   Moreover, several studies have been attempted in Dhaka city in recent years.
                                Bakkarsiddique et al. (2013) demonstrated a survey-based result to investigate
                                the potential response to congestion cost and found that there is a significant
                                portion of automobile users in Dhaka who are alert to the cost of congestions
                                and are prepared to switch to alternate modes [11]. Khan et al. (2013) estimated
                                traffic congestion cost for this city, which comes up to $3868 million annually
                                [12]. But further research is needed on cordon pricing that should be charged
                                during price implementation. Service standards Cordon pricing was also devel-
                                oped based on Dhaka city in past research [7], but pricing calculation requires

DOI: 10.4236/jtts.2021.112011                        169                       Journal of Transportation Technologies
M. M. Islam et al.
calibration of several parameters based on study area, which is sometimes chal-
lenging and time-consuming to conclude. It was necessary to use a formula that
provides a similar result to regular cordon pricing calculation considering just a
few parameters.
Li (1999) created a basic model for the best approach to present toll for ALS
congestion [8]. This is focused on just the statistics on the number of car owners
utilizing the average wage rate and takes recent research on the importance of
saving time into account. This formula provides an easy way to test whether
congestion toll charging is fair or not. Following the similar pattern later in this
paper, a methodology is developed for congestion toll estimation in a developed
pricing scheme relating to Level of Service (LOS). The purpose of this study is to
show the cost associated with driving passenger cars along the route of MRT-6
so that people are aware of that cost and shift their mode of transport choice to
public transit. Several benefits of this study include it is the first-ever study on
road pricing that estimates congestion toll relating to LOS and route along
MRT-6, and it uses an easy computational method to assess pricing. Two urban
street segments selected as “Mirpur 10 Intersection to Agargaon Intersection”
and “Agargaon Intersection to Bijoy Sarani” have been identified as the defini-
tion of “Urban Street Segments” in the Highway Capacity Manual [13], which
are 3.7 kilometers and 1.4 kilometers long accordingly. These two segments
would be covered by four metro stations over a median. The reasons for choos-
ing those locations are because of the relatively close office and manufacturing
sector, heavy traffic congestion, and air pollution during the morning peak hours
(7:30-9:30a.m.).
The rest of the paper is organized as follows. Section 2 describes the case re-
view. Section 3 describes the methodology for the pricing scheme and toll esti-
mation. Data collected from the field survey are analyzed and followed by LOS is
determined in Section 4. Congestion tolls are also estimated in this section. Sec-
tion 5 concludes the study by presenting guidelines to the policymakers.
2. Case Review
The Electronic Road Pricing (ERP) framework in Singapore was widely credited
with the reduction of traffic congestion and time. The Cordon Price Schemes,
which was substituted in 1998 by ERP, was formerly introduced according to the
Area Licensing Scheme (ALS). The ALS consisted of a restricted region (RZ) in
the city covering the whole CBD and Chinatown’s industrial districts and most
of the Orchard Road Retail Corridor up to Scotts Road. The initial aim of early
ALS was to avoid large usage in early morning peak hours of private cars to alle-
viate congestion for commuting purposes to the CBD. After more than two
decades, the ALS had proved to be quite successful, but some studies have chal-
lenged the fairness of the congestion charges. Following this, Li (1999) estab-
lished a basic model for checking how close the congestion toll of the ALS was to
the optimum. Only the overall pay scale of car owners was used based on traffic
counts details and facts about the importance of time saves were carried on. The
DOI: 10.4236/jtts.2021.112011 170 Journal of Transportation TechnologiesM. M. Islam et al.
“Equation (1)” developed for congestion toll (CT) estimation was as follows.
(Tw,non-ALS − Tw,ALS ) δ wω (Tm,non-ALS − Tm,ALS ) δ mω
CT= + ] x (1)
X non ALS − X ALS X non-ALS − X ALS
where,
T = time; δ, the value of time as a percentage of average wage rate; ω, average
wage rate; m, the moving state of driving; w, the waiting state of driving; ALS =
the ALS period; non-ALS = the non-ALS period; x = traffic level at any time.
This paper modifies Li’s (1999) equation and uses a technique for the calcula-
tion of the congestion fee for the vehicle using Level of Service (LOS) later. Al-
though the price framework established in this analysis is not a cordon pricing
methodology, the input parameters of the Li research are the same as the input
methodology. By the advancement of this article, the reliability of the toll as-
sessment approach is justified.
3. Methodology
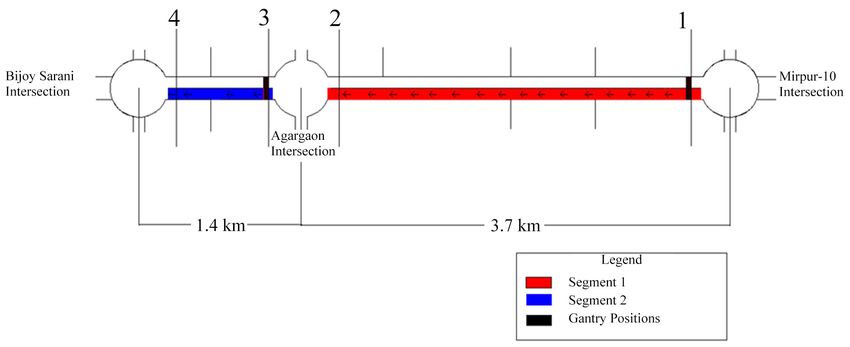
This pricing scheme can be named Segment Pricing. For describing the metho-
dology first urban street segment “Mirpur 10 Intersection to Agargaon Intersec-
tion” is addressed as segment 1 and the second urban street segment “Agargaon
Intersection to Bijoy Sarani Intersection” is addressed as segment 2.
Along with both segments, the morning heading is marked in Figure 1 (from
Mirpur 10 to Bijoy Sarani). Concerning the pricing for cordons, each section in-
cludes an entry point where the gantry may be mounted for charging (Figure 1).
Private cars are paid for the section or segments they use during the morning’s
peak hours (7:30-9:30 AM). The congestion toll for segment 1 must be charged
as the first ports travel into the segment. To utilize the second segment, conges-
tion charges must also be charged for segment 2 from the second gantry. If a
private car makes a right or left turn after segment 1 access is granted, the next
segment would not be paid. Private cars on the other hand can use the conges-
tion fee for segment 2 only from other legs of the intersection of Agargaon
(Figure 1). Both access points shall be closed in the morning throughout the
peak hours, and those from access points who reached these segments shall join
them from segment 1 intersection end of Mirpur 10 (for segment 1) or from
segment 2 of the Agargaon intersection (for availing segment 2).
From the discussion of section 2, it can be said that equation 1 is very useful to
check the congestion toll where it is already imposed. Irrespective of any pricing
scheme Equation (1) can be written as
( ) ( )
Tw,non priced − Tw,priced δ wω Tm,non priced − Tm,priced δ mω
CT= + x (2)
X non priced − X priced X non priced − X priced
where,
priced = the period considering congestion pricing is in operation; non-priced
= the period considering no congestion pricing. The rest of the parameters re-
main the same.
DOI: 10.4236/jtts.2021.112011 171 Journal of Transportation TechnologiesM. M. Islam et al.
Figure 1. Selected urban street segments.
However, congestion rates cannot be determined by way of “Equation (2)”,
instead, it is helpful to modify the current rates due to the adjustment of travel
time and traffic frequency. Now that we have traced back to the LOS definition,
we realize that LOS is a qualitative indicator that demonstrates travel efficiency
in an urban road section. Better LOS implies improved speed and thus a lower
time of drive and therefore a lower time of waiting at the intersection. From field
data, one can conveniently find a complete travel time at the moving state and
time at the intersections in the current condition. Applying “Urban street seg-
ments”, “signalized intersections” of HCM (2016) respectively, average speeds of
traffic and waiting time at the intersection that correlates to an ideal LOS (de-
sired LOS better than existing LOS). Existing LOS’ indicates the current condi-
tions of travel time and traffic intensity from field data. “Desired LOS” is the
most achievable and awaited LOS. Since LOS A, B can’t be achieved, and the toll
price is really high. Alternative routes can therefore be congested. Due to the
competitive method forecast, first calculated toll prices of LOS can be altered in
a short space of time because of price changes in demand. It is easier to infer a
value for the first test by use of the LOS relation than randomly. For the known
segment length, the optimal average travel speed can be determined from the
desired value. An inquiry may still locate actual traffic volumes, but the scientific
evidence for the first trial can conclude that the target amount of traffic. Follow-
ing this concept Equation (2) can be modified as
( ) ( )
Tw,existing − Tw,desired δ wω Tm,existing − Tm,desired δ mω
CT = + x (3)
X existing − X desired X existing − X desired
where,
existing = condition at existing LOS; desired = condition at desired LOS. The
rest of the parameters remain the same.
Using “Equation (3)” congestion toll for each segment can be estimated where
the traffic flow is equal to the desired traffic flow (x = xdesired).
The fact that the congest toll calculated with Equation (2) does not guarantee
that LOS is exactly as desired, though, may be seen to increase LOS certainly
given the facts of other countries. Upon having defined the estimated toll, more
DOI: 10.4236/jtts.2021.112011 172 Journal of Transportation TechnologiesM. M. Islam et al.
optimum congestion toll values can be found from the effect of the pricing.
Congestion pricing itself is a form of research and error, and after daily traffic
demand and supply, review modifications are taken. As regards the secondary
data, the optimum congestion fee can only be given by the adjustment in traffic
movement (noted x in Equation (2)), since the key objective of congestion pric-
ing is to demand control. If private car counts do not reduce the congestion le-
vels at the planned amount, then the next change would immediately raise.
Likewise, the price would drop if the counts of private cars dip below the allowed
amount of congestion.
4. The Case Study
Primary data is gathered during three working days a week in August 2019 from
the field survey for this report. The volume count was calculated at the time of
the peak hour (7:30 to 9:30am) from Sunday for a total of four outlets (Figure
2). For the total traffic volume value referring to segment 1 and segment 2, vo-
lume counts at stations 1 and 2 and 3 and 4 are considered. Noteworthy to say
that access points add even less at peak hours to the traffic level of the two cho-
sen segments.
The total amount of traffic in the entire segment is 698 vehicles per hour for
Segment 1 and 652 vehicles per hour for Segment 2. However, if the metro ser-
vice is open, these values are not the values of traffic volume. Therefore, it is ap-
propriate to adjust the traffic value of segments 1 and 2. Since the only public
transit accessible in those segments today is bus service, the amount of bus traf-
fic from the existing volume of traffic, provided the passengers of these busses
are transferred to metro if the service is operating, is deducted from the current
volume of traffic. The adjusted volume of segment 1 and segment 2 is according
to this definition, respectively 515 veh/hr/ lane and 458 veh/lane.
For travel time data, three private cars (passenger car unit) were used to drive
in both segments starting from Mirpur 10 Intersection up to Bijoy Sarani Inter-
section in three weekdays during peak hours (7:30-9:30AM). The travel time at
the moving state for each segment was recorded separately.
Figure 2. Volume count stations.
DOI: 10.4236/jtts.2021.112011 173 Journal of Transportation TechnologiesM. M. Islam et al.
The waiting time at Agargaon Intersection and Bijoy Sarani Intersection were
also taken all three days which was the red time for the vehicles moving towards
Bijoy Sarani from Mirpur 10. The average travel time at moving state for seg-
ment 1 is found 33 mins. 9 s and for segment 2 the value is 8 mins. 57 s. The av-
erage waiting time at Agargaon Intersection and Bijoy Sarani Intersection are
respectively 2 mins. 29 s and 2 mins. 47 s.
Now, it is possible to check the existing vehicle LOS at both segment 1 and
segment 2 consisting of 3.7 km and 1.4 respectively using the moving state travel
time. By simple arithmetic calculation, the average travel speed at segment 1 is
found 4.17 mi/hr and for segment 2 the value is 5.83 mi/hr. For average travel
speed of 4.17 mi/hr with calculated based free-flow speed 50 mi/hr and volume
to capacity ratio 0.95 consulting Table 1 LOS at segment 1 is found F. Similarly,
for an average travel speed of 5.83 mi/hr with same base free-flow speed and vo-
lume to capacity ratio of 0.80 LOS is also F for segment 2. As the waiting time at
both intersections is greater than 80 s, consulting Table 2 the LOS at both inter-
sections can be declared F.
Table 1. LOS Criteria for motorized vehicle mode (source: Urban street segments, HCM-
2016).
Travel Speed Threshold by Base Free-Flow Speed (mi/h) Volume-to-Capacity
LOS
55 50 45 40 35 30 25 Ratio
A >44 >40 >36 >32 >28 >24 >20
B >37 >34 >30 >27 >23 >20 >17
C >28 >25 >23 >20 >18 >15 >13
≤1.0
D >22 >20 >18 >16 >14 >12 >10
E >17 >15 >14 >12 >11 >9 >8
F ≤17 ≤15 ≤14 ≤12 ≤11 ≤9 ≤8
F Any >1.0
Note: Volume-to-Capacity Ratio of through movement at downstream boundary intersection.
Table 2. LOS criteria for motorized vehicle mode at a signalized intersection (Signalized
Intersections, HCM-2016).
LOS by Volume-to-Capacity Ratio
Control Delay (s/veh)
≤1.0 >1.0
≤10 A F
>10 - 20 B F
>20 - 35 C F
>35 - 55 D F
>55 - 80 E F
>80 F F
DOI: 10.4236/jtts.2021.112011 174 Journal of Transportation TechnologiesM. M. Islam et al.
However, the price of congestion can be expected for a higher LOS as the scale
of traffic reduces and thus increases the speed and the wait. While congestion
costs prevent the usage of private cars, the private vehicles are not on the loser’s
side. In reality, in exchange for congestion, LOS is getting stronger. However, it
will not be reasonable to predict congestion prices that desire a decent LOS, pro-
vided the present traffic conditions. Therefore, the desired LOS is believed to be
C for both segments and crossings.
Now consulting Table 1 minimum average travel speed for achieving LOS C
(25 mi/hr) is considered as desired travel speed and consulting Table 2 maxi-
mum waiting time allowable for LOS C (35 s) is considered as desired to wait
time at both intersections. So, the calculated travel time is 5 mins 31 s for seg-
ment 1 and 2 mins. 2 s for segment 2.
It is difficult to predict how much the traffic volume will reduce due to con-
gestion pricing. However, a certain level of traffic volume can be expected to re-
duce considering the empirical evidence in other countries. As mentioned in
section 2 Singapore’s traffic volume during the non-ALS period and ALS period
were found 600 veh/hr/lane and 450 veh/hr/lane where the traffic volume re-
duced to three-fourth due to congestion pricing. Therefore, the traffic volumes
at segment 1 and segment 2 at desired LOS are assumed 386 veh/hr/lane and 344
veh/hr/lane which are three-fourth of their current traffic volume. All moving
time and waiting time data, traffic volume data are summarized in Table 3.
Substituting travel time and waiting time values in the unit of an hour and the
traffic volume in the unit of veh/hr/lane in Equation (3) two expressions for two
segments are obtained to estimate congestion toll for the private car. (passenger
car unit).
( 0.031667δ w + 0.460556δ m ) ω
CT1 = x
129
( 0.036667δ w + 0.115278δ m ) ω
CT2 = x
114
Table 3. Summary of travel time, waiting time, and traffic volume data.
Data List Segment 1 Segment 2
Travel Time at moving state (min)
Existing LOS 33.15 8.95
Desired LOS 5.52 2.03
Waiting time at Intersections (s)
Existing LOS 149 167
Desired LOS 35 35
Traffic Volume (veh/hr/lane)
Existing LOS 515 458
Desired LOS 386 344
DOI: 10.4236/jtts.2021.112011 175 Journal of Transportation TechnologiesM. M. Islam et al.
Using these expressions congestion toll for any traffic level at the correspond-
ing segment can be estimated.
For the value of ω (average wage rate) the average car owner’s wage rate is
more realistic to estimate congestion toll as it is mainly imposed on the private
car. But due to the unavailability of any national census data for car owner’s
wage 4th-grade wage rate of the 8th national pay scale of Bangladesh is consi-
dered as the average wage rate of car owners that is equal to 50,000 BDT/month
($588.24) or 288 BDT/hr ($3.39/hr) [14].
In a study, Khan & Islam (2013) used a value of 80 BDT/hr ($0.94) as the val-
ue of time for the car during peak hours in Dhaka city. This value the value of
time is 28% of the average car owner’s wage rate used in this study (80/288 =
0.28). Hence, as a base case, the congestion toll can be estimated for the combi-
nation (δw, δm) = (0.28, 0.28). But as the drivers value the waiting time at inter-
sections more than the moving time [8] in his study regarding Singapore’s ALS
used δw = 0.75 quite arbitrarily to capture the fact that δw is generally greater
than δm. In Bangladesh, there is no record of separate data for the value of wait-
ing time and moving time. So, in this study a pair of (δw, δm) = (0.75, 0.28) is
considered as the second case to estimate toll because this concept is an impor-
tant part of the methodology.
Now substituting the values of ω in the unit of BDT/hr and (δw, δm) in those
expressions’ congestion toll for a private car can be estimated for desired traffic
flow which is 386 veh/hr/lane for segment 1 and 344 veh/hr/lane for segment 2.
Therefore, in the base case (δw, δm) = (0.28, 0.28) congestion toll is estimated 119
BDT ($1.4) and 37 BDT ($0.44) for segment 1 and segment 2 respectively. Con-
gestion toll in the second case (δw, δm) = (0.75, 0.28) are 132 BDT ($1.55) for
segment 1 and 52 BDT ($0.61) for segment 2. The overall toll charge is between
$0.3 - $0.44 per private vehicle. Between these two cases, estimated toll values in
the base case are more realistic because there may lie a significant difference in
how waiting time is valued in Singapore and Bangladesh as the economic condi-
tion of people in these two countries differs a lot. The estimated charge will vary
in peak & off-peak hours, weekdays and weekend as the traffic volume fluctuate
every time.
5. Conclusions and Recommendation
This paper develops a congestion price scope in Dhaka City; however, conges-
tion pricing in Bangladesh has not been enforced. The results show affordable
road pricing after the modified methodology is implemented where the original
method is developed in Singapore. Most notably, the approach needs relatively
minimal primary information. It is necessary to change the congestion toll by
adjusting the traffic pattern. This study can seem early since the Metro Rail Ser-
vice is not yet operating; however, there is a lack of data on the price of conges-
tion in the Dhaka Area, such as the prices of time or average car owner’s salary
and other difficulties. This analysis incorporates certain conclusions that more
DOI: 10.4236/jtts.2021.112011 176 Journal of Transportation TechnologiesM. M. Islam et al.
reliable values may be derived from. Using revised data in the future using the
same approach following the commencement of the metro rail services is neces-
sary. Since, congestion prices have some political aspects, even if the government
does not use this congestion price process, it may be enforced temporarily fol-
lowing this study by the government to verify congestion price acceptance level
in Bangladesh.
A few more considerations, such as public acceptance, need to be discussed in
depth before congestion pricing is implemented. An evaluation will help to de-
termine whether the price is satisfactory or not before and during the trial. The
automated toll scheme can also be used to reduce the vehicle queue at the seg-
ment entry stage. When the car moves through the gantry, it will retrieve money
through DSRC or infrared technology from the transponder fitted to a dash-
board, and the amount will be pre-loaded inside it. Before launching the service,
the Gantry location should be set. The category of automobile that is exempted
by the price scheme is necessary to repair. Emergency cars, such as ambulances,
fire, police, municipal buses, minibuses, other vehicles such as freight transport
and bicycles, are excluded from the toll scheme in the implemented cities (FHWA,
2008).
It can be hoped that in the future the government will introduce a Pricing Di-
vision in Dhaka town not only to minimize congestion but also optimize riding
in MRT. In this study, only passenger cars and through movement traffic were
considered for congestion pricing. Also, a few more limitations should be ad-
dressed such as traffic amount after MRT-6 and wage amount. Further study is
necessary to come up with a concrete pricing amount. Future studies should in-
clude road pricing based on different vehicle types, area type, traffic operation
timing, as well as impact of the prices on users, travel behavior, the impact of air
quality, space mean speed, and trip number on pricing implemented area.
Acknowledgements
The authors are grateful to Tanay Datta Chowdhury, Muntahith Mehadil Or-
vin and Md. Anwar Uddin for their assistance.
Conflicts of Interest
The authors declare no conflicts of interest regarding the publication of this pa-
per.
References
[1] FHWA (2008) Lessons Learned from International Experience in Congestion Pric-
ing. USDOT.
[2] Leitmann, J. (1999) Integrating the Environment in Urban Development: Singapore
as a Model of Good Practice. World Bank.
[3] TfL (2005) Central London Congestion Charging Impact Monitoring. Mayor of
London, London.
[4] Hugosson, M.B. and Eliasson, J. (2006) The Stockholm Congestion Charging Sys-
DOI: 10.4236/jtts.2021.112011 177 Journal of Transportation TechnologiesM. M. Islam et al.
tem—An Overview of the Effects After Six Months. Association for European Trans-
port and Contributors, Stockholm.
[5] Peach, J. (2011) The Success of Stockholm’s Congestion Pricing Solution.
http://thisbigcity.net/the-success-of-stockholms-congestion-pricing-solution/
[6] DMTCL (2021).
http://dmtcl.portal.gov.bd/sites/default/files/files/dmtcl.portal.gov.bd/page/1e55ee4
9_2891_4c82_b439_1e81df4d6cf7/2021-02-04-15-00-9e42c6a6a8f264a9911526039f3
61c43.pdf
[7] Hasnat, M.M. and Hoque, M.S. (2014) Reducing Congestion in Dhanmondi Resi-
dential Area: Introducing Cordon Pricing. International Journal of Advanced Engi-
neering Research and Science, 1, 49-57.
[8] Li, M.Z.F. (1999) Estimating Congestion Toll by Using Traffic Count Data—Singa-
pore’s area Licensing Scheme. Transportation Research Part E, 35, 1-10.
https://doi.org/10.1016/S1366-5545(98)00019-2
[9] Toh, R.S. (2004) Road Congestion Pricing in Singapore: 1975-2003. Transportation
Journal, 43, 16-25.
[10] McCarthy, P.S. and Tay, R. (1993) Pricing Road Congestion: Recent Evidence from
Singapore. Policy Studies Journal, 12, 296-308.
https://doi.org/10.1111/j.1541-0072.1993.tb01823.x
[11] Bakkarsiddique, A., Mondal, P.K. and Choudhury, C.F. (2013) Investigating the Po-
tential Presence to Congestion Pricing. 13th World Conference on Transport Re-
search, Rio De Janerio.
[12] Khan, T. and Islam, M.R. (2013) Estimating Cost of Traffic Congestion in Dhaka
City. International Journal of Engineering Science and Innovative Technology, 2,
281-289.
[13] HCM (2016) Highway Capacity Manual. TRB.
[14] Dteletalk, B. (2020) National Pay Scale 2015, Govt Job Salary Grade in Bangladesh.
https://bdteletalk.com/national-pay-scale-govt-job-salary-grade/
DOI: 10.4236/jtts.2021.112011 178 Journal of Transportation TechnologiesYou can also read