Small-world dynamics drove Phanerozoic divergence of burrowing behaviors
←
→
Page content transcription
If your browser does not render page correctly, please read the page content below
https://doi.org/10.1130/G48523.1
Manuscript received 21 July 2020
Revised manuscript received 21 October 2020
Manuscript accepted 11 January 2021
© 2021 Geological Society of America. For permission to copy, contact editing@geosociety.org.
Small-world dynamics drove Phanerozoic divergence of
burrowing behaviors
Andrea Baucon1,2*, Carlos Neto de Carvalho2,3, Fabrizio Felletti4, Gabriele Tosadori5 and Alexandre Antonelli6,7,8
1
ipartimento di Scienze della Terra dell’Ambiente e della Vita (DISTAV), Genova University, Corso Europa 52, 16132 Genoa, Italy
D
2
Geology Office of C.M. Idanha-a-Nova, Naturtejo UNESCO Global Geopark, Avenida Zona Nova de Expansão, 6060-101 Idanha-
a-Nova, Portugal
3
Instituto Dom Luiz, Department of Geology, Lisbon University, Campo Grande, 1749-016 Lisbon, Portugal
4
Department of Earth Sciences, Milan University, Via Mangiagalli 34, 20133 Milan, Italy
5
Department of Medicine, Verona University, Policlinico GB Rossi, Piazzale L.A. Scuro 10, 37134 Verona, Italy
6
Royal Botanic Gardens, Kew, Richmond TW9 3AE, UK
7
Gothenburg Global Biodiversity Centre, Department of Biological and Environmental Sciences, University of Gothenburg,
Carl Skottsbergs gata 22 B, 413 19 Göteborg, Sweden
8
Department of Plant Sciences, University of Oxford, South Parks Road, Oxford OX1 3RB, UK
ABSTRACT (Seilacher, 1953), hydrocarbon exploration (La
Species of burrowing animals have changed substantially over evolutionary time scales, Croix et al., 2013, 2012; Bednarz and McIlroy,
but, surprisingly, burrows display persisting morphological patterns throughout the Pha- 2015), scientific drilling, and characterization
nerozoic. Deep-sea burrows are geometrically patterned, whereas shallow-marine burrows of aquifers (Droser and O’Connell, 1992; Cun-
display simpler morphologies. This divergence between burrow associations is one of the ningham et al., 2009). Ethology is central to
central conundrums of paleontology, but it has never been quantitatively demonstrated, and this framework because trace fossils are mani-
the organizing principles responsible for this structure remain unknown. We show that the di- festations of behavior, which is controlled by
vergence of burrow associations has been shaped by small-world dynamics, which is proposed the environment; environmental parameters,
as a major macroevolutionary force in marine environments. Using network analysis, our in turn, are strongly affected by water depth
study reveals that the association patterns between burrow morphotypes in 45 paleontological (Seilacher, 1953; Ekdale, 1988; MacEachern
sites span ∼500 m.y. Strong statistical support is demonstrated for a surprising association et al., 2012).
pattern, according to which the data set is optimally partitioned into two subgroups of tightly Despite its popularity and intuitive recog-
associated burrow types. These groups correspond to shallow- and deep-marine biomes. Our nition, the divergence hypothesis has never
analysis demonstrates that across the Phanerozoic Eon, burrows did not assemble randomly been quantitatively tested, and the organizing
nor regularly, following instead small-world assembly rules remarkably similar to those that principles that underpin it remain unknown.
shape human social networks. As such, small-world dynamics deeply influenced gene flow This issue is addressed here by analysis of as-
and natural variation in heritable behavior across evolutionary time. sociation patterns of Phanerozoic trace fossils.
Our study tests the specific predictions of the
INTRODUCTION hypothesis states that deep-sea associations of divergence hypothesis that (1) association pat-
Species of burrowing organisms have trace fossils have retained their distinctiveness terns of trace fossils are inhomogeneous, i.e.,
changed dramatically throughout the Phanero- from shallow-marine trace fossils throughout trace fossils are associated neither randomly nor
zoic, which comprises the past 541 m.y. of bio- most of the Phanerozoic (Seilacher, 1953, 1967, regularly; and (2) any trace-fossil association is
logical evolution on Earth. Nevertheless, bur- 1978, 2007). In other words, the hypothesis as- related to a specific biome, i.e., shallow or deep
rows and other traces of organism-substrate serts that deep-sea trace fossils are morphologi- marine. Accordingly, the first null hypothesis
interactions (e.g., trails, trackways) have main- cally different from shallow-marine trace fossils is that trace fossils are randomly associated;
tained similar morphologies throughout the (Fig. 1). the second is that they are regularly associated;
same time span, with each morphology being The quantum leap in the understanding the third is that there is no correlation between
associated with a specific environmental setting of life-substrate interactions imparted by this groups of associated traces and their environ-
(Frey and Seilacher, 1980). In fact, one of the observation (MacEachern et al., 2012) led to mental setting.
fundamental hypotheses of paleontology con- the recognition of associations of trace fos-
cerns the Phanerozoic divergence between shal- sils across time and space (i.e., ichnofacies; METHODS
low- and deep-sea trace fossil associations. This Seilacher, 1953, 1967). As a consequence of The ideal source data for quantitatively testing
this recognition, trace fossils became a central the divergence hypothesis are the data from which
*E-mail: andrea@tracemaker.com tool in the reconstruction of ancient ecosystems the divergence idea first stemmed (Seilacher,
CITATION: Baucon, A., et al., 2021, Small-world dynamics drove Phanerozoic divergence of burrowing behaviors: Geology, v. 49, p. XXX–XXX, https://doi.
org/10.1130/G48523.1
Geological Society of America | GEOLOGY | Volume XX | Number XX | www.gsapubs.org 1
Downloaded from http://pubs.geoscienceworld.org/gsa/geology/article-pdf/doi/10.1130/G48523.1/5259222/g48523.pdf
by GSA Content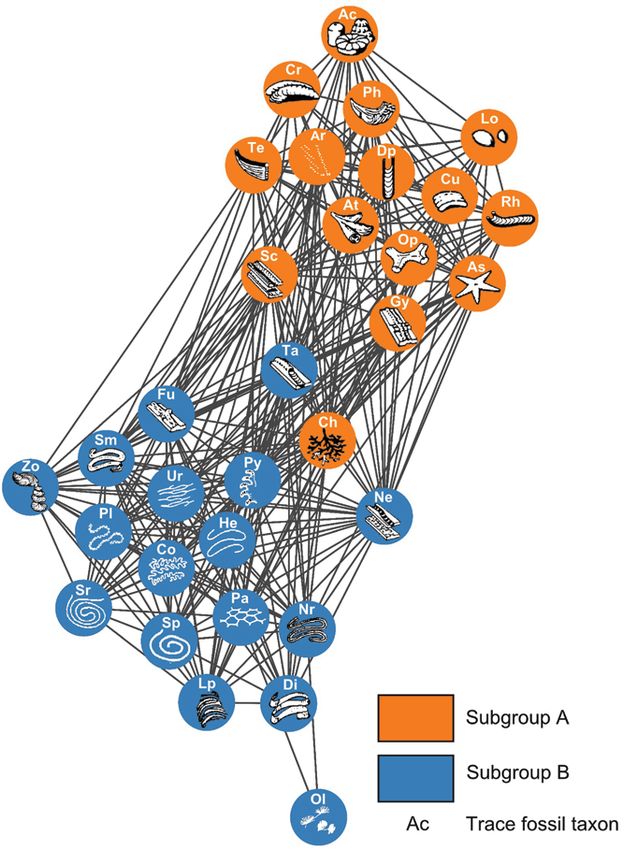
A
D
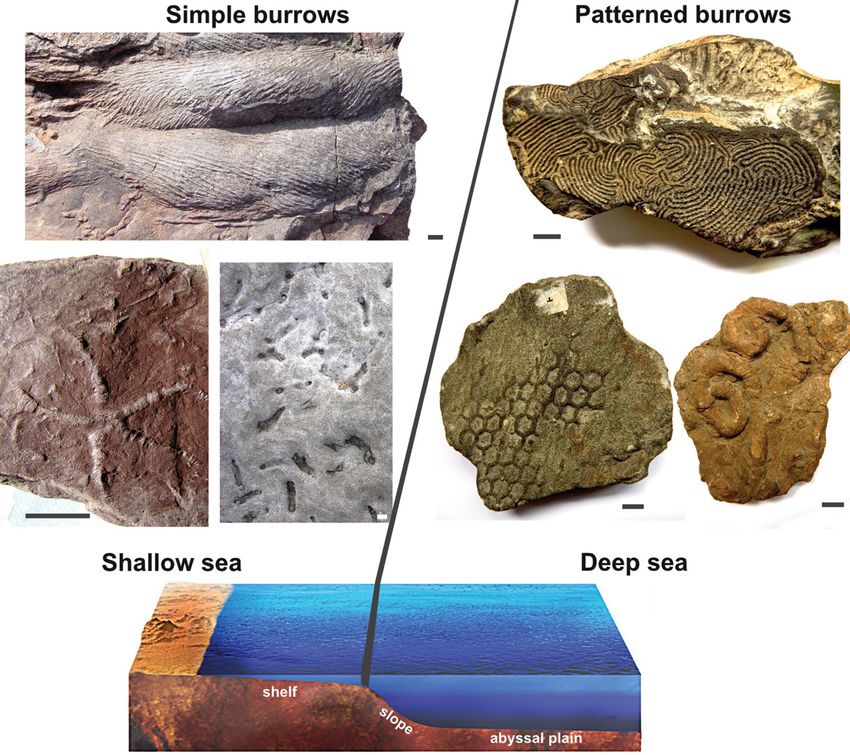
Figure 1. Phanerozoic
divergence hypothesis.
B C It predicts that simple
E F burrows (A–C) are found
in shallow-sea deposits,
and geometrically pat-
terned burrows (D–F) in
deep-sea settings. Scale
bars are 1 cm wide. (A)
Cruziana (Ordovician). (B)
Asteriacites (Triassic). (C)
Diplocraterion (Jurassic).
(D) Nereites (Cretaceous).
(E) Paleodictyon (Creta-
ceous). (F) Spirophycus
(Cretaceous). See Table
S1 (see footnote 1) for
specimen details.
2007; Table S2 in the Supplemental Material1). that are equivalent; i.e., with the same number ichnofossil network topology. The seafloor was
This data set includes presence-absence data of nodes and average degree. We empirically simulated by a unidimensional domain across
of environmental proxies and 32 taxa of trace generated 1000 random networks using the which ichnotaxa are distributed. The spatial
fossils (ichnotaxa) in 45 sites, ranging from Erdős and Rényi (1959) model (Fig. S1A in range of each taxon can change at discrete points
Cambrian to Miocene in age. Each assemblage the Supplemental Material). To test the third in time according to a defined set of rules: (1) a
of the data set represents the work of animals that hypothesis, subgroups are searched by using only “specialist rule”, i.e., keeping a narrow spatial
lived in the same biome, but it is not necessarily the information encoded in the topology of the range across time; or (2) a “generalist rule”, i.e.,
an ichnocoenose. Using the framework of ichnofossil network; then the correlation between keeping a wide range for the entire duration of
network analysis (Baucon and Felletti, 2013; the detected subgroups and environmental the simulation. At the end of the simulation, a
Baucon et al., 2014, 2015), the source data table proxies is tested. To detect subgroups, we applied network was produced based on co-occurrence
is translated into a network by representing the concept of modularity, which measures the relationships between taxa, and the network was
ichnotaxa as nodes and by connecting those taxa number of links falling within subgroups minus compared to the ichnofossil network. Detailed
that co-occur in at least one paleontological site. the expected number in a random null model methods and definitions are provided in the
The resulting network (Fig. 2), herein named (Newman, 2006; Fortunato, 2010). By optimizing Supplemental Material.
the ichnofossil network, is made of 32 nodes modularity over possible subgroups of the studied
(ichnotaxa), each of which is linked to 19.8 taxa network, we determined whether there exist any RESULTS AND DISCUSSION
on average (average degree). To test the first natural partitions of its nodes (Newman, 2006; Ichnofossil Network versus Random and
and second null hypotheses, we compared the Blondel et al., 2008). We then evaluated whether Regular Null Models
topological properties of the ichnofossil network ichnotaxa of each subgroup have a higher In the ichnofossil network, any two nodes
with those of random and regular null models probability of being associated with shallow- are connected by a minimum number of links
marine proxies versus deep-marine proxies. The (distance). For instance, the distance between
probability of association was quantified using Cosmorhaphe and Spirophycus is 1 because
1
Supplemental Material. Supplemental text, the Jaccard similarity and a χ2 test (Hammer and the corresponding ichnotaxa are found in the
7 supplemental figures, 3 supplemental tables, Harper, 2006). same paleontological site(s) (Fig. 2). This im-
and 4 files of Python code. Please visit https://
doi.org/10.1130/GEOL.S.14120408 to access We propose a spatial model of ichnotaxa plies that these ichnotaxa occupied the same
the supplemental material, and contact editing@ distribution to understand what biogeograph- ancient biome because trace fossils cannot
geosociety.org with any questions. ic distribution patterns are responsible for the be transported; i.e., they represent the in situ
2 www.gsapubs.org | Volume XX | Number XX | GEOLOGY | Geological Society of America
Downloaded from http://pubs.geoscienceworld.org/gsa/geology/article-pdf/doi/10.1130/G48523.1/5259222/g48523.pdf
by GSA Content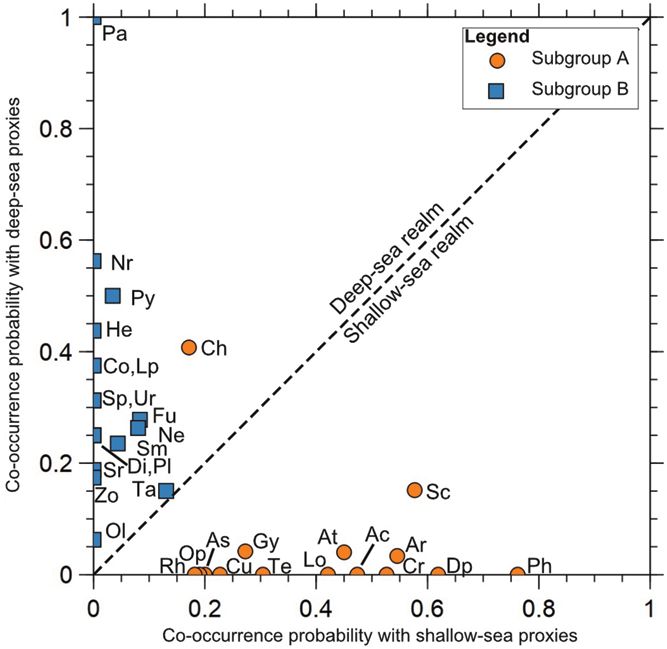
the small-world measure ω (Telesford et al.,
2011), which also considers clustering of an
equivalent lattice. A network is deemed a “small
world” if S > 1 (Humphries and Gurney, 2008),
whereas values of ω close to zero denote small-
world tendencies (Telesford et al., 2011). Values
of these indices (Sichno = 1.10; ωichno = −0.11)
show that the ichnofossil network falls within
the small-world realm.
Small-world networks are commonly charac-
Figure 2. Ichnofossil terized by community structure; i.e., they can be
network. Nodes repre- partitioned into subgroups of densely connected
sent ichnotaxa, and links nodes (Newman, 2006; Fortunato, 2010). Com-
connect ichnotaxa that
co-occur in same pale- munity structure here does not refer to biological
ontological site(s). Node communities. Community structure allows the
colors indicate modu- third null hypothesis to be tested: i.e., there is no
larity-based subgroups. correlation between ichnoassociations, if pres-
Refer to Table 1 for taxon
ent, and their environmental setting. Optimiza-
abbreviations. Trace fossil
icons are modified from tion of modularity reveals two natural subgroups
Seilacher (2007). in the ichnofossil network (Table 1; Fig. 2).
Paleoenvironmental Significance of
Subgroups
We visualize the probability of association
between subgroups and environmental proxies
as configurations of nodes (Fig. 3). Accordingly,
each node is an ichnotaxon, while its coordinates
represent the probability of association with
shallow-marine (x-coordinate) and deep-marine
(y-coordinate) proxies. The diagonal segment
connecting the upper right to the lower left cor-
r ecord of biogenic activity (Buatois and Mán- number of links, i.e., they have equal degrees ner of the plot contains the points of equal prob-
gano, 2011). In the ichnofossil network, average (Caporossi et al., 2003). Consequently, in a regu- ability; hence, it separates the deep-sea from the
distance is Lichno = 1.38, which is comparable lar network, the difference between the maxi- shallow-sea realm. Results (Fig. 3) show that
to the average distance of a random network mum and the minimum node degree (degree (1) the shallow-sea realm contains subgroup A
(Ler [er—equivalent Erdős-Rényi random net- variability) is Vreg = 0. This is not the case of ichnotaxa only; (2) all taxa of subgroup B fall
work] = 1.36). The ichnofossil network re- the ichnofossil network, the degree variability into the deep-sea realm; (3) Chondrites is the
sembles a random network by its short average of which is Vichno = 28 (Figs. S1B and S2A; see only taxon of subgroup A that is placed in the
distance, but, in parallel to the inadequacy of Fig. S2B for additional topological differences deep-sea realm. The results disprove the null
describing social networks as random networks from the regular null model). hypothesis by showing that each group of asso-
(Newman, 2000), there is a notable challenge ciated traces pertain to a single biome, shallow
using the random network as a model of the Node Subgroups or deep marine. This supports the Phanerozoic
ichnofossil network. In a true social network, Our results falsify the first and second null divergence hypothesis. This result is surprising
one’s friend’s friends are likely to be one’s hypotheses by showing that random and regu- because this divergence persisted in spite of
friends, but this does not occur in random net- lar networks do not capture the topology of the changing trace makers, e.g., the end-Permian
works (Newman, 2000). This property is termed ichnofossil network. The ichnofossil network extinction wiped out 96% of marine animal spe-
“clustering” and is quantified by the clustering displays characteristics from both (high cluster- cies (Benton and Twitchett, 2003; Twitchett and
coefficient C (Proulx et al., 2005). The aver- ing like regular lattices, and small average dis- Barras, 2004).
age clustering coefficient of the ichnofossil net- tance like random networks). This is typical of Chondrites cannot be considered a true out-
work (Cichno = 0.85) is higher than the cluster- small-world networks; i.e., networks presenting lier because it is a typical environment-crossing
ing coefficient of equivalent random networks a connection topology that is neither completely ichnogenus (Baucon et al., 2020). The network
(0.62), equaling the ratio between the average regular nor completely random (Watts and Stro- subgroups A and B show high correspondence
number of links and the total number of nodes gatz, 1998; Humphries and Gurney, 2008). The with the shallow-sea Cruziana ichnofacies and
(Newman, 2000). A similar result is obtained network G is said to be a small-world network the deep-sea Nereites ichnofacies, respectively,
by averaging the clustering coefficient of the if it has a similar average distance length to, but which had been only qualitatively outlined in the
1000 empirically generated Erdős-Rényi ran- greater clustering of nodes than, an equivalent original studies (Seilacher, 1967, 1978, 2007).
dom networks (Cer = 0.64; Fig. S1). The higher Erdős-Rényi random graph (Lg ≥ Ler; Cg >> These results are confirmed by the χ2 test (Fig.
degree of clustering in the ichnofossil network Cer) (Humphries and Gurney, 2008). To test S3) and hold at least from the Ordovician, given
compared to a random network shows that the the small-world nature of the ichnofossil net- that the source data set does not include any of
ichnofossil network is not random. work, we calculated the small-worldness index the characteristic Cambrian shallow-sea grapho-
A regular network is the opposite of a ran- S, which compares clustering and distance of a glyptids (Crimes and Fedonkin, 1994; Uch-
dom network (Newman, 2000); a completely given network to those of an equivalent random man, 2003). Today, the ichnofacies approach
ordered graph in which all nodes have the same network (Humphries and Gurney, 2008), as does is regarded as a key tool in paleoenvironmental
Geological Society of America | GEOLOGY | Volume XX | Number XX | www.gsapubs.org 3
Downloaded from http://pubs.geoscienceworld.org/gsa/geology/article-pdf/doi/10.1130/G48523.1/5259222/g48523.pdf
by GSA ContentTABLE 1. NODE SUBGROUPS FOUND BY MODULARITY OPTIMIZATION ALGORITHM and Schreiber, 2008). These results demon-
Subgroup Taxon Abbreviation First appearance datum strate how the divergent, small-world structure
A Actinian burrows Ac Early Cambrian of Phanerozoic trace-fossil associations derives
Arthropod tracks Ar ?Neoproterozoic, Early Cambrian
Asteriacites As Cambrian from simple spatial patterns, i.e., most ichno-
Chondrites Ch Neoproterozoic taxa maintaining a narrow range (specialists)
Scolicids Sc Early Ordovician
Gyrochorte Gy Ordovician and few ichnotaxa with a wide and/or unstable
Cruziana Cr Early Cambrian range (generalists).
Phycodes Ph Early Cambrian
Diplocraterion Dp Early Cambrian
Asterosoma At Early Cambrian
Rhizocorallium Rh Early Cambrian CONCLUSIONS
Teichichnus Te Early Cambrian By integrating network analysis and global
Ophiomorpha Op Permian
Lockeia Lo Early Ordovician paleontological data, we quantitatively dem-
Curvolithus Cu Neoproterozoic onstrate that deep-sea trace fossils have been
B Nereites Nr Early Cambrian morphologically cohesive and distinguish-
Dictyodora Di Cambrian
Helminthoida He Cambrian able from shallow-marine ones for most of the
Cosmorhaphe Co Cambrian Phanerozoic.
Urohelminthoida Ur Ordovician
Paleomeandron Pl Late Cretaceous The divergence reported here has applied
Scolicia (meanders) Sm Early Ordovician implications for scientific research and for the
Spirophycus Sp Ordovician
Lophoctenium Lp Early Ordovician energy industry, which relies on paleoenviron-
Oldhamia Ol Early Cambrian mental analysis for identifying resource-bear-
Paleodictyon Pa Early Cambrian
Zoophycos Zo Cambrian ing deposits. This work settles a fundamental
Phycosiphon Py Ordovician paleontological hypothesis (Phanerozoic di-
Taenidium Ta Cambrian
Fucusopsis Fu Ordovician vergence) and method (ichnofacies approach),
Neonereites Ne Neoproterozoic
Spirorhaphe Sr Silurian proposed nearly 50 years ago (Seilacher, 1967,
Note: Stratigraphic ranges are based on the literature (see references in the Supplemental Material [see text 1978, 2007).
footnote 1]). Our model shows that two universal eco-
logical guilds—specialists and generalists—
controlled the spatial distribution of burrow-
ing behaviors across the Phanerozoic. It finds a
parallel in the development of social networks,
with most individuals associating with (making
friends with) individuals who are geographically
close (environment-specific taxa) and few mov-
ing around (environment-crossing taxa) (New-
Figure 3. Node layout man, 2000).
showing co-occurrence
Burrow shape reflects the behavior of its
probability between ich-
notaxa and environmental producer. By demonstrating the persisting di-
proxies, as quantified by vergence of burrow shape over evolutionary
the Jaccard index. Nodes time scales, this work suggests that small-
correspond to taxa (see world dynamics deeply influenced extended
Table 1 for labels); links
are not depicted for phenotypes and ecosystem engineering, thus
graphical clarity (refer to controlling gene flow and natural variation
Fig. 2 for links). in heritable behavior across the Phanerozoic.
This indicates that small-world dynamics has
been a major, but hitherto neglected, macro-
evolutionary force in marine environments for
the Phanerozoic.
ACKNOWLEDGMENTS
We thank Lavinia Tunini, Øyvind Hammer, and Wolf-
gang Eder for methodological discussions. Baucon is
a nalysis, although some researchers have argued logical measures of the ichnofossil network (av- supported by the ALAN-X, CURIOSITY, and CAM-
BIACLIMA projects of the University of Genova
that it may lead to overgeneralized, low-resolu- erage path length, clustering coefficient, density, (Italy). Neto de Carvalho is supported by Naturtejo,
tion interpretations (Goldring, 1993; MacEach- and degree; number of communities) are within Empresa Inter-Municipal (EIM). Antonelli is sup-
ern et al., 2007). one standard deviation from the mean of 1000 ported by the Swedish Research Council, the Swedish
model-generated networks (Fig. S7). The model Foundation for Strategic Research, and the Royal
Botanic Gardens, Kew (Richmond, UK). Naturtejo
Biogeographic Distribution Patterns of displays the tendency to generate networks (1)
UNESCO Global Geopark and Câmara Municipal de
Burrowing Behaviors with the average distance increasing slower than Idanha-a-Nova provided the financial support to this
The simple generalist and specialist rules of the logarithm of the network size (Fig. S5A); (2) paper. Baucon and Neto de Carvalho dedicate this
our proposed model result in complex patterns with the average degree increasing linearly with work to the memory of one of the greatest minds in
of trace fossil association that are comparable the number of nodes (Fig. S5B); and (3) with paleontology, Adolf Seilacher, with whom they had the
privilege of sharing ideas that culminated in the pres-
to those observed in the real-world ichnofossil high clustering (>0.8) and small distance (REFERENCES CITED Stratiform “super-K” zones: Geological Society MacEachern, J.A., Bann, K.L., Gingras, M.K.,
Baucon, A., and Felletti, F., 2013, The IchnoGIS of America Bulletin, v. 121, p. 164–180, https:// Zonneveld, J.-P., Dashtgard, S.E., and Pember-
method: Network science and geostatistics in doi.org/10.1130/B26392.1. ton, S.G., 2012, The ichnofacies paradigm, in
ichnology—Theory and application (Grado la- Droser, M.L., and O’Connell, S., 1992, Trace fos- Knaust, D., and Bromley, R.G., eds., Trace Fos-
goon, Italy): Palaeogeography, Palaeoclimatol- sils and ichnofabric in Triassic sediments from sils as Indicators of Sedimentary Environments:
ogy, Palaeoecology, v. 375, p. 83–111, https:// cores recovered on Leg 122, in von Rad, U., Haq, Amsterdam, Elsevier, Developments in Sedimen-
doi.org/10.1016/j.palaeo.2013.02.016. B.U., et al., Proceedings of the Ocean Drilling tology, v. 64, p. 103–138, https://doi.org/10.1016/
Baucon, A., Ronchi, A., Felletti, F., and Neto de Program, Scientific Results, Volume 122: Col- B978-0-444-53813-0.00004-6.
Carvalho, C., 2014, Evolution of Crustaceans lege Station, Texas, Ocean Drilling Program, Newman, M.E.J., 2000, Models of the small world:
at the edge of the end-Permian crisis: Ich- p. 475–485, https://doi.org/10.2973/odp.proc. Journal of Statistical Physics, v. 101, p. 819–841,
nonetwork analysis of the fluvial succession of sr.122.170.1992. https://doi.org/10.1023/A:1026485807148.
Nurra (Permian–Triassic, Sardinia, Italy): Pal- Ekdale, A.A., 1988, Pitfalls of paleobathymetric Newman, M.E.J., 2006, Modularity and community
aeogeography, Palaeoclimatology, Palaeoecol- interpretations based on trace fossil assem- structure in networks: Proceedings of the Na-
ogy, v. 410, p. 74–103, https://doi.org/10.1016/ blages: Palaios, v. 3, p. 464–472, https://doi tional Academy of Sciences of the United States
j.palaeo.2014.05.034. .org/10.2307/3514720. of America, v. 103, p. 8577–8582, https://doi
Baucon, A., Venturini, C., Neto de Carvalho, C., Fel- Erdős, P., and Rényi, A., 1959, On random graphs, .org/10.1073/pnas.0601602103.
letti, F., and Muttoni, G., 2015, Behaviors mapped I: Publicationes Mathematicae Debrecen, v. 6, Proulx, S.R., Promislow, D.E.L., and Phillips, P.C.,
by new geographies: Ichnonetwork analysis of p. 290–297. 2005, Network thinking in ecology and evolu-
the Val Dolce Formation (lower Permian; Italy- Fortunato, S., 2010, Community detection in graphs: tion: Trends in Ecology & Evolution, v. 20, p. 345–
Austria): Geosphere, v. 11, p. 744–776, https:// Physics Reports, v. 486, p. 75–174, https://doi 353, https://doi.org/10.1016/j.tree.2005.04.004.
doi.org/10.1130/GES00994.1. .org/10.1016/j.physrep.2009.11.002. Seilacher, A., 1953, Studien zur Palichnologie: I. Uber
Baucon, A., et al., 2020, Ethology of the trace fossil Frey, R.W., and Seilacher, A., 1980, Uniformity in ma- die Methoden der Palichnologie: Neues Jahrbuch
Chondrites: Form, function and environment: rine invertebrate ichnology: Lethaia, v. 13, p. 183– für Geologie und Paläontologie: Abhandlungen,
Earth-Science Reviews, v. 202, 102989, https:// 207, https://doi.org/10.1111/j.1502-3931.1980. v. 96, p. 421–452.
doi.org/10.1016/j.earscirev.2019.102989. tb00632.x. Seilacher, A., 1967, Bathymetry of trace fossils:
Bednarz, M., and McIlroy, D., 2015, Organism-sed- Goldring, R., 1993, Ichnofacies and facies inter- Marine Geology, v. 5, p. 413–428, https://doi
iment interactions in shale-hydrocarbon reser- pretation: Palaios, v. 8, p. 403–405, https://doi .org/10.1016/0025-3227(67)90051-5.
voir facies—Three-dimensional reconstruction .org/10.2307/3515272. Seilacher, A., 1978, Use of trace fossil assemblages for
of complex ichnofabric geometries and pore-net- Hammer, Ø., and Harper, D.A.T., 2006, Paleon- recognizing depositional environments, in Basan,
works: International Journal of Coal Geology, tological Data Analysis: Malden, Massachu- P.B., ed., Trace Fossil Concepts: Society of Eco-
v. 150–151, p. 238–251, https://doi.org/10.1016/ setts, Blackwell Publishing, 351 p., https://doi nomic Paleontologists and Mineralogists Short
j.coal.2015.09.002. .org/10.1002/9780470750711. Course 5, p. 167–181, https://doi.org/10.2110/
Benton, M.J., and Twitchett, R.J., 2003, How to kill Humphries, M.D., and Gurney, K., 2008, Network scn.77.01.0185.
(almost) all life: The end-Permian extinction “small-world-ness”: A quantitative method Seilacher, A., 2007, Trace Fossil Analysis: Ber-
event: Trends in Ecology & Evolution, v. 18, for determining canonical network equiva- lin, Heidelberg, Springer, 238 p., https://doi
p. 358–365, https://doi.org/10.1016/S0169- lence: PLoS One, v. 3, e0002051, https://doi .org/10.1007/978-3-540-47226-1.
5347(03)00093-4. .org/10.1371/journal.pone.0002051. Telesford, Q.K., Joyce, K.E., Hayasaka, S., Bur-
Blondel, V.D., Guillaume, J.-L., Lambiotte, R., and Junker, B.H., and Schreiber, F., eds., 2008, dette, J.H., and Laurienti, P.J., 2011, The ubiq-
Lefebvre, E., 2008, Fast unfolding of com- Analysis of Biological Networks: Hobo- uity of small-world networks: Brain Connectiv-
munities in large networks: Journal of Sta- ken, John Wiley & Sons, 346 p., https://doi. ity, v. 1, p. 367–375, https://doi.org/10.1089/
tistical Mechanics: Theory and Experiment, org/10.1002/9780470253489. brain.2011.0038.
v. 2008, P10008, https://doi.org/10.1088/1742- La Croix, A.D., Gingras, M.K., Dashtgard, S.E., and Twitchett, R.J., and Barras, C.G., 2004, Trace fos-
5468/2008/10/P10008. Pemberton, S.G., 2012, Computer modeling bio- sils in the aftermath of mass extinction events, in
Buatois, L.A., and Mángano, M.G., 2011, Ichnology: turbation: The creation of porous and permeable McIlroy, D., ed., The Application of Ichnology to
Organism-Substrate Interactions in Space and fluid-flow pathways: American Association of Pe- Palaeoenvironmental and Stratigraphic Analysis:
Time: Cambridge, UK, New York, Cambridge troleum Geologists Bulletin, v. 96, p. 545–556, Geological Society of London Special Publica-
University Press, 358 p., https://doi.org/10.1017/ https://doi.org/10.1306/07141111038. tion 228, p. 397–418, https://doi.org/10.1144/
CBO9780511975622. La Croix, A.D., Gingras, M.K., Pemberton, S.G., GSL.SP.2004.228.01.18.
Caporossi, G., Gutman, I., Hansen, P., and Pavlović, Mendoza, C.A., MacEachern, J.A., and Lemis- Uchman, A., 2003, Trends in diversity, frequency
L., 2003, Graphs with maximum connectivity ki, R.T., 2013, Biogenically enhanced reservoir and complexity of graphoglyptid trace fossils:
index: Computational Biology and Chemistry, properties in the Medicine Hat gas field, Alberta, Evolutionary and palaeoenvironmental aspects:
v. 27, p. 85–90, https://doi.org/10.1016/S0097- Canada: Marine and Petroleum Geology, v. 43, Palaeogeography, Palaeoclimatology, Palaeoecol-
8485(02)00016-5. p. 464–477, https://doi.org/10.1016/j.marpet- ogy, v. 192, p. 123–142, https://doi.org/10.1016/
Crimes, T.P., and Fedonkin, M.A., 1994, Evolution geo.2012.12.002. S0031-0182(02)00682-X.
and dispersal of deepsea traces: Palaios, v. 9, MacEachern, J.A., Pemberton, S.G., Gingras, M.K., Watts, D.J., and Strogatz, S.H., 1998, Collective dy-
p. 74–83, https://doi.org/10.2307/3515080. and Bann, K.L., 2007, The ichnofacies para- namics of ‘small-world’ networks: Nature, v. 393,
Cunningham, K.J., Sukop, M.C., Huang, H., Alvarez, digm: A fifty-year retrospective, in Miller, W., p. 440–442, https://doi.org/10.1038/30918.
P.F., Curran, H.A., Renken, R.A., and Dixon, J.F., III, ed., Trace Fossils: Concepts, Problems, Pros-
2009, Prominence of ichnologically influenced pects: Amsterdam, Elsevier, p. 52–77, https://doi
macroporosity in the karst Biscayne aquifer: .org/10.1016/B978-044452949-7/50130-3. Printed in USA
Geological Society of America | GEOLOGY | Volume XX | Number XX | www.gsapubs.org 5
Downloaded from http://pubs.geoscienceworld.org/gsa/geology/article-pdf/doi/10.1130/G48523.1/5259222/g48523.pdf
by GSA ContentYou can also read