Impact of hydrogen admixture on interacting premixed flames in domestic boilers
←
→
Page content transcription
If your browser does not render page correctly, please read the page content below
E3S Web of Conferences 238, 04001 (2021) https://doi.org/10.1051/e3sconf/202123804001
100RES 2020

 Impact of hydrogen admixture on interacting premixed flames
 in domestic boilers
 Rachele Lamioni1*, Sebastiano Cinnirella1, Cristiana Bronzoni2, Marco Folli2, Leonardo Tognotti1, Chiara Galletti1
 1Dipartimento di Ingegneria Civile e Industriale, Università di Pisa, 56126 Pisa, Italy
 2Ricerca & Sviluppo - Laboratorio Sviluppo Prodotti, Immergas S.p.A., Brescello (RE) - Italy

 Abstract. The injection of hydrogen into the natural gas network can contribute to the large-scale
 integration of renewables, as hydrogen can be easily produced through electrolysis from wind or solar
 energy. However, the addition of hydrogen to natural gas influences fuel properties, asking for the
 assessment of the safe and efficient operation of existing end-user equipment, such as domestic burners
 and boilers. In this work, 3-dimensional resolved numerical simulations based on Computational Fluid
 Dynamics are carried out to shed light on the effect of H2 addition on the combustion process occurring in
 condensing boilers equipped with perforated cylindrical burners. To this purpose, multi-hole geometries
 emulating a portion of a perforated burner are analyzed. Since the burner holes are positioned very close
 to each other, the interaction of the adjacent laminar premixed flames is observed to occur with influence
 on the flow and thermo-chemical fields which differ from those of a single premixed flame. The addition
 of hydrogen was found to lead to an anticipation of the reaction zone, although the general features
 observed with the G222 gas (23% H2, 77% CH4 ) were alike those of the G20 gas (100% CH4).

 1.Introduction observing that the optimal equivalence ratio is 0.70 <
 < 0.75. These results were confirmed by Najarnikoo et
 A key role for decarbonization is played by the
 al. [4] who observed a stable blue flame to be ensured by
 integration of power-to-gas with the natural gas grid in
 equivalence ratios 0.70 < < 0.73. Schiro et al. [5]
 order to face the problem of storing and transporting
 overproduction of energy from renewables at times of investigated experimentally the performance of
 excess. In particular, hydrogen can be produced in a very cylindrical premixed burners coupled to a very common
 sustainable manner through electrolysis employing wind domestic premixed boiler setup, with special attention to
 or solar energy as a power source and water [1]. metal fiber application on the burner surface. Very
 However, adding hydrogen to natural gas influences gas recently Soltanian et al. [6] applied chemiluminescence
 properties, leading to significant challenges for the safe to a multi-hole cylindrical burner with the aim to
 and efficient operation of existing end-user equipment, investigate OH* and CO2* emissions, which are directly
 such as domestic burners and boilers. Even though related to the heat release rate. They suggested that the
 maximum hydrogen fractions, up to 20% are foreseen heat transfer rate was maximized with an equivalence
 for domestic applications, there is little proof of the ratio ≈ 0.82. Ding et al. [7] showed that OH*
 adequate performance of such systems when adding chemiluminescence signals could be used for sensing the
 hydrogen [2]. equivalence ratio in a domestic boiler also in the case of
 Domestic condensing boilers are usually equipped with variable fuel composition, including H2 admixtures.
 cylindrical or flat perforated burners that inject a Burbano et al. [8] analyzed the effects of hydrogen
 premixed mixture into the combustion chamber. The addition to methane on the flame structure and CO
 major feature of such burners is to provide a short-length emissions in atmospheric burners.
 flame and uniform temperature [2]. The existing Further and significant insight into the combustion
 literature concerns mainly experimental investigations process, allowing to better comprehend the experimental
 aimed at determining the burner performance in different evidence, may be gained from resolved numerical
 operating conditions. Lee et al. [3] analyzed simulations, based on the application of Computational
 experimentally flame stability, NOx and, CO emissions Fluid Dynamics (CFD) techniques, which have grown
 from a perforated cylindrical burner fed with methane,

 * Corresponding author: rachele.lamioni@dici.unipi.it

© The Authors, published by EDP Sciences. This is an open access article distributed under the terms of the Creative Commons Attribution License 4.0
(http://creativecommons.org/licenses/by/4.0/).
premixed flames were performed using the GRI-Mech 3.0 [14] At the
 kinetic mechanism. The conservation equations for mass, prescribed
 momentum, energy, and transport equations for the mass and the ga
 fractions of chemical species were solved in steady-state con- between th
E3S Web of Conferences 238, 04001 (2021) https://doi.org/10.1051/e3sconf/202123804001

 ditions: K). All ot
100RES 2020

 metry bou
 considerably in the last decades along with the rapid ( (⇢v) = 0 (1)
 (2)
 development of computational power. So far CFD has
 ( (⇢vv) = (p + ( (⌧) Ñ 2.4. Solu
 been applied to condensing boilers mainly to address the
 ( (v(⇢E + p)) = ( (kef f (T ) + Sh (3) The ab
 problem of gas distribution and mixing upstream of the based cou
 burner and only a few works have dealt with the (⇢Yi ) + ( (⇢vYi ) = *⇢Di (2 Yi + Ri (4) using a ce
 simulation of the combustion process. Zhao et al. [9] and second-or
 Zhang et al. [10] presented two different studies to wherewhere v is velocity, ⌧Ñ is the stress
 is the velocity, tensor,
 ̄ is the h is the energy
 stressStensor, is the istry integ
 optimize geometry parameters of a premixed cylindrical sourceenergy term, including the contribution of radiation, Yi is
 h
 The fuel-
 burner using CFD in order to reduce NOx and CO the mass fraction of the i-th species and kef f is the effec-
 source term, including the contribution of
 radiation, is the mass theof -th near to the
 emissions. Hassan et al. [11] developed a two- tive thermal conductivity. Ri is the netofrate production or
 fraction species and
 convergen
 dimensional CFD model based on partially premixed destruction isofthetheeffective
 i-th chemical
 thermal species by chemical
 conductivity. isreaction
 the net tions and
 and equilibrium chemistry calculations to simulate the (described later in this section).Di is the molecular diffusion
 rate of production or destruction of the -th chemical
 combustion process taking place in the combustion coefficient of the i-th chemical species in the mixture. Bi-
 3. Resu
 chamber of a domestic boiler equipped with a perforated nary diffusion coefficients are firstly calculated following the
 species by chemical reaction (described later in this
 kinetic theory and a modification of the Chapman–Enskog Figure
 D
 section). D is the molecular diffusion coefficient of the
 cylindrical burner. Recently, Hinrichs et al. [12] carried
 formula;
 -th then
 chemicali is obtained
 species by
 in applying
 the mixture.the Wilke’s
 Binary mixing
 diffusion fractions a
 rule. Radiation is taken into account with the the P1 model
 out numerical simulations with detailed chemistry to
 by the 1-D
 [15, 16] using the weighted-sum-of-gray-gases model with
 shed light on the main pathways to pollutant emissions,
 for differe
 coefficients are firstly calculated following the kinetic
 coefficients from Smith [17] to estimate spectral properties. analysis is
 i.e., NOx and CO, which is in a condensing boiler. Their theory and a modification of the Chapman–Enskog
 for the G2
 model was limited to a single-hole of a perforated formula; then D is obtained by applying the Wilke’s
 temperatu
 cylindrical burner. The CO concentration in the cooled 2.2. mixing
 Computational
 rule. Radiation domain
 is taken into account with the P1
 exhaust gas was observed to be significantly larger than The multi-hole
 model [15, 16] geometry
 using theis shown in Figure 1 and con-
 weighted-sum-of-gray-gases in the latte
 the chemical equilibrium one because of the rapid sists of four holes
 with having a diameter placed at the
 to vertices
 model coefficients from D Smith [17] estimate influenced
 quenching, triggered by the fast depletion of OH of a R rectangle. In order to investigate the effect
 ù 1.1R
 spectral properties. ing to the
 radicals, of CO oxidation reactions. of flame interaction, the distance between the holes was var- ature is fo
 The present work is aimed at carrying out resolved CFD ied by2.2.Computational
 using different R_Ddomain ratios thus leading to the three tween the
 simulations to analyze flame interactions in multi-hole geometries in Table 1.
 geometries emulating a portion of burners, which are The multi-hole geometry is shown in Fig. 1 and consists
 of fouretholes
 fitted in a domestic condensing boiler. In such burners R. Lamioni having asubmitted
 al.: Preprint diametertoDElsevier
 placed at the vertices
 the holes are usually positioned very close to each other of an R x 1.1 R rectangle. In order to investigate the
 and hence flame interactions may arise, thus affecting effect of flame interaction, the distance between the
 the resulting fluid-dynamic and thermo-chemical fields. holes was varied by using different R/D ratios thus
 The effect of hydrogen addition to natural gas on the leading to the three geometries in Table 1.
 multi-hole flame is then analyzed by feeding the G222 The 3-D geometries and corresponding grids were
 gas (23% H2, 77% CH4) and comparing results with the
 Table 1: Dimensions of the computational domains in units
 conventional G20 gas (100% CH4). of hole diameter D. R is the hole-to-hole distance.

 Domain R x 1.1R Ncell
 2.Numerical model
 R1 25Dx1.5Dx1.65D 1.5D-1.65D 56000
 Preliminary, 1-D freely propagating flames simulated R2 25Dx1.75Dx1.9D 1.75Dx1.9D 64000
 using OPENSMOKE-SUITE [13] with GRI3.0
 R3 25Dx2Dx2.2D 2Dx2.2D 73000
 mechanism, including 53 reactive chemical species and
 325 elementary reactions, in order to analyze the flame created using ANSYS-ICEM. The symmetries of the
 structure. Subsequently, a 3-D model with CFD was burner suggest that a quarter of the hole can be
 developed to gain insight into the effect of geometrical considered; however, in order to better study the flame
 configuration on the interaction between the flames. interaction, four quarters of holes were used as depicted
 in Fig. 1. The computational grids were generated by
 2.1.Physical model ensuring ∼ 8 points within the flame thickness, estimated
 from the 1-D simulation of the freely propagating flame.
 3-D simulations of lean hydrogen-methane-air laminar
 The thermal flame thickness is calculated using the
 premixed flames were performed using the GRI-Mech
 temperature profile across the flame front [18]:
 3.0 [14] kinetic mechanism. The conservation equations
 for mass, momentum, energy, and transport equations for
 (Tb T(Tu)
 b Tu )
 the mass fractions of chemical species were solved in lT = lT = (5) (5)
 (@Tmax
 (@T /@z)| /@z)|max
 steady-state conditions:

 2
E3S Web of Conferences 238, 04001 (2021) https://doi.org/10.1051/e3sconf/202123804001
 Leveraging social media news
100RES 2020
 Leveraging social media news
 R R
 R R

 1.1R 1.1R
 1.1R 1.1R

 (b) (b)
 (a) (a)
 (a) Figure 1: SketchFigure
 of the1:(a) computational
 Sketch (b)
 domain and (b)
 of the (a) computational computational
 domain grid.
 and (b) computational grid. (c)

 Fig. 1. Sketch of the (a) burner portion, (b) computational
 0.20
 domain, and (c) grid.
 2100
 0.20 2100 1D
 1D
 0.006 3D R1 3D R1
 1800 0.006 3D R2
 0.16
 0.16 1800 3D R2
 1D-T 3D R3

 Temperature [K]
 1D-T 3D R3

 Temperature [K]
 XCH4 , XO2 [-]

 1D-CH4 1500
 XCH4 , XO2 [-]

 1D-CH
 where Tb and Tu are the 0.12burnt and0.12unburnt 4
 by setting a high temperature
 15001D-O2
 0.004 (2500 K). At convergence,

 XOH [-]
 1D-O 3D-CH4

 XOH [-]
 2 0.004
 3D-CH 1200
 4 12003D-O2
 temperature respectively, while 0.08
 (@T /@z)|max representing
 0.08 3D-O 2 normalized
 3D-T-R1
 900
 residuals did not change with iterations and
 3D-T-R1 3D-T-R2
 0.002
 the temperature gradient. 3D-T-R2 900
 3D-T-R3
 were all −6
 600below 10 .
 0.04 3D-T-R3 0.002
 0.04 600
 0 300 0
 2.3.Boundary conditions 0 5D 10D300 15D 20D 0 5D 10D 15D 20D
 3.Results
 0 0
 0 5D 10D 15D Z20D
 [-] 0 5D 10D 15DZ [-] 20D

 (a) (b)
 Z [-] Z [-]
 Velocity inlet was set at the bottom side of the holes, (a) along the holeFigure (b)
 Figure 2: Profiles 2 shows
 axis of (a) temperature, theCH temperature,
 4 , O2 and (b) OH CH mole , O ,
 4 2 predicted
 fractions and OH mole by the 1-D (solid lines)
 through which air-fuel mixture enters and with a(dashed
 3-D the uniform
 Figure 2: Profiles along hole lines)
 axis ofmodels. G20 gas.
 (a) temperature,
 fractions along the flame axis for the G20 gas (solid
 CH 4 , O 2 and (b) OH mole fractions predicted by the 1-D as lines)
 velocity = 1.5 m/s andandtemperature,
 3-D (dashed lines) models.
 = 300G20K,gas.
 computed by the 1-D and 3-D simulations, the latter
 ensuring a fully laminar flow. The mixture fractions, indicated a good agreement
 composition
 being between
 carried1-Dout and for
 3- different
 SL , calculated from the 1-D
 distances freely propagating
 between the flame sim-
 D0.8predictions and the
 literature [19], thus confirming also the ulations. The velocity distribution indicates the presence of
 fractions, indicated a good agreement between
 corresponds to an equivalence ratio = for both 1-D and 3- The , calculated from is
 SLsame theshown
 1-D freely propagating flame sim-
 accuracy of the reacting module available
 burner in the CFD
 holes. code. analysistwo velocity peaks alonginthe hole3axis.
 Fig. in theThe first peak may
 G20 and G222 fuels. At Dthe predictions
 exit ofand literature
 Conversely,
 the domain, [19],
 the OH thusa confirming
 concentration also the
 highlights ulations.
 significant dif- The
 be velocity
 explained distribution
 by the gas indicates the
 acceleration due presence of heat
 to the mixture
 accuracy of the reacting
 ferences module the
 between available
 freely in the CFD flame
 case
 propagating
 of code. and the
 hydrogen two3-D velocityup;peaks
 addition, i.e.,
 this along
 for
 first
 the
 peak thetakes
 holeplace
 G222 axis.atThe
 gas.
 Z
 We
 ˘first
 can
 1D peak may
 independently on
 pressure outlet boundary isConversely, the OH concentration highlights significant
 appear toadif- be explained thebyhole-to-hole
 theingas acceleration duesecond
 to profile
 the mixture heat occurs
 prescribed. The conduction
 model; moreover, the OH levels observe bedifferent
 different forbehavior the distance.
 temperature The velocity peak
 heat exchange between the ferences
 burner between
 and the thethe
 gas freely
 three propagating
 R values,
 mixture thus flame
 is indicating and
 that the
 between 3-D
 the distance
 the 1-D up; and
 betweenthis first peak
 just
 3-D takes place
 downstream
 simulations, of theatas
 flame
 Z ˘ theindependently
 infront
 1D thus its positionon
 latter increases
 model; moreover,
 considered to set the wall temperature thethe
 between OHthe
 burner levels
 holes appear
 affects
 holes thetoreaction
 be different
 region.forThe strongest
 the hole-to-hole from Z distance.
 ˘ 2.1DThe to Zsecond˘ 2.3D velocity
 whenpeak occursR from
 increasing
 the three R values, thus indicating
 reaction zone, whichthat the distance
 is denoted by thebetween thejust
 highest values
 simulations downstream
 oftemperature
 the R = 1.5Dof theintoflame
 Rthe = front fresh
 2.0D, thus
 i.e. its
 fromposition
 zonethe R1 isincreases
 to R3 case. Ac-
 the burner
 higher than the inlet condition ( holes
 = 750 OHaffects
 K). the
 flame All reaction
 marker,other region.
 occurs for the The strongest
 smallest
 influenced by from
 R values, i.e.
 theforZ heat˘ tually to second
 this
 2.1Dexchange Z ˘ peak 2.3Dwithiswhen
 well the increasing
 visible from hole-
 for theRsmallest
 wall
 the closest flames.by thesocial to-hole
 R = distance, while it can
 the beR1scarcely discerned
 Ac- for the
 sides of the domain are reaction zone, which is denoted highest values of the toburner i.e. from to R3 case.
 Leveraging media news Rto= 1.5D 2.0D,
 prescribed with symmetry
 Figure for4 illustrates
 corresponding
 the temperature fieldfor
 in the longitu-
 the largest R
 plate.
 value,
 Moreover,
 i.e. visible
 for the for case.
 theIndeedhole-
 the second
 OH flame marker, occurs the smallest R values, i.e. tually this second peak is well R3the smallest
 the closest
 boundary conditions. The burner R wallflames.dinal plane crossing
 temperature wasthe axes ofdownstream
 two adjacent holes in case distance,
 to-hole
 temperature velocity peakitcan
 is while
 found can bebeascribed
 to scarcely
 diminish to discerned
 flame
 withinteractions;
 for the when
 of methaneR (i.e., G20 gas) and for the three different R val- the hole-to-hole distance is limited, the velocity field is dis-
 Figure 4
 estimated experimental data available ues. illustrates
 for The the temperature
 thisdownstream field
 type oftemperature in the longitu-
 increasing largest
 the distance between R value, i.e. for the R3 case.
 the holes, i.e., . Major Indeed the second
 decreases with increasing turbed by the heat transfer associated to the presence of the
 dinal plane crossing the axes of two adjacent holes in case velocity peak can be ascribed to flame interactions; when
 burner. the hole-to-hole distance; this is species as CH and O mole fractions,jetsindicated
 because the surface area of adjacent reacting resulting inaa good further acceleration of
 of methane (i.e.,the
 G20 gas) plate
 burner and for the three
 increases, different
 thus resulting val-
 R in higherthe hole-to-hole
 4 overall 2 the flow. distance is limited,ofthe
 The distribution OHvelocity field isisdis-
 mole fraction reported in
 ues. The downstream temperature
 heat transfer decreases
 rate from the gas with
 to theincreasing
 burner plate.
 agreement turbed
 The
 between tem-by1-Dthe
 Fig.heat
 6.and transfer
 Firstly weassociated
 3-D observetothat
 canpredictions themaximum
 presence
 and OH of the
 concentra-
 2.4.Solution methodology the hole-to-hole perature
 distance;profiles
 this is along
 because
 the the
 axissurface
 of the area show
 hole of the adjacent
 same reacting
 tions jets for
 occur resulting
 the in ahole-to-hole
 lowest further acceleration
 distance, of
 indicating a
 the burner platetrend,
 increases,
 1.1R thus resulting in higher overall thezone
 flow. The distribution ofzone.
 OH mole fraction is reported in the OH
 1.1R literature [20], thus confirming also the accuracy of the
 although with a different slope in the reaction strongest reaction Secondly we can notice how
 The above set of equations heat
 wastransfer
 solvedratewithfrom
 (see Fig.
 thethe
 4).gas to the burner
 In particular
 pressure- plate.
 the flame Themoves
 front
 reacting tem- Fig.
 downstream
 module 6. Firstly
 available we thecan observe
 distribution
 in that maximum
 moves closer
 CFD code. toConversely,OH
 the burner concentra-
 plate with increasing
 perature profileswith
 along the axistheofhole-to-hole
 increasing the hole the
 show the same
 distance.
 OH The tions
 velocity
 concentration occur
 field for hole-to-hole
 the the lowest
 highlights hole-to-hole distance,the
 distance. In particular
 significant differences indicating
 wavy shape a of the
 based coupled algorithm available in ANSYS-FLUENT
 trend, although is with a different
 reported in Fig. slope in same
 5 for the the reaction
 G20 gas.zone strongest
 The velocity val- reaction zone. Secondly
 OH concentration is morewe can noticewith
 pronounced howincreasing
 the OH the R
 19.2 [19] using a central (see differencing ues arescheme
 Fig. 4). In particular normalized
 the flame with
 frontrespect
 for moves todownstream
 the laminar
 between theflame speed propagating
 distribution
 freely value,
 movesthus approaching
 closer aand
 to the burner
 flame single premixed
 plate
 the with
 3-D flame behavior.
 increasing
 with increasing
 diffusion terms and a second-order the hole-to-hole
 upwind scheme distance.
 for The velocitymoreover,
 model; field the hole-to-hole
 the OH levels distance. In particular
 appear to bethedifferent
 wavy shape of the
 is reported in Fig. 5 for the same G20 gas. The forvelocity val- R OH concentration is more pronounced with increasing the R
 convection terms. Chemistry integration
 ues are(a)
 R.was carried
 Lamioni out submitted
 normalized with respect to the laminar flame speed
 et al.: Preprint the
 to three
 Elsevier values,
 value, thus(b)thus indicating that the distance
 approaching a single premixed flame behavior.
 Page 3 of 6
 using the direct integration method. The fuel-oxidizer between the burner holes affects the reaction region. The
 Figure 1: Sketch of the (a) computational domain and (b) computational grid.reaction zone, which is denoted by the highest
 strongest
 mixture is ignited by patching a region near to the inlet
 R. Lamioni et al.: Preprint submitted to Elsevier Page 3 of 6
 0.20 2100
 1D
 0.006 3D R1
 0.16 1800 3D R2
 1D-T 3D R3
 Temperature [K]
 XCH4 , XO2 [-]

 1D-CH4 1500
 0.12 1D-O2
 XOH [-]

 0.004
 3D-CH4 1200
 3D-O2
 0.08 3D-T-R1
 3D-T-R2 900
 3D-T-R3 0.002
 0.04 600

 0 300 0
 0 5D 10D 15D 20D 0 5D 10D 15D 20D
 Z [-] Z [-]

 (a) (b)
 Fig. 2.Figure
 Profiles
 2: along thealong
 Profiles holethe
 axishole
 of (a)
 axis Temperature, CH4 ,CH
 of (a) temperature, O24and
 , O2 (b)
 and OH molemole
 (b) OH fractions predicted
 fractions byby1-D
 predicted the(solid lines)lines)
 1-D (solid and 3-D
 (dashedand 3-D models.
 lines) (dashed lines) models. G20 gas.
 G20 gas.

 fractions, indicated a good agreement between 1-D and 3- SL , calculated from the 1-D freely propagating flame sim-
 D predictions and literature [19], thus confirming also the 3 ulations. The velocity distribution indicates the presence of
 accuracy of the reacting module available in the CFD code. two velocity peaks along the hole axis. The first peak may
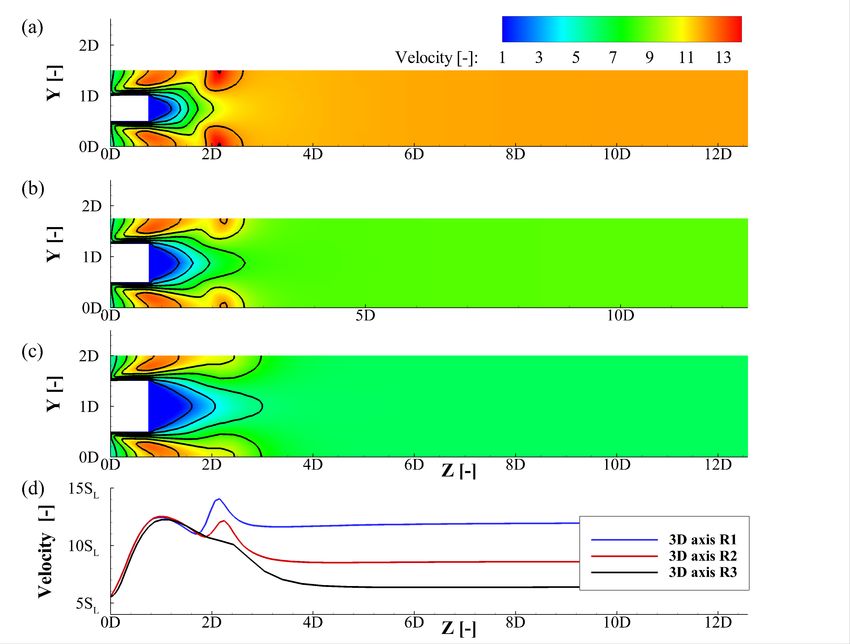
E3S Web of Conferences 238, 04001 (2021) Leveraging social media
 Leveraging social news
 media news https://doi.org/10.1051/e3sconf/202123804001
100RES 2020 Leveraging social media news
 0.20 0.20 2100 2100
 1D 1D
 0.006 3D R1 3D R1
 0.006
 0.16 0.16
 0.20 1D-T 1D-T1800 1800 2100 3D R2 3D R2
 1D
 3D R3
 XH2 , XCH4 , XO2 [-]

 1D-H2 1D-H2 3D R3

 XH2 , XCH4 , XO2 [-]

 Temperature [K]
 3D R1

 Temperature [K]
 1D-CH4 1D-CH41500 1800 0.006
 0.16 1D-O2 1D-O2 1500
 1D-T 3D R2
 0.12 3D R3

 XH2 , XCH4 , XO2 [-]
 0.12 1D-H2

 XOH [-]
 3D-H2 3D-H2 0.004

 XOH [-]
 0.004

 Temperature [K]
 3D-CH4 3D-CH412001D-CH 4
 1200 1500
 0.12 3D-O2 3D-O2 1D-O 2

 XOH [-]
 0.08 0.08 3D-H2
 3D-T-R1 3D-T-R1 3D-CH 0.004
 3D-T-R2 3D-T-R2900 3D-O 4
 900 1200
 3D-T-R3 3D-T-R3 3D-T-R12 0.002 0.002
 0.08
 0.04 0.04 6003D-T-R2 900
 600 0.002
 3D-T-R3
 0.04 600
 0 0 300 300 0 0
 0 5D
 0 10D
 5D 15D
 10D 20D
 15D 20D 0 5D
 0 10D
 5D 15D
 10D 20D
 15D 20D
 300
 Z0 [-]
 0 Z [-]
 5D 10D 15D 20D Z [-]0 0 Z [-] 5D 10D 15D 20D

 (a)
 Z [-]
 (a) (b) (b)
 Z [-]

 (a) (b)
 Figure Figure
 3: Profiles along the
 3: Profiles holethe
 along axis
 holeof axis
 (a) temperature, CH4, OCH
 of (a) temperature, 2 (a)
 4, O and (b)and
 2 (a) OH(b)
 moleOHfractions predicted
 mole fractions by the by
 predicted 1-Dthe(solid
 1-D (solid
 Fig. 3.and
 lines) Profiles
 3-D
 Figure along
 (dashed
 3: the hole
 lines)
 Profiles axis
 models.
 along of
 the (a)
 G222
 hole Temperature,
 gas.
 axis
 lines) and 3-D (dashed lines) models. G222 gas. of (a) CH , O
 temperature,
 4 2 and
 CH (b)
 4 , O2
 OH
 (a)mole
 and fractions
 (b) OH predicted
 mole bypredicted
 fractions 1-D (solid
 by lines) and(solid
 the 1-D 3-D
 lines)models.
 (dashed lines) and 3-DG222
 (dashed
 gas.lines) models. G222 gas.

 Fig. 4. Figure
 Figure Temperature
 4: Temperature
 4: 4:
 Figure distribution
 distribution
 Temperature
 Temperature in the longitudinal
 in the
 distribution
 distributionlongitudinal plane
 plane plane
 in inthethelongitudinal
 longitudinal Figure Fig.
 plane 5:Figure
 Velocity
 Figure 5. 5: distribution
 5: Velocity
 Velocity
 Velocity in theinlongitudinal
 distribution
 distribution
 distribution inthe plane cross-
 thelongitudinal
 longitudinal
 longitudinal plane cross-
 plane
 plane cross-
 crossing
 crossing the
 the axes
 axes of
 of two
 two adjacent
 adjacent holes
 holesforfor(a) ==
 RRfor
 (a)for 1.5D,
 RR=(b)
 1.5D, 1.5D,
 = ing
 1.5D,(b)
 (b) (b) thecrossing
 axes
 ing
 ing the
 theofaxes
 two of
 axes adjacent
 of two
 two holes for
 adjacent
 adjacent (a) for
 holes = 1.5D,
 R (a)
 (a) = (b)
 ==1.5D,
 1.5D, (b)
 crossing the
 crossing axes
 the of
 axes twotwo
 of adjacent
 adjacent holes
 holes (a)(a) the axes of two adjacent holes for RRR
 (a) 1.5D,(b)
 (b)
 R
 R= = 1.65D,
 1.65D, (c)
 R =R1.65D,
 (c) RR==(c)
 = 1.65D, 2.0D
 (c)
 2.0D =Rand
 R and (d)temperature
 =(d)
 2.0D
 2.0D temperature
 andand(d)(d) profilesalong
 temperature
 temperature
 profiles along R = 1.65D,
 profilesalong
 profiles along (c)
 RR==1.65D, R =(c)
 1.65D, 2.0D
 (c) RR ==and
 2.0D
 2.0D(d)and
 velocity
 and profilesprofiles
 (d) velocity along the
 profiles along
 along the
 the
 the
 R
 hole axis. = 1.65D,
 Velocity (c) R =
 values are2.0D and (d)
 normalized velocity profiles
 with respect along
 to the to the
 the hole axis.
 holethe the
 axis. G20
 holehole gas.
 axis.
 axis.
 G20 G20
 gas. G20 gas.
 gas. hole
 hole
 hole
 axis. Velocity
 axis.
 axis.
 Velocity values
 values are normalized
 are with
 with respect
 respect
 Velocity values are normalized with respect to SL .
 to the
 the
 SL . G20SSLgas.
 L. .G20
 G20gas.
 gas.
 G20 gas.
 valuesIn case
 of theInofcase
 hydrogen
 In OHcase
 offlame addition,
 of hydrogen
 hydrogen marker, i.e.occurs
 addition, G222
 addition, mixture,
 i.e.i.e.G222
 forG222 we ob- we
 mixture,
 mixture,
 the smallest weob-ob-
 Rserve the
 values, serve
 downstream the downstream
 temperature temperature
 to
 serve the downstream temperature to decrease with
 i.e., for the closest flames. decrease to decrease
 with withincreas-
 increas- more from
 increas- more
 evident
 more evident
 for
 Zevidentthe R1
 ≈ 2.1D for
 for the
 case
 tothe Z R1 R1 case
 ≈as2.3D
 imputed
 case as
 as imputed
 to flame
 imputed
 when to
 increasingflame
 flame interaction.
 tointeraction. interaction.
 R from R =
 ing
 Figure ing
 R in ing
 agreement in agreement
 with
 in agreementthe
 R
 4 Rillustrates the with
 features the
 withtemperature offeatures
 the
 the features of field G20 of the
 case. G20Fig-
 the G20incase. theFig- 1.5D to R = 2.0D, i.e, from the R1 to R3the
 case. The
 Fig- OH The
 The OH
 concentration,
 OH concentration,
 concentration,in Fig. in
 7d,
 in Fig.
 Fig. 7d,
 confirms
 7d, confirms
 the
 confirms shift theofshift
 OHof
 shift ofOHOH
 ure 7a ure
 compares
 ure 7a 7a compares
 temperature
 compares temperature
 profile
 temperature profile
 along
 profile the along
 along hole thethehole
 axis hole
 ob- axisob-
 axis ob- towards
 peak peaktowards
 peak towards
 the burner theburner
 the burner
 for the G222for the
 for thegasG222
 G222 duegas
 gas due
 to the
 due to
 to the
 hydrogen
 case.
 the hydrogen
 Actually,
 hydrogen
 longitudinal
 tained for tained
 the for for
 plane
 three the three
 crossing
 configurations configurations
 the axes with
 with G20
 of two
 and G20
 G222 and G222mix-
 adjacent
 mix- mix-
 reactivity. reactivity.
 reactivity.
 this second peak is well visible for the smallest hole-to-
 tained theof three configurations with G20 and G222
 tures. We
 holes in tures.
 the can We
 notice
 case can
 that notice
 methaneH that
 addition
 (i.e.,H addition
 leads
 G20 to
 gas) leads
 an to an
 anticipa-
 and for anticipa-
 the In order InIn order
 toorder
 bettertotohighlight
 better highlight
 better highlight
 it the
 caneffect the
 bethe effect
 of of
 H2 addition,
 effect H
 H22 addition,
 ofdiscerned the for
 addition, the
 thethe
 tures. We can notice 2that H2 addition leads to an anticipa-
 2 hole distance, while scarcely
 thetion of thevalues.
 temperature torise due to reactivity
 the high reactivity
 of hy- ofofhy- hy- largest
 distributiondistribution
 ofR the of the
 formyl formyl
 radical, radical,
 i.e.R3HCO, i.e. HCO, is shown in
 tion ofdifferent
 three tion temperature
 of theRtemperature rise due Therise the
 duehigh to the hightemperature
 downstream reactivity distribution of
 value, the
 i.e.,formyl
 for the radical, i.e. is
 case. HCO,shown
 Indeed in second
 is the
 shown in
 drogen.drogen.drogen.
 However, However,
 it is worth it is worth
 noting noting
 that thethat that
 G222 the G222 mixture
 Fig. 8 forFig.the 8 for
 two the
 gases two ingases
 the in
 threethe three configurations.
 configurations. Inject- Inject-
 decreases withHowever,
 increasing it istheworth noting
 hole-to-hole the mixture
 G222 this
 distance; mixture velocity Fig. 8 forpeak the two gases inascribed
 the three to configurations. Inject-
 a contains a limitedofamount of hydrogen, which represents the H leads
 ing ing H2 leads to a shift
 can be oftowards
 HCO towards the burner
 flame
 and to and a to
 interactions; a
 iscontains limited
 contains amount
 a limited amount hydrogen,
 of which plate
 hydrogen, represents
 whichincreases, the
 represents the 2 ing H2toleads a shiftto aofshiftHCOof HCO towards the burner the burner and to a
 because theby volume
 surface of
 area the
 offuelthecorresponding
 burner to by weight. small
 small increase
 when theincrease
 (slightly (slightly
 hole-to-hole visible
 visible visible in
 in the contours)
 distance theis contours) of
 of the width
 limited, the
 the width
 velocity
 by23%volume
 23% resulting 23%
 by of athehigher
 volume fuel
 of the corresponding heattotransfer
 fuel corresponding 3.6%toby3.6% weight.
 3.6%
 by weight. small increase (slightly in the contours) of the width
 thus In1-Dfact,
 in the 1-D simulationsoverall pointed outdifference
 a small
 rate difference
 from
 of inHCO ofregion.
 HCO region.
 Augmenting Augmenting
 thehole-to-hole hole-to-hole
 distance distance
 causescauses
 In fact,Inthefact, simulations
 the 1-D pointedpointed
 simulations out a small
 out a small in
 difference in ofboth
 field HCO region.
 is disturbed Augmenting
 by heat hole-to-hole
 transfer distance
 associated causes
 with the
 gas totheflame laminar flameplate.speed which was estimated to be 0.27 both
 m/s apresence a lowering ofadjacent
 the radicalreacting concentration and an on in-
 the laminar
 the the speed
 burner which was Theestimated
 temperatureto be m/s
 profiles lowering
 both of
 a lowering the radical
 of the concentration
 radical and an on in-
 theandlaminar flame speed which andwas estimated to be 0.27 m/s HCO concentration and an areon in- a
 0.27 of the jets resulting in
 0.35 m/shole
 for the G20 G222 mixtures, respectively, crease of the width of the region. This effects con-
 and 0.35 m/s for the G20 and G222 mixtures, respectively, crease of the
 crease width of the HCO region. This effects are con-
 andin0.35 m/s forwith the G20 and G222 worksmixtures,[20, 21]. respectively, firmedofinthe width of the HCOtheregion.HCO This effects arealong con-
 along the axis of the show the same trend, although
 agreement the others
 further Fig.
 acceleration 7c that of shows
 the flow. concentration
 in agreement
 with a different withslope
 in agreement the others
 Figure with
 inthe
 7b shows
 theworks
 others [20,zone
 works
 the velocity
 reaction 21]. [20,(see
 profiles 21]. Fig. 4). In firmed firmed
 along the hole axis The
 in Fig. 7cFig.
 in
 thedistribution
 hole
 that shows
 axis. 7c We ofthat
 can
 OH themole
 shows HCO
 also notice
 concentration
 thefraction
 HCO
 a shift
 along in Fig.
 concentration
 the profilealong
 in reported
 is due
 Figure Figure
 7b shows 7b the
 showsvelocity profiles
 the velocity
 movesprofiles along the
 alonghole axis the holetheaxis. We
 holehydrogen canWe
 axis. also can notice
 also anotice
 shift ainshift
 the profile
 inthetheG222due due
 profile
 particular, forthebothflame
 G20 andfront
 G222 mixtures. Also in
 downstream case the
 of Hhole
 with axis
 2 addition 6. to Firstlythe addition when comparing to theOH
 for bothforG20 and G222 mixtures. Also inAlso
 case in oftheH2second
 addition to the hydrogen addition when comparing the G222 to thevalues
 we can observe that maximum
 both
 two G20
 velocity andpeaks
 G222can mixtures.
 be identified, case of H addition
 2 one tothetheG20
 isbeing concentration hydrogen
 gas. addition
 This funding whenis incomparing
 agreement the
 with G222
 the to the
 the G20 gas. This funding is in agreement with the values
 increasing the hole-to-hole distance. The velocity field
 two velocity
 two peaks
 velocity can
 peaks be identified,
 can be the
 identified, second the one
 second being
 one being the G20 gas. This
 occursfunding
 foris in agreement
 the lowest with the values
 hole-to-hole
 reported in Fig. 5 for the same G20 gas. distance, indicating the strongest reaction zone.
 The velocity R. Lamioni
 valuesetare Preprint submitted
 al.: normalized with to Elsevier
 respect to the Secondly, we can notice how the OH distribution Page 4 moves
 of 6
 R. LamioniLamioniet al.: Preprint submitted
 et al.:S Preprint to Elsevier
 submitted to Elsevier Page 4 Page of 6 4 of 6
 laminarR.flame speed L, calculated from the 1-D freely closer to the burner plate by increasing the hole-to-hole
 propagating flame simulations. The velocity distribution distance. In particular, the wavy shape of the OH
 indicates the presence of two velocity peaks along the concentration is more pronounced with increasing the R
 hole axis. The first peak may be explained by the gas value, thus approaching a single premixed flame
 acceleration due to the mixture heat up; this first peak behavior. In the case of hydrogen addition, i.e., G222
 takes place at Z ≈ 1D independently on the hole-to-hole gas, we observe the downstream temperature to decrease
 distance. The second velocity peak occurs just with increasing R in agreement with the features of the
 downstream of the flame front thus its position increases G20 case. Fig. 7a compares the temperature profile

 4
E3S Web of Conferences 238, 04001 (2021) https://doi.org/10.1051/e3sconf/202123804001
100RES 2020 Leveraging
 Leveragingsocial
 social media news
 media news

 2100
 2100
 2100
 1800
 1800
 1800

 [K]
 [K]
 Temperature[K]
 1500 G20-R1
 G20-R1
 1500
 1500 G20-R1
 G222-R1
 G222-R1

 Temperature
 G222-R1

 Temperature
 1200 G20-R2
 G20-R2
 1200
 1200 G20-R2
 G222-R2
 G222-R2
 G222-R2
 G20-R3
 G20-R3
 900
 900 G20-R3
 G222-R3
 G222-R3
 900 G222-R3
 600
 600
 600
 300
 300
 30000 2D 5 4D 6D
 10 8D 15 10D 12D
 20
 0 2D 4D XZ[mm]
 [-]6D 8D 10D 12D

 (a) Temperature
 Z [-]

 4.5
 4.5 (a) Temperature
 G20-R1
 G20-R1 G20-R2
 G20-R2 G20-R3
 G20-R3
 4.5
 44 G222-R1
 G222-R1 G222-R2
 G222-R2 G222-R3
 G222-R3
 G20-R1 G20-R2 G20-R3
 4
 3.5
 3.5 G222-R1 G222-R2 G222-R3

 [m/s]
 [m/s][m/s]
 33
 3.5

 Velocity
 Velocity
 2.5
 2.53

 Velocity
 22
 2.5
 1.5
 1.5
 2
 Figure 6: Distribution of OH mole fraction in the longitudinal
 11
 plane crossing the axes of two adjacent holes for (a) R= 1.5D, 1.50 0 2D 5 4D 6D10 8D 1510D 12D
 20
 Figure 6:R=1.65D,
 Distribution
 Fig. 6.(b)Distribution(c)
 of OH
 of R=2.0D
 OH mole
 mole fraction
 fraction
 and in the
 (d) profiles
 inoflongitudinal
 the longitudinal
 OH mole fraction Z [-]
 X [mm]
 1
 plane crossing
 the the axes ofG20
 twogas.
 adjacentholes
 holesfor for(a)
 (a)RR=
 = 1.5D, (b) Velocity
 0 2D 4D 6D 8D 10D 12D
 planealong
 crossing the
 holeaxes
 axis.of two adjacent
 (b) R=1.65D,
 1.5D, (c) R=2.0D
 (b) R = 1.65D, (c) R =and (d)and
 2.0D profiles of OH mole fraction
 (d) temperature
 Z [-]

 along the hole axis. G20 gas.
 profiles along the hole axis. G20 gas. (b) VelocityG222-R1
 G20-R1
 Table 2 2e-5 G20-R2
 G222-R2
 Thermal flame thickness estimated from 1-D and 3-D simula- G20-R1
 G20-R3
 1.5e-5 G222-R1
 Tabletions.
 2 Thermal flame thickness estimated from 1-D
 XHCO [-]XHCO [-]
 G222-R3
 2: 2e-5 G20-R2
 G222-R2
 Thermal flame thickness
 and 3-D simulations. 1-D estimated
 3-D R1from3-D
 1-D
 R2and3-D
 3-DR3simula- 1e-5 G20-R3
 1.5e-5
 tions. G20 0.664D 0.497D 0.792D 0.854D G222-R3
 5e-6
 G222 1-D0.605D3-D0.512D
 R1 3-D0.845D
 R2 3-D 0.89D
 R3 1e-5
 1-D 3-D R1 3-D R2 3-D R3
 G20 0.664D 0.497D 0.792D 0.854D 0
 G20 0.664D 0.497D 0.792D 0.854D 5e-60 2D 4D 6D
 G222
 Table 3 0.605D 0.512D 0.845D 0.89D Z [-]
 G222 0.605D 0.512D 0.845D 0.890D
 Outlet CO value in ppm for all cases. 0
 0 (c) 2D
 HCO 4D 6D
 Table 3 3-D R1 3-D R2 3-D R3 Z [-]
 Outlet CO
 Table 3: G20
 valueCO
 in value in887
 ppm for for 485
 all cases. 259
 all cases.
 G20-R1
 (c) HCO
 Outlet ppm 0.006 G222-R1
 G222 694 383 146 G20-R2
 3-D R1 3-D R2 3-D R3 G222-R2
 G20-R3
 G222-R3
 G20 887R1 4853-D R2 259 3-D R3 G20-R1
 XOH [-]

 3-D 0.004
 G222-R1
 of flame thermal thickness, which were estimated from tem-
 0.006
 G20 G222 694
 887 383 485 146 259 G20-R2

 perature
 G222 profiles. Such 694 values are383 reported in Table 2 for
 G222-R2
 146 0.002 G20-R3

 all configurations and two mixtures. For sake of compari-
 G222-R3
 XOH [-]

 0.004

 of flame
 along thethermal
 son the
 holethermalthickness,
 axis thicknesswhich
 obtained for
 forthe were
 thefreelyestimated
 three propagatingfrom
 configurations tem-is
 flame 0

 perature
 also profiles.
 shown. InSuch the 1-D values
 model arethereported in Table
 flame thermal 2 for
 thickness
 0 2D 4D 6D 8D 10D 12D
 0.002
 Z [-]
 all configurations
 diminishes when andadding
 two mixtures.
 hydrogen,For sake
 while theofopposite
 compari- be-
 with G20 and G222 gas. We can notice that H2 addition
 (d) OH
 leads haviour
 son the
 to thermalwasthickness
 observed
 an anticipation for
 offor all
 thethe 3-D
 freely
 temperaturesimulations,
 propagating
 rise duetaking
 flame
 to thein isto 0
 account flame
 also reactivity
 shown. interaction
 Inofthehydrogen.
 1-D model (especially
 the flameitfor isthe
 thermal case)
 R1thickness and
 0 2D 4D 6D 8D 10D 12D
 high However, worth noting Figure 7: (a) Temperature, (b) velocity, (c) HCO and (d) OH
 Fig. 7. Distribution (a) Temperature,
 Z [-] (b) velocity, (c) HCO
 the
 diminishes heat flux
 when exchanged
 adding between
 hydrogen, the
 while flame
 the and the
 opposite burner
 be-
 mole fractions along the hole axis for G20 (solid lines) and
 that the G222 gas contains a limited amount of
 plate. Table 3 shows G222 (dashed lines) gases. (d) OH
 for the value of CO at thetakingoutlet for all
 and (d) OH mole fractions along the hole axis for G20 (solid
 haviour was observed all 23%
 3-D simulations, in to
 simulations. The addition of hydrogen leads to a reduction
 hydrogen, which represents by volume of the fuel lines) and G222 (dashed lines) gases.
 account flame to interaction (especially for 1-D
 the R1 case) and Figure 7: (a) Temperature, (b) velocity, (c) HCO and (d) OH
 of the CO values,
 corresponding 3.6%inby agreement
 weight.with The the literature [8]. We
 simulations
 the heat flux exchanged between the flame and the burner mole fractions along the hole axis for G20 (solid lines) and
 canoutnotice the CO concentration
 in thetolaminar
 decrease with speed
 increas- 4. Conclusion
 plate.ingTable 3 shows the value for of both
 CO at theand
 outlet for all
 pointed a small difference flame G222
 towards(dashed lines) gases.
 the burner and a small increase (slightly visible
 the hole-to-hole distance G20 G222 for gases.
 simulations.
 which The
 was estimated addition
 to be of0.27hydrogen
 m/s andleads 0.35tom/sa reductionthe in A the3-Dcontours)
 model was of developed to investigate
 the width of the laminar
 HCO pre-region.
 It is worth noting that the above values are generally much
 of thehigher
 G20 andCO values,
 G222 gas,in agreement
 respectively, withboilers
 in the literature
 agreement [8]. We
 with the mixed flames positioned very close to each other to emulate
 than those of condensing as the present nu- Augmenting hole-to-hole distance causes both a
 can notice
 worksthe CO doesconcentration toaccount
 decrease with increas- portions ofofperforated burners of condensing andboilers. For in
 other merical model
 [21, 22]. not take into
 Figure 7b showsthethe quenching
 velocity due 4. Conclusion
 lowering the radical concentration an increase
 ing the hole-to-hole small hole-to-hole distance the flow field was found to be
 to the presence ofdistance
 the for
 heatfor both G20
 exchanger. G20 andand G222
 G222 gases. theA width
 3-Dfrommodel
 thatwas
 of adeveloped to investigate laminar
 be-pre-
 profiles along the hole axis both gas.
 different of the single laminar
 HCO region. premixed
 These flame
 effects are
 It is worth
 in the noting
 case ofthat
 H2the above values are generally
 peaks much
 Also addition, two velocity can mixed
 cause offlames
 confirmed flamepositioned
 in interactions.very
 Fig. 7c that close to each
 In particular
 shows the HCO otherinterac-
 the flame to emulate
 concentration
 higher than those of condensing boilers as the present nu-
 portions of hole
 perforated
 axis. burners
 We can ofalsocondensing
 notice a boilers.
 shift in For
 merical model does not take into account the quenching due
 be identified, the second one being more evident for the along the the
 small
 profilehole-to-hole distance the flow field
 whenwas found to thebe
 to the
 R1
 R.presence
 case
 Lamioni of the Preprint
 as imputed heat
 to exchanger.
 flame interaction. The OH due to the hydrogen addition comparing
 et al.: submitted to Elsevier
 concentration, in Fig. 7d, confirms the shift of OH peak different
 G222 to from that gas.
 the G20 of a This
 singlefunding
 laminarispremixed
 Page flame
 5 of 6 be-
 in agreement with
 towards the burner for the G222 gas due to the hydrogen cause of flameofinteractions.
 the values In particular
 flame thermal the flame
 thickness, whichinterac-
 were
 reactivity. In order to better highlight the effect of H2 estimated from temperature profiles. Such values are
 R. Lamioni
 addition, al.: Preprint submitted
 theet distribution to Elsevier
 of the radical, i.e., HCO, is reported in Table 2 for all configurationsPage and5 oftwo6
 shown in Fig. 8 for the two gases in the three mixtures. For sake of comparison, the thermal thickness
 configurations. Injecting H2 leads to a shift of HCO for the freely propagating flame is also shown. In the 1-
 D model the flame thermal thickness value decreases

 5
E3S Web of Conferences 238, 04001 (2021) https://doi.org/10.1051/e3sconf/202123804001
100RES 2020
 Leveraging social media news

 study of a cylindrical
 to-hole multi-holeConsistently,
 distances. premixed burner forthe the development
 flame thermal
 ofthickness
 a condensingwas gas boiler.
 found to 36(7):4150–4157,
 Energy, augment with 2011.increasing the
 [4] Mahdi Najarnikoo, Mohammad Zabetian Targhi, and Hadi Pasdar-
 shahri.
 distanceExperimental
 between studytheon theburner
 flame stability
 holes.and color character-addition
 Hydrogen
 ization
 leadsofto cylindrical
 a shiftpremixed
 towards perforated burner of
 the burner ofcondensing boiler region,
 the reaction
 by image processing method. Energy, 189:116130, 2019.
 [5]
 although the behavior of the G20 and
 Fabio Schiro and Anna Stoppato. Experimental investigation of emis-
 G222 gases was
 sions and flame
 rather stability
 similar. for steel
 This canandbemetal fiber cylindrical
 explained bypremixed
 the relatively
 burners. Combustion Science and Technology, 191(3):453–471, 2019.
 low hydrogen content in the inlet mixture, especially
 [6] Hossein Soltanian, Mohammad Zabetian Targhi, and Hadi Pasdar-
 shahri. Chemiluminescence
 considering the premixed usage inflame
 finding configuration.
 optimum operating Further
 range
 work of multi-hole
 will be burners.
 neededEnergy, 180:398–404,
 to include 2019.numerical model
 in the
 [7] Yi Ding, Daniel Durox, Nasser Darabiha, and Thierry Schuller. Com-
 bustion state monitoring
 the effect of the heat of premixed heating appliances
 exchanger to predict withthe
 flameinfluence
 ionization current and chemiluminescence.
 of H2 addition on both CO and NO emissions. Combustion Science and
 Technology, 191(2):382–401, 2019.
 [8] Hugo J Burbano, Andrés A Amell, and Jorge M García. Effects of
 hydrogen addition to methane on the flame structure and co emissions
 Acknowledge
 in atmospheric burners. International Journal of Hydrogen Energy,
 33(13):3410–3415, 2008.
 [9] Dong-Fang
 This work Zhao, Feng-Guo
 was Liu, Xue-Yi
 supported by You,
 the RuiPOR Zhang,
 FESRBin-Long
 2014-2020
 Zhang, and Gui-Long He. Optimization
 “HyPOWERED” project, funded by Regione Emilia- of a premixed cylindrical
 burner for low pollutant emission. Energy Conversion and Manage-
 99:151–160,
 Romagna,
 ment, 2015.
 Italy.
 [10] Tian-Hu Zhang, Feng-Guo Liu, and Xue-Yi You. Optimization of
 gas mixing system of premixed burner based on cfd analysis. Energy
 References
 conversion and management, 85:131–139, 2014.
 [11] Gasser Hassan, Mohamed Pourkashanian, Derek Ingham, Lin Ma,
 and
 1. Stephen
 H. de Taylor.
 Vries,Reduction
 et al. inApplied
 pollutantsenergy,
 emissions 208:1007–1019,
 from domes-
 tic boilers—computational
 2017. fluid dynamics study. Journal of Thermal
 Science and Engineering Applications, 1(1), 2009.
 [12]
 2. N. Mostefaoui et al. Report, 2018.
 Jörn Hinrichs, Daniel Felsmann, Stefan Schweitzer-De Bortoli,
 Heinz-Jörg
 3. S. Lee Tomczak,
 et al.andEnergy,
 Heinz Pitsch. Numerical and experimen-
 36(7):4150–4157, 2011.
 Fig. 8.8:HCO
 Figure HCO mole
 molefraction
 fractiondistribution
 distributionin(Xthe longitudinal
 HCO ) in the lon- tal investigation of pollutant formation and emissions in a full-scale
 gitudinal plane crossing
 plane crossing the axesthe of axes of two adjacent
 two adjacent holes
 holes for G20 forand
 G20 4. M.heating
 cylindrical Najarnikoo et al. Energy,
 unit of a condensing 189:116130,
 gas boiler. Applied Energy, (2019).
 and
 G222 G222 gases
 gases: (a)(a)
 R =R1.5D= 1.5D
 and and
 G20,G20,
 (b) R(b) R = and
 = 1.5D 1.5DG222,
 and 229:977–989,
 5. F. Schiro, 2018. A. Stoppato. Combustion Science and
 G222
 (c) R (c) R = 1.65D and(d)
 G20R =(d) R = and
 1.65D and (e)
 G222
 R =(e) [13] Alberto Cuoci, Alessio Frassoldati, Tiziano Faravelli, and Eliseo
 = 1.65D and G20, 1.65D G222, Technology, 191(3):453–471, 2019.
 = 2.0D = 2.0D Ranzi. Opensmoke++: An object-oriented framework for the numer-
 R
 2.0D and and
 G20,G20(f) (f)
 R =R2.0D andand G222.
 G222.
 ical
 6. modeling of reactive systems
 H. Soltanian with detailed
 et al. Energy, kinetic mechanisms.
 180:398–404, 2019.
 Computer Physics Communications, 192:237–264, 2015.
 [14]
 7. Y. Ding et al. Comb. Sci. and Tech,
 Tetsuya Aizawa. Diode-laser wavelength-modulation absorption
 191(2):382–
 tion leads
 when to a hydrogen,
 adding velocity peak downstream
 while of the behavior
 the opposite reaction re-was 401, for
 spectroscopy 2019.
 quantitative in situ measurements of temperature
 gion. The OH flame marker and the distribution of the HCO and
 8. oh H.radical concentration
 J. Burbano etinal.combustion gases. Applied
 International Journal optics,
 of
 observed for all 3-D simulations, this unusual behavior 40(27):4894–4903, 2001.
 radical indicated a stronger and thinner reaction region for Hydrogen Energy, 33(13):3410–3415, 2008.
 [15] Ping Cheng. Two-dimensional radiating gas flow by a moment
 smaller
 can hole-to-holetodistances.
 be attributed the flameConsistently,
 interactionthe flame ther-for
 (especially
 method. 2(9):1662–1664,
 9. D. F. journal,
 AIAA Zhao et al. Energy 1964. Conv. and Manag, 99:151–
 mal R1
 the thickness
 case) was
 andfound to augment
 the heat with increasing
 flux exchanged the dis-the
 between [16] RHJR Siegel
 160, and2015.John R Howell. Thermal radiation heat transfer,
 tance between
 flame and thethe burnerplate.
 burner holes.Table
 Hydrogen addition
 3 shows theleads
 valueto of hemisphere pub. Corp., Washing ton DC, 1992.
 a shift
 CO attowards the burner
 the outlet of the
 for all reaction region,
 simulations. Thealthough
 additionthe of [17] 10.Smith,
 TF T. ZFH.Shen,
 Zhang and JN et Friedman.
 al. Energy Conv.ofand
 Evaluation Manag,
 coefficients for
 behavior of the G20 and G222 gases was rather similar. This the weighted sum of gray gases
 85:131–139, 2014. model. 1982.
 hydrogen leads to a reduction of the CO values, in [18] ANSYS Fluent et al. 12.0 user’s guide. Ansys Inc, 6, 2009.
 can be explained by the relatively low hydrogen content in [19]
 11. G. Hassan et al. J. of Therm. Sci. and Eng. App.,
 Ekenechukwu C Okafor, Akihiro Hayakawa, Yukihide Nagano, and
 the inlet mixture,
 agreement with especially
 the literature considering
 [8]. Wethecanpremixed
 notice flame
 the CO
 Toshiaki1(1), (2009).
 Kitagawa. Effects of hydrogen concentration on premixed
 configuration. Further
 concentration work will
 to decrease be needed
 with to include
 increasing in the
 the hole-to- laminar
 12. J.flames of hydrogen–methane–air.
 Hinrichs et al. Applied Energy, International Journal of
 229:977–989,
 numerical
 hole model
 distance forthe effect
 both G20of the
 andheat
 G222exchanger
 gases. toIt predict
 is worth Hydrogen Energy, 39(5):2409–2417, 2014.
 2018.
 the influence of Habove [20] Roy Theodorus Elisabeth Hermanns, JA Kortendijk, and RJM Basti-
 noting that the 2 addition
 valueson both
 are CO and NOmuch
 generally emissions.
 higher aans.
 13. Laminar
 A. Cuoci burningetvelocities
 al. Comp. of methane-hydrogen-air
 Phys. Com., 192:237–264, mixtures.
 than those of condensing boilers as the present 2015. Technische Universitat Eindhoven, 2007.
 Praca doktorska,
 [21] Zuohua Huang, Yong Zhang, Ke Zeng, Bing Liu, Qian Wang, and
 Referencesmodel does not take into account the
 numerical
 Deming
 14. T.Jiang. Measurements
 Aizawa. Applied of laminar
 optics, burning velocities for nat-
 40(27):4894–4903,
 [1] Harmen due
 quenching de Vries, Anatoli
 to the V Mokhov,
 presence ofand
 theHoward
 heat Bexchanger.
 Levinsky. The ural gas–hydrogen–air
 2001. mixtures. Combustion and Flame, 146(1-
 impact of natural gas/hydrogen mixtures on the performance of end- 2):302–311, 2006.
 use equipment: Interchangeability analysis for domestic appliances. 15. P. Cheng. AIAA J., 2(9):1662–1664, 1964.
 4.Conclusion
 Applied energy, 208:1007–1019, 2017. 16. R. H. Siegel, J.R Howell. Corp., Wash. DC, 1992.
 [2] Nourreddine Mostefaoui Petra Nitschke-Kowsky Jean Schweitzer Ne-
 A 3-Dgar Sadegh
 model Olivier
 wasThibaut Stephane Carpentier,
 developed Patrick Milin.laminar
 to investigate Self- 17. T. F. Smith et al. J. of Heat Tranf. 1982.
 regulated gas boilers able to cope with gas quality variation state of 18. Poinsot, Thierry, and Denis Veynante. Theoretical
 the art and
 premixed performances.
 flames positioned 2018. close to each other to
 Report, very
 [3] Seungro Lee, Sung-Min Kum, and Chang-Eon Lee. An
 and numerical combustion. RT Edwards, Inc., 2005.
 emulate portions of perforated burners of experimental
 condensing
 boilers. For small hole-to-hole distance, the flow field 19. ANSYS Fluent 12.0 user’s guide. Ansys Inc,6 ,
 R. Lamioni et al.: Preprint submitted to Elsevier 2009. Page 6 of 6
 was found to be different from that of a single laminar
 20. E. C. Okafor et al. Inter. J. of Hydrogen Energy,
 premixed flame because of flame interactions. In
 39(5):2409–2417, 2014.
 particular, the flame interaction leads to a velocity peak
 21. R. Theodorus et al. Technische Universitat
 downstream of the reaction region. The OH flame Eindhoven, (2007).
 marker and the distribution of the HCO radical indicated
 22. Z. Huang et al. Comb. and Flame, 146(1-2):302–
 a stronger and thinner reaction region for smaller hole- 311, 2006.

 6
You can also read