Broadband multi-magnon relaxometry using a quantum spin sensor for high frequency ferromagnetic dynamics sensing
←
→
Page content transcription
If your browser does not render page correctly, please read the page content below
ARTICLE
                  https://doi.org/10.1038/s41467-020-19121-0                 OPEN

                  Broadband multi-magnon relaxometry using
                  a quantum spin sensor for high frequency
                  ferromagnetic dynamics sensing
                  Brendan A. McCullian 1 ✉, Ahmed M. Thabt1, Benjamin A. Gray2, Alex L. Melendez1, Michael S. Wolf2,
                  Vladimir L. Safonov2, Denis V. Pelekhov1, Vidya P. Bhallamudi 3, Michael R. Page 2 & P. Chris Hammel                                                  1✉
1234567890():,;

                  Development of sensitive local probes of magnon dynamics is essential to further understand
                  the physical processes that govern magnon generation, propagation, scattering, and relaxa-
                  tion. Quantum spin sensors like the NV center in diamond have long spin lifetimes and their
                  relaxation can be used to sense magnetic field noise at gigahertz frequencies. Thus far, NV
                  sensing of ferromagnetic dynamics has been constrained to the case where the NV spin is
                  resonant with a magnon mode in the sample meaning that the NV frequency provides an
                  upper bound to detection. In this work we demonstrate ensemble NV detection of spinwaves
                  generated via a nonlinear instability process where spinwaves of nonzero wavevector are
                  parametrically driven by a high amplitude microwave field. NV relaxation caused by these
                  driven spinwaves can be divided into two regimes; one- and multi-magnon NV relaxometry.
                  In the one-magnon NV relaxometry regime the driven spinwave frequency is below the NV
                  frequencies. The driven spinwave undergoes four-magnon scattering resulting in an increase
                  in the population of magnons which are frequency matched to the NVs. The dipole magnetic
                  fields of the NV-resonant magnons couple to and relax nearby NV spins. The amplitude of the
                  NV relaxation increases with the wavevector of the driven spinwave mode which we are able
                  to vary up to 3 × 10⁶ m−1, well into the part of the spinwave spectrum dominated by the
                  exchange interaction. Increasing the strength of the applied magnetic field brings all spinwave
                  modes to higher frequencies than the NV frequencies. We find that the NVs are relaxed by
                  the driven spinwave instability despite the absence of any individual NV-resonant magnons,
                  suggesting that multiple magnons participate in creating magnetic field noise below the
                  ferromagnetic gap frequency which causes NV spin relaxation.

                  1 Department of Physics, The Ohio State University, Columbus, OH 43210, USA. 2 Materials and Manufacturing Directorate, Air Force Research Laboratory,

                  Wright-Patterson AFB, OH 45433, USA. 3 Department of Physics, Indian Institute of Technology, Madras, Chennai 600 036, India. ✉email: mccullian.1@osu.edu;
                  hammel.7@osu.edu

                  NATURE COMMUNICATIONS | (2020)11:5229 | https://doi.org/10.1038/s41467-020-19121-0 | www.nature.com/naturecommunications                                1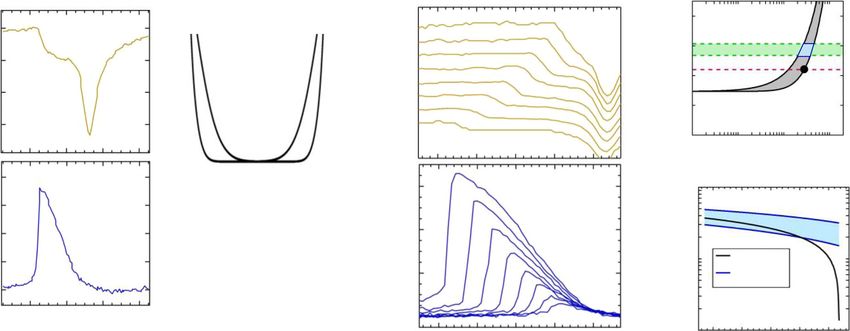
ARTICLE                                                                           NATURE COMMUNICATIONS | https://doi.org/10.1038/s41467-020-19121-0

M
           agnons, the quanta of spinwaves, are central to the                          magnetic field noise detected by the NV ensemble increases with
           development of modern spintronics1. In applied set-                          increasing wavevector until we reach a sharp cutoff at the critical
           tings magnons have been shown to transmit spin                               field for the nonlinear spinwave generation process. We then
angular momentum over large distances2, can be emitted locally                          increase the magnetic field such that all spinwave modes are at
by spin-torque oscillators3, can be used to coherently manipulate                       higher frequency than the NV frequencies, finding that the
defect-based spin qubits4,5, and can form the elements of spin-                         nonlinearly driven NZAFO magnetization still results in NV
based transistors6. Key to the development of magnon applica-                           relaxation. This first demonstration of broadband multi-magnon
tions is the parallel development of magnon sensing techniques                          NV relaxometry is a promising result for high-frequency mag-
which can elucidate the physical phenomena that govern magnon                           netic dynamics sensing with NVs.
generation, propagation, scattering, and relaxation.                                       For clarity, we explicitly define some terms used throughout.
   Quantum spin sensors, in particular the nitrogen-vacancy                             Single magnon NV relaxometry refers to the process of a single
(NV) center defect spin in diamond, are ideal platforms for high                        magnon at the NV frequency whose dipole magnetic field couples
sensitivity nanoscale probing of magnons. NV centers have a                             to and relaxes nearby NV spins. Multi-magnon NV relaxometry
spin-dependent fluorescence intensity and long spin lifetime7–9,                         refers to the process where multiple magnons participate to create
which can be used to sensitively measure magnetic field noise at                         NV-resonant dipole magnetic field noise which relaxes NV spins.
the NV resonance frequency which causes NV spin relaxation.                             Second-order spinwave instability is a nonlinear spinwave gen-
Noise sensing with NVs, also called relaxometry, is a widely                            erating process whereby a ferromagnetic film driven with a suf-
popular technique, which has been used to detect electron-                              ficiently large microwave field near to but not on the uniform
phonon instability in graphene10, spin labels11–16, driven electron                     mode resonance condition will be driven into resonance, resulting
paramagnetic resonance17,18, and ferromagnetic dynamics19–26,                           in pairs of counterpropagating nonzero-~    k spinwaves at the
among others. Early NV relaxometry studies of ferromagnetic                             microwave drive frequency. Four-magnon scattering is a
resonance (FMR) provide a clear picture of the sensing scheme:23                        magnon-magnon scattering process within the ferromagnetic film
microwave drive excites a mode in a ferromagnetic film, the                              which redistributes magnon population from the microwave-
excited mode undergoes incoherent four-magnon scattering                                driven ferromagnetic mode throughout the magnon states.
processes leading to a redistribution of magnon population
throughout the magnon spectrum. This results in an increase in
the number of NV-resonant magnons, which produce dipole                                 Results
magnetic field noise at the NV frequency and increase the                                Our device geometry is shown in Fig. 1a. The 23 nm thick
relaxation rate of nearby NV spins. Thus far, however, NV                               NZAFO (Ni0.65Zn0.35Al0.8Fe1.2O4) film was grown on a MgAl2O4
relaxometry has had an inherent frequency limitation, set by the                        substrate using pulsed laser epitaxy27. A 15-µm wide tapered
few GHz resonance frequency of the NV spin. The measurement                             microstrip antenna composed of Ti(5 nm)/Ag(285 nm)/Au(10
scheme relies on the presence of an NV-resonant magnon mode                             nm) was fabricated on the NZAFO film along the NZAFO 100
which couples to and relaxes the NV spin. For the magnonics                             crystalline axis and was used to excite ferromagnetic dynamics.
community, the frequencies of interest are often higher than NV                         An electromagnet creates an in-plane static magnetic field along
frequencies2, limiting the applicability of NV sensing.                                 the NZAFO 100 crystalline axis and is swept during measure-
   Here we use NV relaxometry to study magnetic noise from                              ment. A powder of roughly 100 nm diameter nanodiamonds with
magnons in a thin film of the insulating magnet nickel zinc                              ~30 parts-per-million NV center concentration was drop-cast on
aluminum ferrite (NZAFO). NZAFO is a low-damping ferri-                                 both the stripline and NZAFO surfaces into a nanodiamond layer
magnetic insulator with large magnetic anisotropy which allows                          a few hundred nm thick. The nanodiamonds are randomly
us to tune the frequency of the uniform FMR mode relative to the                        oriented with respect to the static field. A constant, 532 nm laser
NV resonant frequencies with modest applied magnetic fields.                             at 30 mW power was focused on a few µm wide spot through
Using a nonlinear spinwave generation process we can tune the                           a 20× microscope objective to address the ensemble of NV
microwave-excited spinwave wavevector by controlling the                                spins. Red NV photoluminescence (PL) is collected through the
magnetic field and microwave power applied to the NZAFO.                                 same objective. All measurements presented were taken on the
Varying the driven wavevector up to 3 × 10⁶ m−1, well into the                          nanodiamond powder deposited on the stripline, giving an
exchange magnon spectrum for NZAFO, we find that the                                     NV-NZAFO separation of roughly 300–600 nm. Additional

    a                                          b             ±1                       2B
                                                                                                      c
                                    H                                      1.40 GHz                        MW gen        Mod.
                                                                                                                                refere
                                                              0                                                                       nce
                                                                  Red PL
                                               Green laser

                                                                                                                                              Lockin
                                                                                                            Sample              MW diode
                                  hrf
                                                             ±1                       2B                                                     Lockin
                                                                                                                                Photodiode
                                                                           2.87 GHz
                                                                                                            Laser
                                                              0

Fig. 1 Experimental scheme. a In-plane static magnetic field is applied and swept along the NZAFO thin film 100 crystalline axis. Microwaves from
microstrip antenna drive NZAFO magnetization. Microscope objective focuses continuous green laser onto NV nanodiamond powder and collects red NV
fluorescence. b NV energy diagram. The |ms = 0⟩ state has higher fluorescence intensity than the |ms = ±1⟩ states. Zeeman interaction with the static
magnetic field splits the |ms = ±1⟩ states. For our experiment, the powder of randomly oriented nanodiamonds leads to a distribution of NV frequencies
across the bands indicated in green. c Detection schematic. Amplitude modulated microwaves are applied to the sample, NV fluorescence and microwave
transmission are recorded by lockin amplifiers referenced to this modulation during magnetic field sweeps.

2                  NATURE COMMUNICATIONS | (2020)11:5229 | https://doi.org/10.1038/s41467-020-19121-0 | www.nature.com/naturecommunications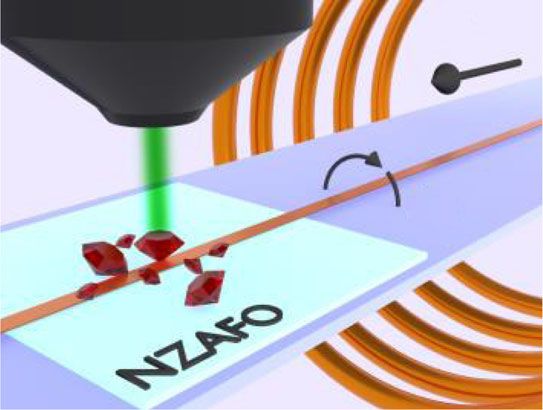
NATURE COMMUNICATIONS | https://doi.org/10.1038/s41467-020-19121-0                                                                      ARTICLE

measurements taken on nanodiamonds deposited directly on                        branch most efficiently excited is ~  kkM ~ 31. As the magnetic field is
NZAFO were qualitatively similar to the results reported here.                  further increased we eventually reach the conventional uniform
   We leverage the optical polarization and spin-dependent PL                   mode FMR excitation of Fig. 2c. Finally, at higher magnetic fields
intensity of NVs to detect magnetic field noise at the NV spin                   there are no spinwave states at ωMW and so no instability occurs.
transition frequencies. The NV center is a spin 1 defect and the                The process given in Fig. 2b is microwave power dependent, and is
ground state is a spin triplet as shown in Fig. 1b. Under laser                 responsible for the evolution of the lineshape of the microwave
excitation the ms = 0 spin state has a higher PL intensity than the             absorption signal as a function of power.
ms = ±1 spin states due to the ms = ±1 having higher probability                   Simultaneously acquired microwave absorption and NV response
of relaxing via a nonradiative pathway back to the ground ms =                  to the NZAFO at 2.2 GHz at +3 dBm microwave power are given
0 spin state. This nonradiative pathway is also responsible for                 in Fig. 3a, b, respectively. At this frequency and range of magnetic
optical polarization of the NV spins to a maximum PL ms =                       fields the microwave frequency is sufficiently far from all NV
0 state under laser illumination. The PL intensity for a constant               resonance frequencies that there is no direct microwave-NV cou-
laser intensity is dependent on the NV transition rates, and thus if            pling. The microwave absorption profile here shows the expected
the relaxation rate of the ms = 0 state increases the PL will                   response during a field sweep at constant frequency as outlined in
decrease, which we can attribute to magnetic field noise at the NV               Fig. 2, with the uniform mode FMR signal at 94 Gauss and an
ms = 0 to ms = ±1 transition frequencies. The ground state NV                   absorption shoulder at a lower magnetic field. The cutoff of the
splitting is 2.87 GHz and the ms = ±1 further split due to a                    absorption shoulder at 65 Gauss corresponds to the critical
Zeeman interaction with static magnetic field applied along the                  microwave field for the instability process, and will produce the
NV axis. Since we use a powder of randomly oriented nanodia-                    largest wavevector spinwave at this microwave frequency and
monds our NV spin frequencies will be determined by the                         power. The NV PL signal shows that the NVs are most strongly
strength of the static field and the distribution of angles between              relaxed at the instability cutoff. The NV response to the driven
the NV axes and the static field. Our measurement technique is                   NZAFO magnetization can be understood using the schematic in
given in the Methods section.                                                   Fig. 3c. At each magnetic field where the NZAFO shows microwave
   At high microwave powers ferromagnetic samples undergo                       absorption a spinwave mode (black circle) will be excited above its
nonlinear response to microwave drive due to the parametric                     thermal occupation level, either a nonzero wavevector mode or the
excitation of nonzero wavevector spinwaves28–30. For our transverse             uniform mode depending on the magnetic field. The four-magnon
pumping geometry, we are able to drive the NZAFO film to a                       scattering process shown in Fig. 3d redistributes the excess popu-
second-order spinwave instability process, called resonance satura-             lation of magnons at the microwave drive frequency throughout
tion. At fields near the uniform mode ferromagnetic resonance                    the magnon spectrum. Four magnon scattering conserves both
(FMR) condition two microwave photons excite two uniform mode                   momentum and energy. A microwave excited magnon (black circle)
magnons at the microwave drive frequency ωMW, which then                        scatters with a thermally occupied magnon (red circle), resulting in
combine and produce two counter-propagating magnons of non-                     two product magnons (purple and yellow circles), some of which
zero wavevector, also at ωMW31. Instability refers to the fact that             may be NV-resonant. An increase in NV-resonant magnon
beyond a certain microwave power threshold the rate of energy loss              population as a result of this four-magnon scattering will result in a
of these parametrically excited nonzero wavevector spinwaves can                change in the NV PL level. Stray dipole magnetic fields from the
be compensated by the energy flow from the microwave drive and                   NV-resonant magnons couple to and relax nearby NV centers. The
the spinwave mode will become excited above thermal levels32.                   relaxation of NVs shifts NV population out of the ms = 0 spin state
   A schematic of the microwave response of our ferrite sample for              which we optically detect as a decrease in the ensemble NV PL.
four different regimes of magnetic field is given in Fig. 2. For                    Varying the microwave power allows us to shift the instability
magnetic fields sufficiently below the uniform mode FMR condi-                    shoulder and therefore the instability-driven spinwave wave-
tion, as in the case of Fig. 2a, microwaves do not efficiently couple            vector. Power dependent microwave absorption and NV relaxa-
to the uniform FMR mode and the microwave power needed to                       tion signals at 2.2 GHz are given in Fig. 3e, f, respectively. We rule
drive the instability will be prohibitively large. As the magnetic field         out temperature increase as a factor in the changing microwave
is increased toward the uniform mode FMR condition, in Fig. 2b,                 absorption and NV relaxation signals in the Supplementary
the microwave power threshold to excite the spinwave instability is             Figs. 1 and 2. In the microwave absorption data the instability
lowered and the resonance saturation process described above will               shoulder shifts toward lower field with increasing power and the
populate nonzero wavevector spinwaves at ωMW. The spinwave                      NV relaxation signal continues to be maximal at the lowest field

                      a       Field too low       b        Spinwave            c       Uniform              d      Field too high
                                                           instability                mode FMR
                                   k                          k                        k                                k
                                                                                                                                M

                                                                                                                                    M
                                                                                                  M
                                                                      M

                                                                                                                                k
                                                                                                       M
                                          M

                                                                          M

                                                                                                                                    k
                                                                                                 k
                                              M

                                                                     k

                                                                                                      k
                                                                          k
                                        k

                                                                                                         MW
                                              k

                       MW                          MW                           MW
                                              k                           k                           k                             k
                                                         MW photons                  MW photons

Fig. 2 Microwave absorption processes during in-plane magnetic field sweep. a When the magnetic field is well below the resonance condition
microwaves do not efficiently couple to the uniform FMR mode and there is no microwave absorption. b When the magnetic field becomes close to the
resonance condition, strong microwave drive can couple to the uniform mode FMR. In this process two microwave photons are absorbed at ωMW, giving
two uniform mode magnons at ωMW with k = 0 (white circles) which then decay to a counterpropagating pair of magnons with the same energy, but
nonzero-k (solid black circles). The microwave intensity threshold for this process is lowest for the ~ ~ spinwave branch. The magnetic field range for
                                                                                                      kkM
which this process occurs is microwave power dependent, resulting in a lineshape change at high microwave powers. c On resonance, the typical
microwave excitation of uniform mode precession occurs. d When the magnetic field exceeds the resonance condition there is no microwave absorption
due to an absence of available magnon states at the microwave drive frequency.

NATURE COMMUNICATIONS | (2020)11:5229 | https://doi.org/10.1038/s41467-020-19121-0 | www.nature.com/naturecommunications                            3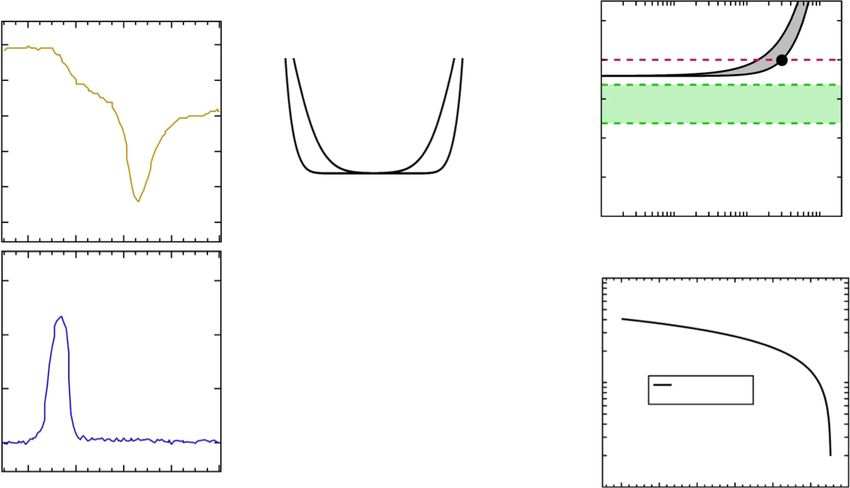
ARTICLE NATURE COMMUNICATIONS | https://doi.org/10.1038/s41467-020-19121-0
a +3 dBm at 2.2 GHz c Single-magnon e g
NV relaxation
M
M
-6 dBm 4
100.0
Frequency (GHz)
k -4 dBm
k
k
(2c)
transmission (%)
-2 dBm 3 fNV
transmission
(2a)
99.8 0 dBm
(2d)
2 fMW
MW
MW
+2 dBm
(2b)
M
+4 dBm
99.6
M
+6 dBm 1
NV +8 dBm Hext = 70 Gauss
k
99.4
k
0
4
10 105 106 107
MW
Wavevector (1/m)
b 0.4 k f
MW photons
0.6 h 107
0.3
Change in
NV PL(%)
d
+8 dBm
Change (%)
wavevector (1/m)
0.4
+6 dBm
0.2 Four-magnon scattering
NV PL
Spinwave
+4 dBm
0.1
Thermal Other product 106 Instability-driven
+2 dBm
spinwave
0.2 NV-resonant
0 dBm
spinwave
0.0
60 80 100 120 0.0 -6 dBm fMW = 2.2 GHz
Driven NV-resonant
Magnetic field (Gauss) 105
50 60 70 80 90 50 60 70 80 90
Magnetic field (Gauss) Magnetic field (Gauss)
Fig. 3 NV detection of spinwave instability in the single-magnon NV relaxation regime. a Microwave absorption during a static magnetic field sweep at
2.2 GHz and +3 dBm microwave power shows a uniform mode FMR absorption signal at 94 Gauss and an absorption shoulder at lower magnetic field,
consistent with the model in Fig. 2. b Simultaneously collected NV relaxation is strongest at the lowest field where the instability is driven and is minimal at
the uniform mode FMR condition. c Out-of-equilibrium magnons driven by the instability (black) scatter off thermally occupied magnons (red), resulting in
product magnons, some of which may be NV-resonant (yellow). An increase in population of NV-resonant magnons increases the dipole field noise at NV
frequencies, leading to a change in NV PL. d The four-magnon scattering process redistributes excess magnon population from the driven mode to higher
frequencies. e Increasing microwave power shifts the instability shoulder detected by microwave absorption toward lower magnetic field. Curves are
vertically shifted from one another for readability. f NV relaxation signal follows the instability shoulder, shifting toward lower magnetic field with
increasing microwave power. g Calculated spinwave manifold (gray) and NV center frequency range (green) at 70 Gauss gives the wavevector of the
2.2 GHz instability-driven magnon (2.8 × 10⁶ m−1, black circle) and the range of wavevectors (2.4 × 10⁶ m−1 to 4.2 × 10⁶ m−1, blue region) responsible for
NV relaxation. h Calculated wavevector of 2.2 GHz instability-driven spinwave and NV-resonant spinwave wavevector range as a function of magnetic field.
for which the instability is driven. The NV relaxation signal the NV response is somewhat different than at 2.2 GHz. From the
increases with increasing driven spinwave wavevector, suggesting calculated spinwave spectrum at the magnetic field of the NV
that the rate of the four-magnon scattering process responsible response peak, 175 Gauss, given in Fig. 4e we can see that there
for populating the NV-resonant magnons increases with are no NV-resonant magnon modes in the film. Therefore the
increasing wavevector of the instability-driven magnon. For each source of NV relaxation cannot be from single NV-resonant
magnetic field of the experiment we calculate the spinwave magnons as is the case at 2.2 GHz. A recent theoretical work by
spectrum and the range of NV ground state frequencies as shown Flebus et al.33. showed that pairs of magnons can produce mag-
in Fig. 3g (see Supplementary Discussion for spinwave spectrum netic field noise at their difference frequency, which can lead to
calculation). From this we can determine the wavevector of the NV relaxation. A rough schematic of this mechanism is given in
~
kkM ~ spinwave excited by the instability and the wavevector
Fig. 4c, where the instability-excited spinwave mode (black circle)
range responsible for NV relaxation. At 70 Gauss the driven still undergoes the four-magnon scattering process in Fig. 4d, but
spinwave has j~ kj = 2.8 × 10⁶ m−1 and the wavevector range of now none of the four-magnon scattering products (purple circles)
spinwaves responsible for NV relaxation is between 2.4 and 4.2 × are themselves NV-resonant. One possibility, as Flebus et al33.
106 m−1, values which are well into the exchange branch of the have proposed, is that pairs of magnons whose frequencies differ
spinwaves in NZAFO as can be seen in Fig. 3g. Performing these by Δ can create magnetic field noise at this difference frequency,
calculations across the range of magnetic fields where the and if Δ = fNV this would lead to NV relaxation. Two propagating
instability can be driven in Fig. 3e, f we can determine the driven spinwaves of frequency difference Δ will modulate the local
and detected spinwave wavevector values for the entire mea-
longitudinal magnetization as they move past a given region of
surement range as given in Fig. 3h. In principle we can source
the film which can result in a stray dipole field component at this
higher microwave power in order to increase the driven and
detected wavevector, however, at 50 Gauss the NZAFO spins are frequency. Calculation of the spinwave spectrum at 4.0 GHz for
no longer saturated along the direction of the magnetic field due the fields measured in our experiment allows us to extract the
to the presence of a cubic anisotropy. instability-excited wavevector for each value of the magnetic field
We then increase the microwave frequency and magnetic field in Fig. 4f.
range in order to lift the spinwave frequencies above the NV spin Finally, we demonstrate the broadband applicability of our
frequencies. Performing the same measurement as before at a technique to measure NV relaxation for both one-magnon and
multi-magnon NV resonant noise in Fig. 5. In each column, we
microwave pump frequency of 4.0 GHz and +18 dBm microwave
plot the microwave absorption and NV response for a given
power we find that the NV is still relaxed by the driven instability nominal input microwave power. In order to remove artefacts
even when there are no NV-resonant spinwave modes available. from the microwave frequency response of our stripline we vary
The microwave absorption in Fig. 4a shows a uniform mode FMR the input microwave power at each frequency in order to main-
field of 206 Gauss and the low-field absorption feature of the tain a constant microwave transmission amplitude, which typi-
instability with a cutoff near 175 Gauss. The NV response in cally means that the listed power is sourced at 4.2 GHz and that at
Fig. 4b is largest at the instability cutoff, though the line shape of lower frequencies the input microwave power is somewhat less in
4 NATURE COMMUNICATIONS | (2020)11:5229 | https://doi.org/10.1038/s41467-020-19121-0 | www.nature.com/naturecommunications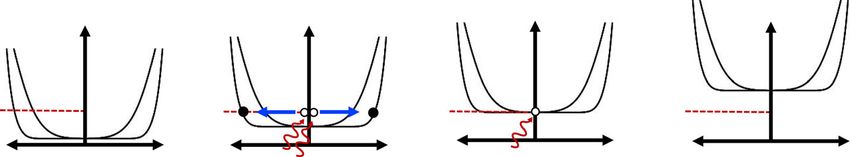
NATURE COMMUNICATIONS | https://doi.org/10.1038/s41467-020-19121-0 ARTICLE
a +18 dBm at 4.0 GHz c Multi-magnon e
5
M
M
NV relaxation
100.0
k
k
4 fMW
Frequency (GHz)
k
99.9
M
transmission (%) 3 fNV
Δ
M
99.8
k
MW
k
2
99.7
MW
1
99.6 NV Hext = 175 Gauss
0
99.5 Δ 104 105 106 107
0 Wavevector (1/m)
b k
0.6 f 10
7
d Four-magnon
0.4
Change in
wavevector (1/m)
NV PL(%)
scattering
Spinwave
Thermal Product
0.2 106 Instability-driven
spinwave
0.0
Driven Product fMW = 4.0 GHz
160 180 200 220 240 105
Magnetic field (Gauss) 150 160 170 180 190 200 210
Magnetic field (Gauss)
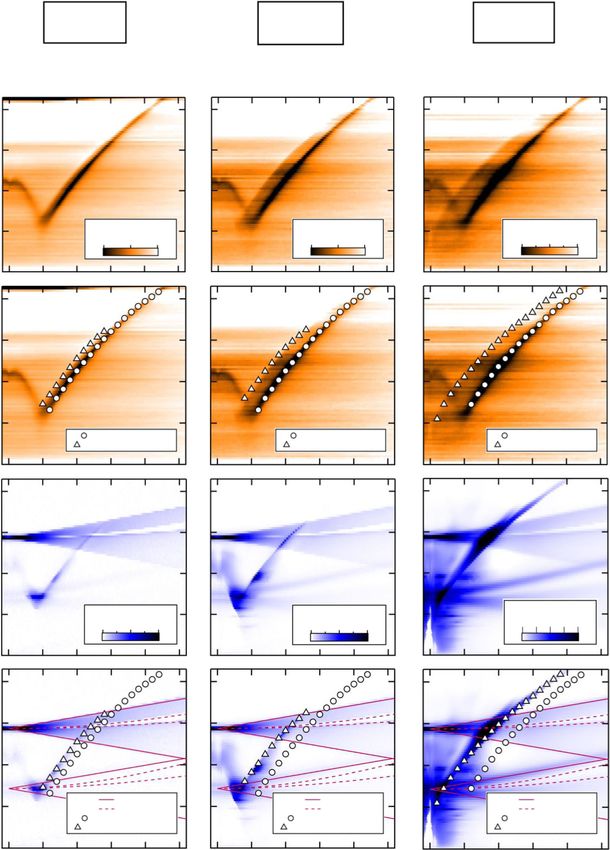
Fig. 4 NV detection of spinwave instability in the multi-magnon NV relaxation regime. a Microwave absorption during a static magnetic field sweep at
4.0 GHz and +18 dBm microwave power shows a uniform mode FMR absorption signal at 206 Gauss and an instability shoulder at lower field. b Simultaneously
collected NV signal shows relaxation only at the lowest field where the instability is excited, and NV relaxation is minimal at the uniform mode FMR condition.
c At these magnetic fields, the minimum of the spinwave manifold is lifted to higher frequency than the NV states, and there are no NV resonant magnons
possible. An increase in NV-resonant magnetic field noise from multiple magnons generated in the four magnon scattering process (d) leads to a change in NV
PL. e Calculated spinwave manifold (gray) and NV center frequency range (green) at 175 Gauss gives the wavevector of the 4.0 GHz instability-driven magnon
(3.2 × 10⁶ m−1, black circle). f Calculated wavevector of 4.0 GHz instability-driven spinwave as a function of magnetic field.
order to maintain flat transmission amplitude across the fre- microwave field. The NV relaxation caused by these driven
quencies probed in the measurement. The input microwave spinwaves can be divided into two regimes; one- and multi-
power vs. frequency can be found in Supplementary Fig. 3. magnon NV relaxometry. In the one-magnon relaxometry regime
Figure 5a–c show the broadband evolution of the microwave the driven spinwave frequency is below the NV frequency. The
absorption-detected spinwave instability and uniform mode FMR driven spinwave undergoes four-magnon scattering resulting in
with increasing microwave power. Figure 5g–i show the broad- an increase in the population of NV-resonant magnons whose
band evolution of the NV relaxation signal with increasing dipole fields couple to and relax the NV spins. In this one-
microwave power. In Fig. 5d–f we plot the microwave absorption magnon relaxometry regime the amplitude of the NV relaxation
data with white circles labeling the microwave absorption- increases monotonically with the wavevector of the instability-
detected uniform mode FMR and with white triangles labeling excited spinwave mode. By varying the microwave drive power
the peak amplitude of the NV relaxation signal. It is clear that for we are able to vary the driven spinwave wavevector up to 3 × 10⁶
all frequencies and fields the NV-ferromagnet coupling is stron- m−1 which is well into the part of the spinwave spectrum
gest at the instability shoulder. As shown in Fig. 5j–l, we are able dominated by the exchange interaction. In the case of multi-
to separate the NV response to the ferromagnetic dynamics from magnon NV relaxometry, the applied field is large enough that all
the NV response to direct microwave absorption by calculating spinwave frequencies are lifted to higher frequency than the NV
the resonance frequencies of NV ground and excited spin states frequencies. In this regime the NVs are relaxed by the driven
oriented both parallel (solid red lines) and perpendicular (dashed spinwave instability despite the absence of individual NV-
red lines) at each field which fit the detected NV spectrum quite resonant magnons, suggesting that multiple magnons are creat-
well. At magnetic fields below 50 Gauss the NZAFO demonstrates ing noise below the ferromagnetic gap which couples to and
a resonant mode between 2.2 and 1.0 GHz which is a result of a relaxes the NV spins.
cubic magnetic anisotropy that has been observed in previous Further study should help to determine if the multi-magnon
studies34 and is of little consequence for our results. Most NV relaxation signal is caused by two-magnon processes or
importantly, we find that for high microwave power we are able higher numbers of magnons producing NV-resonant noise, and
to observe the instability-driven spinwaves at frequencies well in which magnon wavevectors or frequencies are responsible for
excess of the NV ground state transitions in Fig. 5i, l, a clear multi-magnon NV relaxation. Moreover, the two-magnon
demonstration of broadband multi-magnon NV relaxometry. For relaxation process was predicted to occur when the spin chemi-
comparison, we have included the PL spectrum of NV nanodia- cal potential of the system approaches the point of magnon
monds on a non-magnetic substrate in Supplementary Fig. 4. Bose–Einstein condensation (BEC)33. Future work should include
time-resolved studies of the NV relaxation rate like those by
Du et al.19 where it was shown that the NV can be used to directly
Discussion measure the spin chemical potential. Quantifying the NV
We have demonstrated NV detection of spinwaves generated via relaxation rate may also help to quantify how the wavevector of
a nonlinear instability process in which spinwaves of nonzero the instability-excited spinwave influences the four-magnon
wavevector are parametrically driven by a high amplitude scattering rate. Time-resolved Brillouin light spectroscopy (BLS)
NATURE COMMUNICATIONS | (2020)11:5229 | https://doi.org/10.1038/s41467-020-19121-0 | www.nature.com/naturecommunications 5ARTICLE NATURE COMMUNICATIONS | https://doi.org/10.1038/s41467-020-19121-0
MW power MW power MW power
0 dBM +10 dBM +20 dBM
Magnetic field (Gauss) Magnetic field (Gauss) Magnetic field (Gauss)
0 50 100 150 200 250 0 50 100 150 200 250 0 50 100 150 200 250
Microwave frequency (GHz)
Microwave frequency (GHz)
4 4
a b c
3 3
2 2
MW transmission (%) MW transmission (%) MW transmission (%)
1 99.0 99.5 100.0 99.4 99.7 100.0 99.6 99.8 100.0
1
0 0
4 4
Microwave frequency (GHz)
Microwave frequency (GHz)
d e f
3 3
2 2
1 1
Uniform mode FMR Uniform mode FMR Uniform mode FMR
Peak of NV relaxation Peak of NV relaxation Peak of NV relaxation
0 0
4
Microwave frequency (GHz)
4
Microwave frequency (GHz)
g h i
3 3
2 2
Change in NV PL (%) Change in NV PL (%) Change in NV PL (%)
1 0 1 2 3 4
1
0.0 0.4 0.8 0.0 1.0 2.0
0 0
4 4
Microwave frequency (GHz)
Microwave frequency (GHz)
j k l
3 3
2 2
NV H NV H NV H
1 NV⊥H NV⊥H NV⊥H 1
Uniform mode FMR Uniform mode FMR Uniform mode FMR
Peak of NV relaxation Peak of NV relaxation Peak of NV relaxation
0 0
0 50 100 150 200 250 0 50 100 150 200 250 0 50 100 150 200 250
Magnetic field (Gauss) Magnetic field (Gauss) Magnetic field (Gauss)
Fig. 5 Broadband microwave absorption and NV relaxation signals. Field-swept broadband microwave absorption at 0 dBm (a, d), +10 dBm (b, e), and
+20 dBm (c, f). Input microwave amplitude at each frequency tuned to maintain constant microwave transmission amplitude off resonance (see
Supplementary Fig. 3). Instability shoulder visible on the low-field side of the uniform mode FMR in a–c. NV relaxation signal at 0 dBm (g, j), +10 dBm
(h, k), and +20 dbm (i, l) recorded simultaneously to corresponding microwave absorption data. White circles in panels d–f, j–l correspond to the
microwave absorption-detected uniform mode FMR, and white triangles in these panels correspond to the maximum of the NV relaxation signal, showing
that the NV always responds most strongly to the instability. Red lines in panels j–l are the calculated NV frequencies for the ground and excited NV states
as a function of magnetic field for magnetic field oriented parallel to the applied field (solid) and perpendicular (dashed). The low-field ferromagnetic
resonance feature below 50 Gauss arises from the cubic anisotropy field and is not of importance for our main results.
measurements35 may help to elucidate if the NZAFO is driven to imaging could be useful in understanding when nonlinear effects
a magnon BEC for the geometry and microwave powers used in play a role in switching of ferromagnetic samples36,37. Lastly, the
our experiment. The sharp cutoff of the NV signal at the onset of detection of ferromagnetic dynamics at above-NV frequencies
the spinwave instability suggests that NV relaxometry-based should be generally useful for the magnonics community, where
6 NATURE COMMUNICATIONS | (2020)11:5229 | https://doi.org/10.1038/s41467-020-19121-0 | www.nature.com/naturecommunicationsNATURE COMMUNICATIONS | https://doi.org/10.1038/s41467-020-19121-0 ARTICLE
the frequency of interest is often 10 or more GHz. Future work 17. Alfasi, N., Masis, S., Shtempluck, O. & Buks, E. Detection of paramagnetic
should determine if the decrease in the multi-magnon NV defects in diamond using off-resonance excitation of NV centers. Phys. Rev. B
relaxometry signal with increasing microwave frequency and 99, 214111 (2019).
18. Purser, C. M. et al. Broadband electron paramagnetic resonance spectroscopy
magnetic field (Fig. 5i, l) is intrinsic to the multi-magnon in diverse field conditions using optically detected nitrogen-vacancy centers in
relaxometry process or if it is related to experimental constraints, diamond. J. Phys. D Appl. Phys. 52, 305004 (2019).
like the quenching of NV contrast with increasing off-axis mag- 19. Du, C. et al. Control and local measurement of the spin chemical potential in a
netic field38 or decreasing wavevectors of spinwaves participating magnetic insulator. Science 357, 195–198 (2017).
in the multi-magnon noise signal. 20. Labanowski, D. et al. Voltage-driven, local, and efficient excitation of
nitrogen-vacancy centers in diamond. Sci. Adv. 4, eaat6574 (2018).
21. Lee-Wong, E. et al. Nanoscale detection of magnon excitations with variable
Methods wavevectors through a quantum spin sensor. Nano Lett. 20, 3284–3290 (2020).
Lockin detection of NV and microwave absorption response. Our measurement 22. Page, M. R. et al. Optically detected ferromagnetic resonance in diverse
protocol is given in Fig. 1c. Conventional broadband microwave absorption and ferromagnets via nitrogen vacancy centers in diamond. J. Appl. Phys. 126,
NV PL are measured simultaneously as the strength of the static magnetic field is 124902 (2019).
swept and microwaves are applied at a constant frequency. In all, 100% amplitude 23. van der Sar, T., Casola, F., Walsworth, R. & Yacoby, A. Nanometre-scale probing
modulated microwaves pass through the microstrip in transmission, are detected of spin waves using single-electron spins. Nat. Commun. 6, 7886 (2015).
by a microwave diode, and measured at the modulation frequency by a lockin 24. Wolfe, C. S. et al. Off-resonant manipulation of spins in diamond via
amplifier (fmod ~ 1 kHz). The NV PL is detected by a photodiode and both the DC precessing magnetization of a proximal ferromagnet. Phys. Rev. B. 89, 180406
component of the PL is recorded as well as the changes in PL at the microwave (R) (2014).
modulation frequency by a second lockin. The phasing of the NV lockin is set such 25. Wolfe, C. S. et al. Spatially resolved detection of complex ferromagnetic
that a decrease in NV PL gives a positive lockin signal. NV signals are reported as dynamics using optically detected nitrogen-vacancy spins. Appl. Phys. Lett.
percent changes in NV PL by dividing the lockin detected PL by the DC PL in 108, 232409 (2016).
order to remove some of the effects of the quenching of photoluminescence by off- 26. Zhang, H. et al. Spin-torque oscillation in a magnetic insulator probed by a
axis oriented magnetic fields38,39. The microwave absorption signals are reported as single-spin sensor. Phys. Rev. B 102, 024404 (2020).
percent transmission by normalizing with respect to the microwave transmission 27. Emori, S. et al. Coexistence of low damping and strong magnetoelastic
far from ferromagnetic absorption features. The lockin time constant used for all
coupling in epitaxial spinel ferrite thin films. Adv. Mater. 29, 1701130 (2017).
measurements was 100 ms.
28. Bloembergen, N. & Wang, S. Relaxation effects in para- and ferromagnetic
resonance. Phys. Rev. 93, 72–83 (1954).
Data availability 29. Suhl, H. The nonlinear behavior of ferrites at high microwave signal levels.
The data supporting the findings of this study are available from the corresponding Proc. IRE 44, 1270–1284 (1956).
authors upon reasonable request. 30. Suhl, H. Origin and use of instabilities in ferromagnetic resonance. J. Appl.
Phys. 29, 416–421 (1958).
31. Cox, R. G., Patton, C. E., Wittenauer, M. A., Kabos, P. & Chen, L. Spin wave
Received: 11 January 2020; Accepted: 15 September 2020; instability in single crystal Zn–Y hexagonal ferrite at 8.93 GHz. J. Appl. Phys.
89, 4454–4469 (2001).
32. Gurevich, A. G. & Melkov, G. A. Magnetization Oscillations and Waves (CRC
Press, Inc, New York, 1996).
33. Flebus, B. & Tserkovnyak, Y. Quantum-impurity relaxometry of
magnetization dynamics. Phys. Rev. Lett. 121, 187204 (2018).
References 34. Budhani, R. C. et al. Temperature dependent resonant microwave absorption
1. Chumak, A. V., Vasyuchka, V. I., Serga, A. A. & Hillebrands, B. Magnon in perpendicular magnetic anisotropy epitaxial films of a spinel ferrite. J. Appl.
spintronics. Nat. Phys. 11, 453 (2015). Phys. 125, 243903 (2019).
2. Serga, A. A., Chumak, A. V. & Hillebrands, B. YIG magnonics. J. Phys. D Appl. 35. Demokritov, S. O. et al. Bose–Einstein condensation of quasi-equilibrium
Phys. 43, 264002 (2010). magnons at room temperature under pumping. Nature 443, 430–433 (2006).
3. Demidov, V. E., Urazhdin, S. & Demokritov, S. O. Direct observation and 36. Silva, T. J., Kabos, P. & Pufall, M. R. Detection of coherent and incoherent
mapping of spin waves emitted by spin-torque nano-oscillators. Nat. Mater. 9, spin dynamics during the magnetic switching process using vector-resolved
984–988 (2010). nonlinear magneto-optics. Appl. Phys. Lett. 81, 2205–2207 (2002).
4. Andrich, P. et al. Long-range spin wave mediated control of defect qubits in 37. Solyom, A. et al. Probing a spin transfer controlled magnetic nanowire with a
nanodiamonds. npj Quantum Inf. 3, 28 (2017). single nitrogen-vacancy spin in bulk diamond. Nano Lett. 18, 6494–6499 (2018).
5. Kikuchi, D. et al. Long-distance excitation of nitrogen-vacancy centers in 38. Tetienne, J. P. et al. Magnetic-field-dependent photodynamics of single NV
diamond via surface spin waves. Appl. Phys. Express 10, 103004 (2017). defects in diamond: an application to qualitative all-optical magnetic imaging.
6. Chumak, A. V., Serga, A. A. & Hillebrands, B. Magnon transistor for all- N. J. Phys. 14, 103033 (2012).
magnon data processing. Nat. Commun. 5, 4700 (2014). 39. Epstein, R. J., Mendoza, F. M., Kato, Y. K. & Awschalom, D. D. Anisotropic
7. Balasubramanian, G. et al. Ultralong spin coherence time in isotopically interactions of a single spin and dark-spin spectroscopy in diamond. Nat.
engineered diamond. Nat. Mater. 8, 383 (2009). Phys. 1, 94–98 (2005).
8. Casola, F., van der Sar, T. & Yacoby, A. Probing condensed matter physics
with magnetometry based on nitrogen-vacancy centres in diamond. Nat. Rev.
Mater. 3, 17088 (2018). Acknowledgements
9. Schirhagl, R., Chang, K., Loretz, M. & Degen, C. L. Nitrogen-vacancy centers We thank Professor Phil Wigen for helpful discussion of spinwave instabilities. Funding
in diamond: nanoscale sensors for physics and biology. Annu. Rev. Phys. for this research was provided primarily by the Center for Emergent Materials at The
Chem. 65, 83–105 (2014). Ohio State University, a National Science Foundation (NSF) MRSEC through Award No.
10. Andersen, T. I. et al. Electron-phonon instability in graphene revealed by DMR-2011876, with partial support provided by the Air Force Office of Scientific
global and local noise probes. Science 364, 154 (2019). Research (AFOSR) through Grants FA9550-19-1-0307 and FA9550-20RXCOR074. We
11. Kaufmann, S. et al. Detection of atomic spin labels in a lipid bilayer using a single- acknowledge the use of Ohio State Nanosystems Laboratory (NSF DMR-2011876) shared
spin nanodiamond probe. Prceedings Natl Acad. Sci. USA 110, 10894 (2013). facilities for device fabrication.
12. Pelliccione, M., Myers, B. A., Pascal, L. M. A., Das, A. & Bleszynski Jayich, A. C.
Two-dimensional nanoscale imaging of gadolinium spins via scanning probe
relaxometry with a single spin in diamond. Phys. Rev. Appl. 2, 054014 (2014). Author contributions
13. Steinert, S. et al. Magnetic spin imaging under ambient conditions with sub- B.A.M., A.M.T., V.P.B., M.R.P., and P.C.H. conceived the idea of the experiments. B.A.
cellular resolution. Nat. Commun. 4, 1607 (2013). M., A.M.T., A.L.M. and M.R.P. acquired the data. B.A.M. and A.M.T. calculated spin-
14. Sushkov, A. O. et al. All-optical sensing of a single-molecule electron spin. wave spectra and developed the theoretical understanding of the data with assistance
Nano Lett. 14, 6443–6448 (2014). from M.S.W., V.L.S., D.V.P., M.R.P., and P.C.H. B.A.G. grew the ferrite sample. B.A.M.
15. Tetienne, J. P. et al. Spin relaxometry of single nitrogen-vacancy defects in and M.R.P. performed the microstrip antenna lithography. All authors discussed the
diamond nanocrystals for magnetic noise sensing. Phys. Rev. B 87, 235436 (2013). results and participated in writing the paper.
16. Ziem, F. C., Götz, N. S., Zappe, A., Steinert, S. & Wrachtrup, J. Highly
sensitive detection of physiological spins in a microfluidic device. Nano Lett. Competing interests
13, 4093–4098 (2013). The authors declare no competing interests.
NATURE COMMUNICATIONS | (2020)11:5229 | https://doi.org/10.1038/s41467-020-19121-0 | www.nature.com/naturecommunications 7ARTICLE NATURE COMMUNICATIONS | https://doi.org/10.1038/s41467-020-19121-0
Additional information Open Access This article is licensed under a Creative Commons Attri-
Supplementary information is available for this paper at https://doi.org/10.1038/s41467- bution 4.0 International License, which permits use, sharing, adaptation,
020-19121-0. distribution and reproduction in any medium or format, as long as you give appropriate
credit to the original author(s) and the source, provide a link to the Creative Commons
Correspondence and requests for materials should be addressed to B.A.M. or P.C.H. license, and indicate if changes were made. The images or other third party material in this
article are included in the article’s Creative Commons license, unless indicated otherwise in
Peer review information Nature Communications thanks the anonymous reviewer(s) for a credit line to the material. If material is not included in the article’s Creative Commons
their contribution to the peer review of this work. Peer reviewer reports are available. license and your intended use is not permitted by statutory regulation or exceeds the
permitted use, you will need to obtain permission directly from the copyright holder.
Reprints and permission information is available at http://www.nature.com/reprints To view a copy of this license, visit http://creativecommons.org/licenses/by/4.0/.
Publisher’s note Springer Nature remains neutral with regard to jurisdictional claims in
published maps and institutional affiliations. © The Author(s) 2020
8 NATURE COMMUNICATIONS | (2020)11:5229 | https://doi.org/10.1038/s41467-020-19121-0 | www.nature.com/naturecommunicationsYou can also read