FIRST ROUND OF MARINET 2 TIDAL ENERGY ROUND ROBIN TESTS: COMBINED WAVE AND CURRENT TESTS
←
→
Page content transcription
If your browser does not render page correctly, please read the page content below
First round of MaRINET 2 Tidal Energy
         Round Robin Tests: combined wave and
                       current tests
       B. Gaurier, S. Ordonez-Sanchez, J.-V. Facq, G. Germain, C. Johnstone, R. Martinez, I. Santic
                                             and F. Salvatore

   Abstract—This second Round Robin Test program aims                   errors which involve the test environment or the ap-
to establish the influence of the combined wave and current             pliance. In the case of the performance evaluation of
effect on the power capture and performance of a generic                marine energy converters, the test environment may
tidal turbine prototype. In this paper, we present the results
obtained in the first two selected facilities: the IFREMER              refer to facilities involving flume or tow tanks and
wave and current circulating tank and the CNR-INM wave                  the appliance usually refers to the converter and the
towing tank. These facilities were selected on the basis that           instrumentation equipment to measure the variables of
their dimensions along with the rotor diameter of the tur-              interest; e.g. power, loads, etc.
bine translate into low blockage ratio conditions and that                 A Round Robin Test (RRT) can be designed to enable
both facilities can provide the same range of experimental
conditions. The experimental campaigns uses the same set-               a first stage quantification of a facility’s impact on the
up, except from additional equipment to measure flow char-              technology being tested and on the quality of the tests
acteristics. The performance of the turbine is comparable               results. These results are obtained with the same testing
between the tanks, but because some intrinsic differences               program being repeatedly undertaken on the same
in creating wave and current, it may be slightly different for          device model and at a number of test laboratories. As a
the corresponding conditions. The blockage effect and, in
some cases, the velocity disc-integrated averaging need to              consequence, better identification and quantification of
be accounted for a better agreement. The slight remaining               the investigated causal factors can take place. In addi-
differences observed on the power coefficient curves may                tion, such tests can be used to evaluate and improve (if
be related to turbulence and wave-current interactions. A               necessary) the specifications given in the international
deeper analysis is required to process the other parameters             standards: IEC TS 62600-200 to 202 [1]–[3], as explained
in order to better understand this phenomena.
                                                                        in [4] or [5].
   Index Terms—Marine energy, wave and current interac-                    To establish the influence of the test environment on
tions, Round Robin Test, flow measurements, horizontal                  the power capture and performance of a tidal turbine
axis tidal turbine.
                                                                        prototype, a first RRT was undertaken during the FP7
                                                                        MaRINET project [6]. This programme consisted on
                                                                        testing the exact same 0.7 m diameter horizontal axis
                      I. I NTRODUCTION
                                                                        tidal turbine in four facilities: two tow and two flume
               testing is an integral part of the devel-                tanks. The turbine was tested at two flow speeds
P   ROTOTYPE
     opment process for many technologies. Testing at
small scale can be relatively quick and inexpensive,
                                                                        of 0.8 and 1.0 m/s. It was found that the average
                                                                        values of power and thrust obtained from the four
while testing within a controlled environment enables                   testing campaigns had small discrepancies. However,
experiments to be repeated for a range of different                     the signal fluctuations were higher on the data related
parameters. Perhaps one of the main disadvantages                       to the testing facility that provided the largest blockage
associated with experimental research are related to                    ratio (4.8%) and turbulent flows (3%).
the existence of errors which could potentially lead                       A similar analysis was undertaken by [7] where a
to an inadequate interpretation of results. These data                  horizontal axis turbine of 0.8 m was tested at a tow and
variations may be related to random or systematic                       a flume tank. As an addition to the work developed
                                                                        by [6], the comparative tests involved investigations
   The ID number of this paper is 1276 03-06 and the conference         related to the performance of two types of blade mate-
track is TDD. This project has received funding from the European       rials: composite and aluminium. The composite blades
Union’s Horizon 2020 research and innovation programme under
grant agreement No 731084. This project was partly financially          were specifically designed to enable bend and twist
supported by the European Union (FEDER), the French government,         to facilitate load shedding while preserving optimal
IFREMER and the region Hauts-de-France in the framework of the          power output. Similar to the findings presented in [6],
project CPER 2015-2020 MARCO
   B. Gaurier, J.-V. Facq and G. Germain are with the French Research   it was observed that torque and thrust average values
Institute for Exploitation of the Sea (IFREMER), Metocean Labora-       increased slightly when the turbine was operating in
tory, Boulogne-sur-mer, France (e-mail: bgaurier@ifremer.fr).           the flume facility compared to the data obtained at the
   S. Ordonez-Sanchez, C. Johnstone and R. Martinez are with the
Energy Systems Research Unit (ESRU), Department of Mechanical           tow tank.
Engineering, University of Strathclyde, Glasgow, United Kingdom            Understanding the impact that the extreme marine
(e-mail: s.ordonez@strath.ac.uk).                                       environment has on the survivability of tidal energy
   I. Santic and F. Salvatore are with the National Research Council,
Institute of Marine engineering (CNR-INM), Rome, Italy (e-mail:         converters is fundamental for the successful devel-
francesco.salvatore@cnr.it).                                            opment and commercialisation of full scale devices.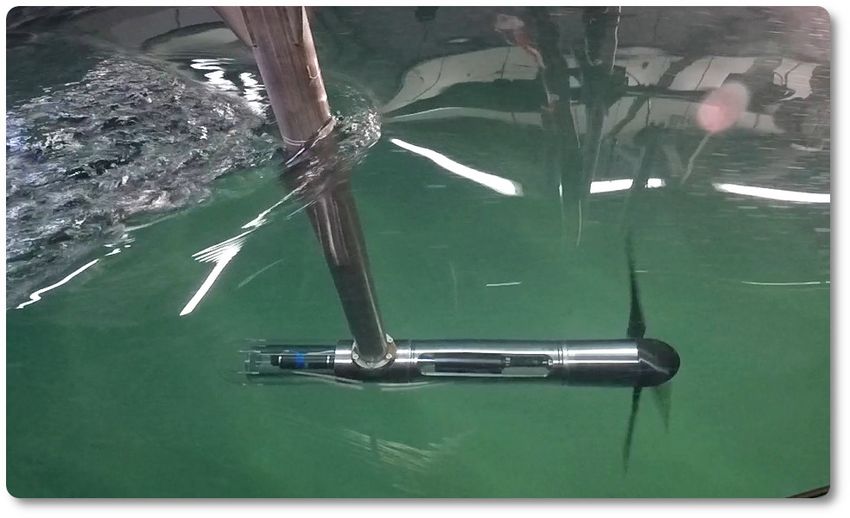
GAURIER et al.: FIRST ROUND OF MARINET 2 TIDAL ENERGY ROUND ROBIN TESTS: COMBINED WAVE AND CURRENT TESTS
Recent efforts from the scientific community to drive
the development of tidal technology forward include
the estimation of wave loading: e.g. [8], [9], [10], [11]
and [12] amongst others, or turbulence effects: e.g. [13],
[14], [15] and [16] amongst others, on tidal energy
devices. These investigations cover a wide range of
topics ranging from the influences of diverse wave-
forms, wave directionality, control strategies, turbulent
flow characteristics and intensities etc.
Building on these work, a second program is being
conducted within the H2020 MaRINET 2 program. The
aim of these tests is to replicate the first RRT but
extend it by incorporating waves and currents in the
testing protocols. An upgraded version of the previous
horizontal axis turbine is used for the entirety of the
programme. Four laboratories are associated within
the working plan and these include the circulating
flume tank at IFREMER, the tow tank facility at CNR-
INM, the Flowave circulating tank at the University of
Edinburgh and the Kelvin hydrodynamics Laboratory
tow tank facility at the University of Strathclyde. The
first sets of results for the first two rounds of the RRT
are presented in this paper.
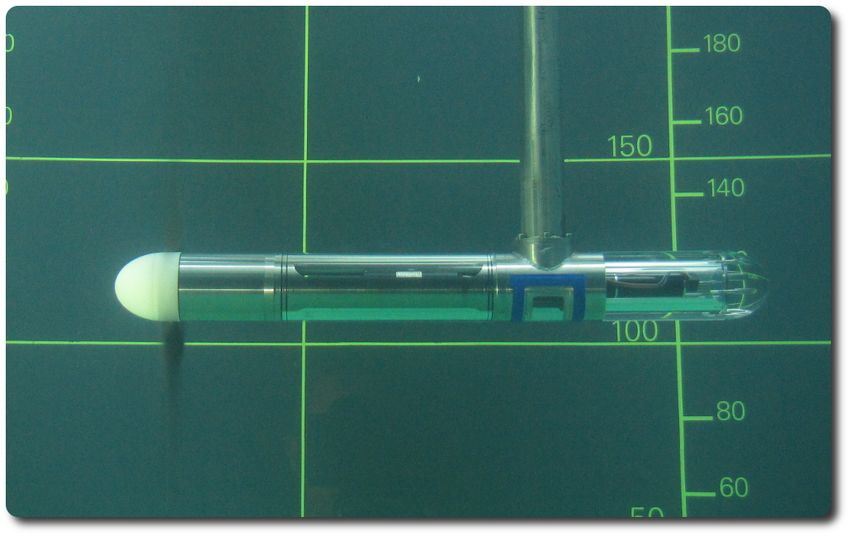
II. E XPERIMENTAL SET- UP Fig. 1. The 3-bladed instrumented turbine in the wave and current
flume tank of IFREMER (top) and in the towing tank of CNR-INM
The first two sets of experiments were carried out at (bottom)
the circulating flume tank available at IFREMER [17]
and the tow tank at CNR-INM [18]. These facilities
blade root 1 torque and thrust
were selected on the basis that their dimensions along ex1 transducer
with the rotor diameter of the turbine translate into ey1
low blockage ratio conditions, as seen in table I. The
turbine axis was kept at a constant depth of 1.0 m in ez1
each facility and a variety of instruments to measure
the flow conditions were mounted in close proximity
to the turbine. Further details of the flow monitoring ey3
are presented in Section II-C.
ez3
TABLE I
ez2
ex3
T ESTING FACILITIES MAIN CHARACTERISTICS ex2
Laboratory name IFREMER CNR-INM
Type of tank flume towing
Length [m] 18 220 blade root 3 ey2 blade root 2
Width × depth [m2 ] 4×2 9 × 3.5
Speed range [m/s] 0.1 to 2.2 0.1 to 10 Fig. 2. The blade root load-cell with its three coordinate systems and
Turbulence int. [%] 1.5 to 15 NA the torque and thrust transducer. All these sensors are waterproof.
Blockage ratio [%] 5.1 1.3
The turbine (shown in Figure 1) was fixed on a mov-
E.g., for blade B1 (figures 2 and 3), the measured forces
ing carriage in the towing tank and on a customised
are the ones along ex1 (blade contribution to thrust)
mounting frame in the flume tank.
and ey1 (blade contribution to torque), and the three
moments around ex1 (edgewise bending moment), ey1
A. Turbine prototype specifications (flapwise bending moment) and ez1 (pitching moment).
A three bladed horizontal axis turbine developed by The same measurements are done on blades B2 and B3
IFREMER is used in this RRT campaign. The turbine with the same components: [Fxi ; Fyi ; Mxi ; Myi ; Mzi ]
is 0.724 m in diameter (D) and a motor speed control with i = 1 to 3 in the corresponding blade coordinate
unit is used to set various turbine rotational speeds. system. For every blade coordinate system, exi is the
The blades are exactly the same as in [6] which were streamwise direction, eyi is opposed to the rotation
designed based on a NACA 63-418 profile. direction and ezi is oriented towards the centre of
The advanced prototype is equipped with a dedi- rotation (figures 2 and 3).
cated load cell in each blade root, following the de- In addition to this multi-component load-cells, the
signed proposed by [19]. The load cell is capable to torque and thrust applied on the main rotation axis
measure 5 different channels: 2 forces and 3 moments. of the rotor are measured as well. This waterproofGAURIER et al.: FIRST ROUND OF MARINET 2 TIDAL ENERGY ROUND ROBIN TESTS: COMBINED WAVE AND CURRENT TESTS
where Q is the mean hydrodynamic torque (in N.m)
θ generated by turbine, obtained from the transducer.
B1
The angular velocity of the turbine is represented by
ω in rad/s. The turbine radius (R) is 0.362 m and
A stands for the rotor swept area (πR2 ). The den-
ex1 sity of the water was considered in these calculations
O1 ey1 as 1000 kg/m3 . Power coefficient (CP ) is presented
flow direction in relation to the Tip Speed Ratio (T SR). This non-
ez1 dimensional value defines the ratio between the blade
B2
tip speed (ω × R) and the tow/flow velocity (U∞ ), as
shown in equation 2. The flow velocity was estimated
B3 using the measurements from two instruments when
possible, as explained in Section II-C.
rotation direction
The second part of the testing includes four regular
waves in-line with the current, as observed in table II.
Fig. 3. Schematic of the turbine facing the flow, with the blade B1
root coordinate system. θ stands for the turbine angle of rotation,
For each of the test cases eleven T SR were considered
with θ = 0 corresponding to the time when blade B1 is vertical at ranging from 0 to 7. To quantify the uncertainty of
the top. the experiment, repeated tests were considered for
each case for several T SR. Due to limitations with
the equipment at CNR-INM, the test matrix was con-
transducer is positioned upstream of the seals of the stricted to only five T SR per case and two T RS for
machine to prevent measuring friction effects (fig- the repeated tests.
ure 2). The blade root load-cell and the torque and
thrust transducer are custom made by the French TABLE II
company Sixaxes [20] in partnership with IFREMER. S UMMARY OF THE TEST MATRIX
The shielded cables coming from these transducers are
Case Type Flow speed Wave Wave
routed through a slip-ring enabling the free rotation of [m/s] freq. [Hz] height [mm]
the cables while prevent their entanglement. These low 1 current 0.8
voltage signals are amplified by an electronic signal 2 regular 0.8 0.6 150
3 regular 0.8 0.5 70
processing unit, located outside of the turbine and on 4 current 1.0
the dry. The signal amplification is not possible inside 5 regular 1.0 0.7 150
the turbine because of the restricted volume. However, 6 regular 1.0 0.6 110
the shielded cables and the the slip-ring quality limit
the noise in the low-voltage analogue signals. The
motor shaft is connected to the turbine shaft through C. Flow measurement and characterisation
a motor-gearbox facilitating the acquisition of suitable The flow stream was characterised while the turbine
torque and rotation speed ratings. was in operation using an Acoustic Doppler Velocime-
All signals are acquired using National Instruments ter (ADV). This was placed in line with the turbine
hardware and in-house electronics developed by IFRE- hub at a distance of 1.2 m along the cross section of the
MER staff. The signals are sampled at a frequency tank (see figure 4). At IFREMER, seeding particles were
(fs ) of 120 Hz. Flow measurements and water surface deposited in the tank and continuous flow circulation
elevation are also utilised and synchronised with the permitted a uniform dispersion in the flow stream.
turbine instrumentations by means of a short impulse For the experiments at CNR-INM, a seeding mast was
trigger signal. placed 4.0 m upfront of the ADV.
In addition to the ADV, the flow was also monitored
using a Laser Doppler Velocimeter (LDV) during the
B. Experimental plan first testing campaign at IFREMER. While the ADV is
The first part of the testing campaign including able to measure three flow velocity components, the
the turbine, comprises tests without wave interactions, LDV available at IFREMER can capture two compo-
thus the flow velocity or carriage velocity is set to nents: u which is related to the flow direction ex and v
0.8 and 1.0 m/s until a full power curve has been the horizontal component related to ey . The LDV was
established with at least ten points to construct the per- installed 2 diameters (D) upstream from the turbine.
formance curves corresponding to the turbine. These The focal point of the laser beam was set to be inline
curves are based on the non dimensional parameters: with the turbine hub, at 1.0 m water depth.
CP − T SR curves which are defined below: A number of wave probes were also placed next
to the turbine to verify the wave parameters set for
Qω each of the case scenarios. Three resistive wave probes
CP = (1)
3
0.5ρAU∞ were used at the facility in IFREMER: probes 1-3 as
seen in figure 4. A mix of resistive, ultrasound and
ωR dynamic wave probes were used in the CNR-INM tow
T SR = (2) tank: probes 3-6 as seen in figure 4, where probes 4
U∞GAURIER et al.: FIRST ROUND OF MARINET 2 TIDAL ENERGY ROUND ROBIN TESTS: COMBINED WAVE AND CURRENT TESTS
ex
x=0
U∞ wave gauge
LDV
1200
ADV
seeding mast 400 ey
1 2 3
650
1448
y=0
I∞
355
5
650
800
4
1200
6
Waves 4030
4000
Fig. 4. Schematic top-view of the test set-up used in the two tanks. ADV was used at IFREMER and CNR-INM. LDV was only used at
IFREMER and carriage speed is only measured at CNR-INM. The seeding mast was required at CNR-INM only. The wave gauges 1 to 3
were used at IFREMER and 3 to 6 at CNR-INM.
and 6 were ultrasound wave gauges and probe 5 was
a dynamic wave gauge. One single identical resistive
wave probe was used in all facilities (probe 3). This is a -0.4
crucial aspect of the test campaign, especially since the
flow characteristics affected by the addition of waves -0.2
is deemed to be relevant between facilities.
III. I NFLOW VELOCITY ANALYSIS
z/D
0.0
Velocity measurement profiles have been performed
in each of the testing facilities recording the flow vari-
ations without the turbine. These profiles are shown 0.2
on figure 5 with three points for CNR-INM at the
left hand-side and fives points for IFREMER at the 0.4
right-hand side, covering the turbine diameter height; case 1
case 2
z/D = 0 stands for the depth of the turbine rotation
axis. The averaged velocity is slightly different between 0.6 0.7 0.8 0.9 0.6 0.7 0.8 0.9
the tanks for case 1: 0.848 m/s for CNR-INM and U [m/s] U [m/s]
0.813 m/s for IFREMER.
Fig. 5. Vertical profile of the time averaged and standard-deviation
Additional points are required at IFREMER flume of the ADV streamwise velocity, versus the depth (z/D) for cases 1
tank especially because the wavemaker is intrusive and 2 at the CNR-INM towing tank (left) and IFREMER flume tank
and located upstream of the turbine area. This mainly (right)
explains the reason why the profile is non-linear for
case 2, with a difference of more than 0.2 m/s in the
averaged velocity between the top and bottom points. amplitude of the Hilbert transform of the u component
The turbulent intensity increases as well because of the of the ADV velocity signal |H(u)|, for case 2 and
wavemaker presence explaining the larger standard- the same points z/D. The large standard-deviation
deviation for the same case. Moreover, in this tank, observed for the IFREMER flume tank indicates a
waves are superimposed to the flow which gener- variation of the amplitude of the waves created in this
ates a real interaction between waves and current. tank. This is mainly caused by the wavemaker presence
Finally, for all the wave and current cases performed at and the turbulence intensity. It is not the same for CNR-
IFREMER flume tank, a velocity average covering the INM tow tank where the standard-deviation stays al-
entire turbine disc is necessary in order to account for ways low. In addition, a slight difference (≤ 0.1m/s)
these phenomena. On the contrary, in the tow tank, in term of averaged velocity amplitude is noticeable
the vertical profiles are identical. Only the standard- between the tanks, for all the points.
deviation increases for case 2 because of the orbital
velocities created by the waves. During an acquisition, the ADV measures the flow
The orbital velocities are quantified on figure 6 show- velocity in synchronisation with the turbine param-
ing the time averaged and standard-deviation of the eters at z/D = 0. Looking at the variation of thisGAURIER et al.: FIRST ROUND OF MARINET 2 TIDAL ENERGY ROUND ROBIN TESTS: COMBINED WAVE AND CURRENT TESTS
the tow tank, but their amplitude vary largely in the
flume tank.
-0.4
90 Case 2
-0.2 80 Case 3
|H(η)| [mm]
70
60
z/D
0.0 50
40
30
0.2
90
0.4 80
|H(η)| [mm]
70
case 2
60
0.0 0.1 0.2 0.3 0.0 0.1 0.2 0.3 50
|H(u)| [m/s] |H(u)| [m/s] 40
30
Fig. 6. Time average and standard-deviation of the amplitude of the
Hilbert transform of the ADV streamwise velocity versus the depth 0 1 2 3 4 5 6 7
(z/D) for case 2 at the CNR-INM towing tank (left) and IFREMER T SR
flume tank (right)
Fig. 8. Time average and standard-deviation of the amplitude of the
Hilbert transform of the free surface elevation η measured by wave
gauge 3 versus the T SR for cases 2 and 3 at CNR-INM towing tank
recorded flow velocity leads to figure 7 for cases 2 (top) and IFREMER flume tank (bottom)
and 3, versus the turbine T SR. Whereas the average
velocity is very close at CNR-INM, a slight difference
is noticeable between cases at IFREMER. The wave
and current interactions in the flume tank can explain 0.20 Case 2
such a difference. As already observed, the standard- Case 3
|H(u)| [m/s]
0.15
deviation which mainly comes from the wave orbital
velocity and turbulence, is higher for the flume tank. 0.10
0.05
0.95 case 2
case 3 0.00
0.90
0.20
U [m/s]
0.85
0.15
|H(u)| [m/s]
0.80
0.10
0.75
0.05
0.95
0.00
0.90 0 1 2 3 4 5 6 7
U [m/s]
T SR
0.85
0.80 Fig. 9. Time average and standard-deviation of the amplitude of
the Hilbert transform of the streamwise velocity versus the T SR for
0.75 cases 2 and 3 at CNR-INM towing tank (top) and IFREMER flume
tank (bottom)
0 1 2 3 4 5 6 7
T SR
As previously observed in figure 6 for case 2, the
Fig. 7. Time average and standard-deviation of the ADV streamwise averaged orbital velocities are larger for the IFRE-
velocity versus turbine T SR for cases 2 and 3 at CNR-INM towing MER flume tank: [0.100; 0.056] m/s for CNR-INM and
tank (top) and IFREMER flume tank (bottom)
[0.136; 0.124] m/s for IFREMER, for cases 2 and 3
Following the same procedure, figures 8 and 9 show respectively (figure 9). These larger values measured
the amplitude of the Hilbert transform of the free in the flume tank can be surprising, especially for case
surface elevation η and of the streamwise velocity u 3. Indeed, the surface elevation is rather close between
respectively, versus the T SR. tanks (figure 8). However, the wave and current inter-
The averaged free surface elevations are very close action and the turbulence can explain such a difference.
between the tanks: [66; 30] mm for CNR-INM and
[73; 34] mm for IFREMER, for cases 2 and 3 respectively Finally, all these differences are mainly related to
(figure 8). However, the standard-deviation is really the intrinsic characteristics of the tanks and may be
different: small values for CNR-INM, but large ones for a source of uncertainty when comparing the perfor-
IFREMER. This indicates the waves are very similar in mance results of a marine turbine.GAURIER et al.: FIRST ROUND OF MARINET 2 TIDAL ENERGY ROUND ROBIN TESTS: COMBINED WAVE AND CURRENT TESTS
IV. P ERFORMANCE COMPARISONS 1.00
In this section, we study the performance results of 0.98
the marine turbine model described in II-A obtained 0.96
0.94
(UT /UF )3
in both tow and flume tanks.
0.92
0.90
D. Power coefficient comparison without wave 0.88
Ifremer flume tank
Considering the flow velocity measured by the ADV 0.86 CNR-INM towing tank
in synchronisation with the turbine parameters in for- 0.84
0 1 2 3 4 5 6 7
mula 1 and 2, we obtain the figure 10 for the CP versus T SR
T SR curves and for current only cases (1 and 4), for
both tanks. Fig. 11. Blockage correction factor (UT /UF )3 versus T SR to be
applied to the power coefficient according to the method presented
0.5 in [21]
0.4
to slight difference for the CNR-INM tank but larger
difference for the IFREMER flume tank: for T SR = 7,
(UT /UF )3 = 0.87 when it was 0.93 in [6].
0.3 Applying these blockage correction factors to the
power coefficients previously shown leads to the fig-
CP
ure 12. The blockage corrections clearly improve the
0.2 curves decreasing the differences between the tanks for
T SR ≥ 4.
0.1
case 1 RO 0.5
case 4 RO
case 1 BL
0.0 case 4 BL
0.4
0 1 2 3 4 5 6 7
T SR
0.3
Fig. 10. Power coefficient CP for cases 1 and 4 (current only) versus
T SR, for CNR-INM (RO) and IFREMER (BL) tanks
CP
0.2
First of all, these results look pretty similar. They are
identical for T SR ≤ 3 but start to spread out from that
point. Despite that the difference between curves stays 0.1
very low, two different groups appear from T SR ≥ 4: case 1 RO
case 4 RO
the first group with the largest values for the IFREMER case 1 BL
flume tank and the second group with the lower values 0.0 case 4 BL
for CNR-INM. Inside each group, CP are slightly larger 0 1 2 3 4 5 6 7
for case 4 comparing to case 1. This last remark can T SR
be explain by the Reynolds effect, as already observed
in [6]. In addition, the difference noticed between the Fig. 12. Power coefficient CP for cases 1 and 4 (current only) versus
T SR, for CNR-INM (RO) and IFREMER (BL) tanks, accounting for
groups, i.e. between the tanks, can be mainly explained the blockage correction factor
by the blockage ratio. Indeed, as seen in table I, al-
though the blockage ratio is small, it is 5 times higher
at IFREMER comparing to CNR-INM. In the previous
paper [6], authors used the method coming from [21] E. Power coefficient comparison with wave
to compensate the difference in term of blockage effect. As seen in section III, the velocity profile in the
Applying the same method on these results leads to the IFREMER flume tank shows a vertical gradient when
blockage correction factor (UT /UF )3 depicted on figure the wavemaker is used. In order to account for this
11 for the power coefficient. gradient perceived by the turbine, a disc-integrated
average is performed from the velocity measurements
These correction factors are slightly different from carried out without the turbine. This corresponds to the
the ones presented in [6]. They are based on the method described in [22]. In addition, for all the cases
relative size of the facility and on the measured thrust with such a vertical gradient, a particular attention is
coefficient. During the previous RRT, the thrust was paid to the processing of the power coefficient: the
not measured on the turbine rotor, but from a load- cubing of the velocity has to be performed prior to
cell based on the top part of the supporting mast. temporal and spatial averaging, as shown by [23].
In order to remove the drag part from the mast, As a consequence, the ADV measurement point car-
authors subtracted the drag measured at T SR = 0 ried out in synchronisation with the turbine parameters
to the one measured at every other T SR. That leads is used as the centre point of a disc with a diameter DGAURIER et al.: FIRST ROUND OF MARINET 2 TIDAL ENERGY ROUND ROBIN TESTS: COMBINED WAVE AND CURRENT TESTS
and showing a vertical gradient profile corresponding 0.5
to the one measured previously without the turbine, as
seen in figure 5 for case 2. Then, the disc-integrated av-
erage is performed. And finally, an equivalent velocity 0.4
is used in formula 1 and 2, based on coefficients C n :
t
d 0.3
n un
C = p (3)
CP
t
un
0.2
where ut stands for the time averaging and up or
d
u stand for centre point or the spatial disc-integrated
averaging respectively. Note that the velocity is pow- 0.1
case 5 RO
ered (n) prior to temporal and spatial averaging. C 1 case 6 RO
is used for the velocity expressed in the T SR formula, case 5 BL
0.0 case 6 BL
whereas C 3 is required for the one corresponding to the
CP formula (the CT formula needs C 2 ). Coefficients C n 0 1 2 3 4 5 6 7
T SR
are given in table III for all the wave and current cases.
Fig. 14. Power coefficient for cases 5 and 6 versus T SR, for CNR-
TABLE III INM (RO) and IFREMER (BL) tanks, accounting for the blockage
C OEFFICIENTS C n USED FOR THE T SR, CT AND CP PROCESSING IN correction factor and the velocity disc-integrated averaging
ORDER ACCOUNT FOR THE VERTICAL VELOCITY GRADIENT FOR
WAVE AND CURRENT CASES AT IFREMER. T HESE COEFFICIENTS
ARE BASED ON THE VELOCITY PROFILES MEASURED WITHOUT THE
TURBINE . On figure 14, the difference is larger between tanks.
The average of the CP is lower for the CNR-INM from
Case C1 C2 C3
T SR ≥ 4. In addition, the standard-deviation is lower
2 0.985 0.975 0.968
3 0.995 0.995 0.997 as well, for the same range of T SR, comparing to
5 0.990 0.983 0.979 the same results at IFREMER. As noticed in section
6 0.981 0.968 0.958 III the standard-deviation of the inflow velocity, the
surface elevation and the orbital velocity are higher is
The results obtained with this processing method,
the flume tank. This could explain the higher standard-
only applied for the IFREMER flume tank data, are
deviation of the power coefficient observed on this
shown on figures 13 and 14 and compared to the CP
curve.
from the CNR-INM tow tank. The blockage correction
In order to better understand the difference on the
factor, explained in the previous section IV-D is applied
power coefficient curves, we propose now to focus on
as well.
a particular point: T SR = 4 for case 6.
0.5
F. A particular wave and current test comparison
0.4 In the following part, a deeper analysis is given on a
particular test acquisition. Figures 15 and 17 show the
input parameters recorded in IFREMER and CNR-INM
0.3 respectively. These parameters are the surface elevation
η from wave gauge 3 and the streamwise velocity u
CP
measured by the ADV. As shown on these figures, η
0.2
and u show larger amplitudes at the IFREMER flume
tank. On the contrary, amplitudes are lower but more
0.1
regular with time at the towing tank. This corresponds
case 2 RO to what has already been observed in section III.
case 3 RO
case 2 BL In the same way, the turbine parameters represented
0.0 case 3 BL by the rotation speed ω, the torque Q and the power
0 1 2 3 4 5 6 7 P are depicted on figures 16 and 18 for the same
T SR period of time and for IFREMER and CNR-INM tanks
respectively. As observed for the input characteristics,
Fig. 13. Power coefficient for cases 2 and 3 versus T SR, for CNR-
INM (RO) and IFREMER (BL) tanks, accounting for the blockage
the turbine parameters are more periodic at the towing
correction factor and the velocity disc-integrated averaging tank, but show higher amplitude of variation at the
flume tank.
These curves are in relatively good agreement, espe-
cially for cases 2 and 3. Indeed, on figure 13, only the The table IV summarizes the time average and
curve obtained for case 3 in the CNR-INM tow tank is standard-deviation values for the parameters dis-
slightly lower from the others. In addition, it is clearly played on figures 15 to 18. It is clear that the av-
noticeable that the corresponding standard-deviation is eraged values obtained for the rotation speed ω are
lower from the others as well. very close between the tanks. Concerning the averagedGAURIER et al.: FIRST ROUND OF MARINET 2 TIDAL ENERGY ROUND ROBIN TESTS: COMBINED WAVE AND CURRENT TESTS
100 100
50 50
η [mm]
η [mm]
0 0
−50 −50
−100 −100
1.3 1.3
1.2 1.2
u [m/s]
u [m/s]
1.1 1.1
1.0 1.0
0.9 0.9
0.8 0.8
75 80 85 90 95 110 115 120 125 130
time [s] time [s]
Fig. 15. Extract of the time history of the input parameters (wave Fig. 17. Extract of the time history of the input parameters (wave
amplitude η and velocity u) recorded at IFREMER flume tank for amplitude η and velocity u) recorded at CNR-INM towing tank for
case 6 and T SR = 4 case 6 and T SR = 4
-10.6 -10.6
-10.8
ω [rad/s]
-10.8
ω [rad/s]
-11.0 -11.0
-11.2 -11.2
-11.4 -11.4
-5 -5
Q [N.m]
Q [N.m]
-10 -10
-15 -15
160 160
140 140
120
P [W ]
120
P [W ]
100 100
80 80
60 60
40 40
75 80 85 90 95 110 115 120 125 130
time [s] time [s]
Fig. 16. Extract of the time history of the turbine parameters (rotation Fig. 18. Extract of the time history of the turbine parameters (rotation
speed ω, torque Q and power P ) recorded at IFREMER flume tank speed ω, torque Q and power P ) recorded at CNR-INM towing tank
for case 6 and T SR = 4 for case 6 and T SR = 4
TABLE IV
T IME AVERAGE AND STANDARD - DEVIATION OF SOME OF THE
velocity u, the difference of about 0.02 m/s (equiv- PARAMETERS MEASURED FOR CASE 6 AND T SR = 4,
alent to 2%) disappears when considering the disc- CORRESPONDING TO FIGURES 15 TO 18
integrated averaging (for the IFREMER value, cf. table
Parameter IFREMER CNR-INM
III): 1.061×0.981 = 1.041 m/s which is very close to the x σ(x) x σ(x)
value measured at CNR-INM (1.037 m/s). However, u [m/s] 1.061 0.120 1.037 0.065
the mean of the torque Q is higher by more than ω [rad/s] -11.029 0.054 -11.032 0.030
Q [N.m] -9.456 2.178 -8.101 1.296
1 N.m (in absolute value) at IFREMER. With a rotation P [W ] 104.320 24.141 89.444 14.353
speed of about 11 rad/s, this difference leads to about
15 W difference in the final power value. Accounting
for the blockage coefficients presented on figure 11, increase may explain this torque difference. Indeed,
a difference of 8 W is still persistent, explaining the comparing figures 13 and 14, when the CP standard-
difference observed on figure 14 for the CP . deviation is equivalent, e.g. for case 2, the CP av-
However, this difference of about 1 N.m noticed erage is similar. However, when the CP standard-
on the averaged torque is lower than the correspond- deviation is lower for CNR-INM, the CP average is
ing standard-deviation value. Except for the rotation lower as well (cases 3, 5 and 6). In addition, as seen
speed, the other standard-deviation values are about previously, the CP standard-deviation mainly comes
twice as high for IFREMER flume tank than for CNR- from the torque standard-deviation, which is strongly
INM. As explained before, the turbulence intensity is linked with the low frequency components of the input
higher for IFREMER flume tank and this turbulence velocity, according to [15]. For these tests, the lowGAURIER et al.: FIRST ROUND OF MARINET 2 TIDAL ENERGY ROUND ROBIN TESTS: COMBINED WAVE AND CURRENT TESTS
frequency components of the velocity mainly come R EFERENCES
from the orbital velocity of the wave, the wave-current
[1] Marine Energy, “Wave, tidal and other water current
interaction and turbulence. So, as a first attempt, the converters - Part 200: Electricity producing tidal energy
turbulence and wave-current interaction at IFREMER converters - Power performance assessment,” International
flume tank seem to be responsible for the increase of Electrotechnical Commission, Tech. Rep. 27.140, 2013. [Online].
Available: https://webstore.iec.ch/publication/7242
the averaged torque. [2] ——, “Wave, tidal and other water current converters - Part
201: Tidal energy resource assessment and characterization,”
International Electrotechnical Commission, Tech. Rep. 27.140,
A deeper analysis of the blade forces and moments 2015. [Online]. Available: https://webstore.iec.ch/publication/
depending on the phase between their respective po- 22099
[3] ——, “Wave, tidal and other water current converters - Part
sitions and the surface waves will enable to better 202: Scale testing of tidal stream energy systems,” International
understand this phenomena. Electrotechnical Commission, Tech. Rep., 2019.
[4] G. Germain, A. Chapeleau, B. Gaurier, L.-M. Macadre, and
P. Scheijground, “Testing of marine energy technologies
against international standards. Where do we stand?” in
V. C ONCLUSION AND PERSPECTIVES Proceedings of the 12th European Wave and Tidal Energy
Conference, Cork, Ireland, 2017. [Online]. Available: http:
//www.ewtec.org/proceedings/
This paper presents the first results obtained into [5] G. Germain, B. Gaurier, M. Harrold, M. Ikhennicheu,
the first two facilities of the tidal MaRINET 2 Round P. Scheijgrond, A. Southall, and M. Träsch, “Protocols
Robin Test. Four laboratories are associated within the for testing marine current energy converters in controlled
conditions. Where are we in 2018?” in Proceedings of the 4th
working plan, but only the flume tank at IFREMER Asian Wave and Tidal Energy Conference, Taipei, Taiwan, 2018.
and the tow tank at CNR-INM have already been used [Online]. Available: http://www.awtec.asia/proceedings/
yet. This new Round Robin Test replicates the previous [6] B. Gaurier, G. Germain, J.-V. Facq, C. Johnstone, A. Grant,
A. Day, E. Nixon, F. Di Felice, and M. Costanzo, “Tidal energy
program, i.e. keeping constant the turbine model and "Round Robin" tests comparisons between towing tank and
testing instruments, but extend it by incorporating circulating tank results,” International Journal of Marine Energy,
waves and currents in the testing protocols. vol. 12, pp. 87 – 109, 2015, special Issue on Marine Renewables
Infrastructure Network. [Online]. Available: http://www.
As observed in the inflow velocity analysis, the sciencedirect.com/science/article/pii/S2214166915000223
hydrodynamic conditions are close between both fa- [7] R. E. Murray, S. Ordonez-Sanchez, K. E. Porter, D. A.
Doman, M. J. Pegg, and C. M. Johnstone, “Towing tank and
cilities. However, several slight differences appear, es- flume testing of passively adaptive composite tidal turbine
pecially in terms of standard-deviation, mainly due to blades,” in Proceedings of the 12th European Wave and Tidal
turbulence and wave-current interaction obtained at Energy Conference, Cork, Ireland, 2017. [Online]. Available:
http://www.ewtec.org/proceedings/
IFREMER flume tank. These differences are related to
[8] B. Gaurier, P. Davies, A. Deuff, and G. Germain, “Flume tank
the intrinsic characteristics of the tanks. characterization of marine current turbine blade behaviour
The power coefficients versus Tip Speed Ratio are under current and wave loading,” Renewable Energy, vol. 59,
pp. 1 – 12, 2013. [Online]. Available: http://www.sciencedirect.
presented for current and wave-current cases and for com/science/article/pii/S0960148113001353
both facilities. These first results are in good agreement [9] P. W. Galloway, L. E. Myers, and A. S. Bahaj, “Quantifying
but need to be corrected, considering the blockage wave and yaw effects on a scale tidal stream turbine,”
Renewable Energy, vol. 63, pp. 297 – 307, 2014. [Online].
effect and the disc-integrated averaging when the ve- Available: http://www.sciencedirect.com/science/article/pii/
locity profile shows a vertical gradient, as in IFREMER S0960148113004977
flume tank with the wavemaker. [10] R. Martinez, G. S. Payne, and T. Bruce, “The effects of
oblique waves and currents on the loadings and performance
Finally, a particular case analysis shows that when a of tidal turbines,” Ocean Engineering, vol. 164, pp. 55 –
difference is noticed on the averaged power coefficient, 64, 2018. [Online]. Available: http://www.sciencedirect.com/
this seems to be only related to a torque difference. science/article/pii/S0029801818309296
[11] S. Ordonez-Sanchez, M. Allmark, K. Porter, R. Ellis, C. Lloyd,
This gap in the measured torque between facilities may I. Santic, T. O’Doherty, and C. Johnstone, “Analysis of a
be linked with the difference observed in the inflow horizontal-axis tidal turbine performance in the presence of
velocity analysis: i.e. the turbulence and wave-current regular and irregular waves using two control strategies,”
Energies, vol. 12, no. 3, 2019. [Online]. Available: http:
interactions. //www.mdpi.com/1996-1073/12/3/367
A deeper analysis is however require to further [12] S. Draycott, G. Payne, J. Steynor, A. Nambiar, B. Sellar, and
explore the variations of the blade forces and moments V. Venugopal, “An experimental investigation into non-linear
wave loading on horizontal axis tidal turbines,” Journal of
obtained for each wave condition at both facilities. This Fluids and Structures, vol. 84, pp. 199 – 217, 2019. [Online].
should enable to better understand this phenomena. Available: http://www.sciencedirect.com/science/article/pii/
In addition, the next tests are planned at Flowave S0889974618305073
[13] J. McNaughton, S. Harper, R. Sinclair, and B. Sellar, “Measuring
(University of Edinburgh) and Kelvin Hydrodynamic and modelling the power curve of a commercial-scale tidal
Laboratory (University of Strathclyde) before the end turbine,” in Proceedings of the 11th European Wave and Tidal
of the year. They will bring new wave-current flow Energy Conference, Nantes, France, 2015. [Online]. Available:
http://www.ewtec.org/proceedings/
conditions and certainly new interesting results. [14] O. Durán Medina, F. G. Schmitt, R. Calif, G. Germain, and
B. Gaurier, “Turbulence analysis and multiscale correlations
between synchronized flow velocity and marine turbine
power production,” Renewable Energy, vol. 112, pp. 314 –
A CKNOWLEDGMENT 327, 2017. [Online]. Available: http://www.sciencedirect.com/
science/article/pii/S0960148117304093
The authors would like to thank Inès Belarbi and [15] B. Gaurier, G. Germain, and G. Pinon, “How to correctly
measure turbulent upstream flow for marine current turbine
Thomas Bacchetti from IFREMER for their assistance performance evaluation?” in Proceedings of the 3rd International
in this experimental work. Conference on Renewable Energies Offshore, Lisbon, Portugal,GAURIER et al.: FIRST ROUND OF MARINET 2 TIDAL ENERGY ROUND ROBIN TESTS: COMBINED WAVE AND CURRENT TESTS
2018. [Online]. Available: http://www.centec.tecnico.ulisboa.
pt/renew2018/
[16] B. Gaurier, M. Ikhennicheu, G. Germain, and J.-V. Facq,
“Experimental effect of the wake of a wide wall-mounted
obstacle on a marine current turbine,” in Proceedings of the
16èmes Journées de l’Hydrodynamique, Marseille, France, 2018.
[Online]. Available: https://jh2018.sciencesconf.org/
[17] B. Gaurier, G. Germain, J.-V. Facq, and T. Bacchetti,
“Wave and current flume tank of Boulogne-sur-
mer. Description of the facility and its equipment.”
IFREMER, Tech. Rep. 19CSMBL18, 2018. [Online]. Available:
https://archimer.ifremer.fr/doc/00470/58163/
[18] Consiglio Nazionale delle Ricerche. (2018) Towing tanks.
[Online]. Available: http://www.insean.cnr.it/en/content/
towing-tanks
[19] G. S. Payne, T. Stallard, and R. Martinez, “Design and
manufacture of a bed supported tidal turbine model for blade
and shaft load measurement in turbulent flow and waves,”
Renewable Energy, vol. 107, pp. 312 – 326, 2017. [Online].
Available: http://www.sciencedirect.com/science/article/pii/
S0960148117300782
[20] Sixaxes. (2017) Société française, spécialisée dans l’étude et la
fabrication de chaîne de mesure de force depuis plus de 22
ans. [Online]. Available: http://www.sixaxes.com/
[21] A. Bahaj, A. Molland, J. Chaplin, and W. Batten, “Power and
thrust measurements of marine current turbines under various
hydrodynamic flow conditions in a cavitation tunnel and a
towing tank,” Renewable Energy, vol. 32, no. 3, pp. 407 –
426, 2007. [Online]. Available: http://www.sciencedirect.com/
science/article/pii/S0960148106000516
[22] P. Mycek, B. Gaurier, G. Germain, G. Pinon, and E. Rivoalen,
“Experimental study of the turbulence intensity effects on
marine current turbines behaviour. Part I: One single turbine,”
Renewable Energy, vol. 66, pp. 729 – 746, 2014. [Online].
Available: http://www.sciencedirect.com/science/article/pii/
S096014811400007X
[23] T. Blackmore, L. E. Myers, and A. S. Bahaj, “Effects of
turbulence on tidal turbines: Implications to performance,
blade loads, and condition monitoring,” International Journal
of Marine Energy, vol. 14, pp. 1 – 26, 2016. [Online].
Available: http://www.sciencedirect.com/science/article/pii/
S2214166916300297You can also read