Reference equations for tidal breathing parameters using structured light plethysmography
←
→
Page content transcription
If your browser does not render page correctly, please read the page content below
ORIGINAL ARTICLE
                                                                                                                               LUNG FUNCTION

                                  Reference equations for tidal breathing
                                  parameters using structured light
                                  plethysmography
                                  Shayan Motamedi-Fakhr1, Richard Iles2, Nicki Barker3, John Alexander4 and
                                  Brendan G. Cooper 5

                                  Affiliations: 1PneumaCare Limited, Cambridge, UK. 2Respiratory Paediatrics, Evelina Children’s Hospital,
                                  London, UK. 3Respiratory Medicine, Sheffield Children’s NHS Foundation Trust, Sheffield, UK. 4Paediatric
                                  Intensive Care, University Hospitals of North Midlands, Stoke-on-Trent, UK. 5Lung Function and Sleep, Queen
                                  Elizabeth Hospital, Birmingham, UK.

                                  Correspondence: Shayan Motamedi-Fakhr, PneumaCare Limited, BCS Windsor House, Great Shelford,
                                  Cambridge, UK. E-mail: Motamedi_Shayan@yahoo.com

                                  ABSTRACT Tidal breathing measurements can be used to identify changes in respiratory status.
                                  Structured light plethysmography (SLP) is a non-contact tidal breathing measurement technique. Lack of
                                  reference equations for SLP parameters makes clinical decision-making difficult. We have developed a set
                                  of growth-adjusted reference equations for seven clinically pertinent parameters of respiratory rate ( fR),
                                  inspiratory time (tI), expiratory time (tE), duty cycle (tI/total breath time), phase (thoraco-abdominal
                                  asynchrony (TAA)), relative thoracic contribution (RTC) and tidal inspiratory/expiratory flow at 50%
                                  volume (IE50).
                                     Reference equations were developed based on a cohort of 198 seated healthy subjects (age 2–75 years,
                                  height 82–194 cm, 108 males). We adopted the same methodological approach as the Global Lung
                                  Function Initiative (GLI) report on spirometric reference equations. 5 min of tidal breathing was recorded
                                  per subject. Parameters were summarised with their medians. The supplementary material provided is an
                                  integral part of this work and a reference range calculator is provided therein.
                                     We found predicted fR to decrease with age and height rapidly in the first 20 years and slowly thereafter.
                                  Expected tI, tE and RTC followed the opposite trend. RTC was 6.7% higher in females. Duty cycle
                                  increased with age, peaked at 13 years and decreased thereafter. TAA was high and variable in early life
                                  and declined rapidly with age. Predicted IE50 was constant, as it did not correlate with growth.
                                     These reference ranges for seven key measures ensure that clinicians and researchers can identify tidal
                                  breathing patterns in disease and better understand and interpret SLP and tidal breathing data.

                                        @ERSpublications
                                        A set of reference equations for seven key tidal breathing parameters measured using structured
                                        light plethysmography (SLP) to help clinicians better understand and interpret SLP data and the
                                        value of tidal breathing patterns https://bit.ly/2Og2H3h

                                        Cite this article as: Motamedi-Fakhr S, Iles R, Barker N, et al. Reference equations for tidal
                                        breathing parameters using structured light plethysmography. ERJ Open Res 2021; 7: 00050-2021
                                        [https://doi.org/10.1183/23120541.00050-2021].

                                  This article has supplementary material available from openres.ersjournals.com
                                  Received: 22 Jan 2021 | Accepted: 25 Feb 2021
                                  Copyright ©The authors 2021. This version is distributed under the terms of the Creative Commons Attribution Non-
                                  Commercial Licence 4.0. For commercial reproduction rights and permissions contact permissions@ersnet.org

https://doi.org/10.1183/23120541.00050-2021                                                                        ERJ Open Res 2021; 7: 00050-2021
LUNG FUNCTION | S. MOTAMEDI-FAKHR ET AL.
Introduction
While spirometry is the cornerstone of traditional lung function assessment, it is not always possible to
obtain reliable spirometry in patients who cannot perform the forced manoeuvres. In addition, there is
evidence that respiratory viruses can be transmitted in aerosols generated by asymptomatic individuals [1],
especially during the forced manoeuvres of lung function tests [2]. Measurement of tidal breathing
patterns is easier to perform, provides a complementary method to traditional lung function and breathing
assessment in children and adults [3, 4] and minimises cross-infection risk.
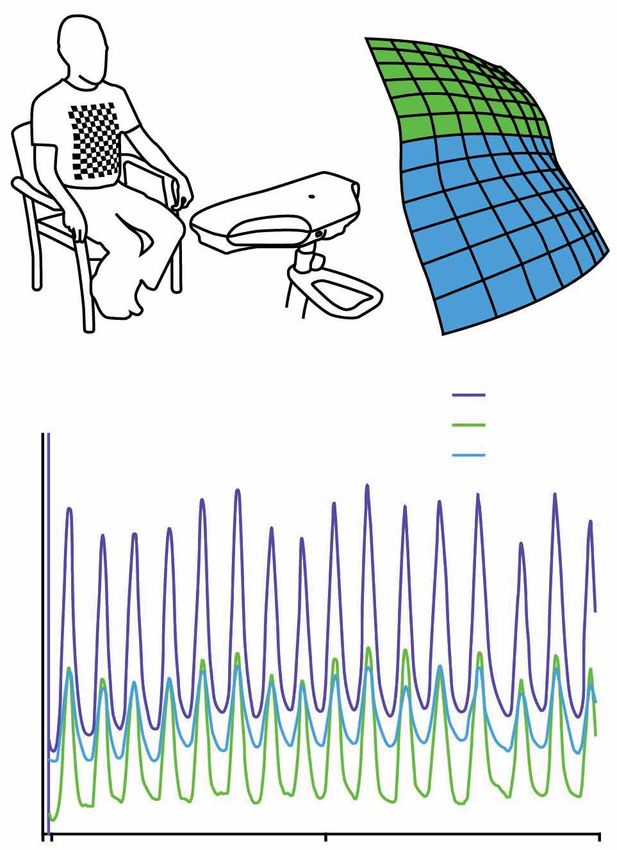
Structured light plethysmography (SLP) is an established technique for non-contact measurement of
respiratory motion [5–11]. A checkerboard pattern of light is projected onto the subject’s
thoraco-abdominal wall. Using two precisely angled cameras the three-dimensional coordinates of each
intersection point on the checkerboard is determined and tracked over time. Displacement on the axis
perpendicular to the surface of the thoraco-abdominal wall can be spatially averaged over different regions
(compartments; e.g. chest and/or abdomen) to generate one-dimensional compartment-specific time-series
(figure 1). It is worth noting that some of the parameters studied here have been previously validated
against tidal breathing data measured using a spirometer [5].
The pattern of tidal breathing can be derived from the displacement of the thoraco-abdominal wall and a
number of tidal breathing parameters can be calculated from this pattern. We report seven key tidal
breathing parameters measured using SLP: respiratory rate (fR), inspiratory time (tI), expiratory time (tE),
duty cycle (tI/ttot), thoraco-abdominal asynchrony (TAA), relative thoracic contribution (RTC) and tidal
inspiratory/expiratory flow at 50% of tidal volume (IE50; also a surrogate measure of airway obstruction [6]).
The calculation of IE50 is not based on absolute flow and volume measurements; rather, it is derived from
the movement of the thoraco-abdominal wall (analogous to volume) and the first derivative of
thoraco-abdominal wall movement (analogous to flow).
We provide a set of growth-adjusted reference equations for these parameters. They were selected as they
had shown clinical utility. Supplementary table 1 lists these parameters, their definitions and their clinical
utility. These are the first reference data of this kind, and the authors anticipate that it will aid clinicians
3D reconstruction
Full body
Chest
Abdomen
Thoraco-abdominal displacement
FIGURE 1 Working principle of
structured light plethysmography.
The green trace corresponds to the
thoracic movement, the blue trace
shows the abdominal movement
and the purple trace is the
summation of blue and green
120 150 180
traces, reflecting the movement of
the entire thoraco-abdominal wall. Time s
https://doi.org/10.1183/23120541.00050-2021 2LUNG FUNCTION | S. MOTAMEDI-FAKHR ET AL.
and researchers to better quantify, understand and interpret SLP data and tidal breathing patterns. The
supplementary material provided is an integral part of this study and it is highly recommended that
readers who seek further detail consult it as they go through the study.
Materials and methods
Data
SLP data from clinical and research measurements collected from multiple sites (Queen Elizabeth (QE)
Hospital, Birmingham, UK; Addenbrooke’s Hospital, Cambridge University Hospitals NHS Foundation
Trust, Cambridge, UK; University Hospital North Midlands (UHNM), Stoke-on-Trent, UK) were collated
retrospectively. Data collected from QE were control data for an α1-antitrypsin deficiency study [12]. Data
from Addenbrooke’s Hospital were a mix of data for healthy and unhealthy subjects recruited for
validation of SLP. Data from UHNM were control cohorts of two asthma studies [6, 7]. All studies had
been approved by their respective ethics committees and we obtained informed consent prior to data
acquisition.
SLP data were captured using Thora-3Di (PneumaCare Limited, Cambridge, UK). Inclusion criteria were
subjects with no history of respiratory disease, who had 5 min of SLP capture in seated position and had a
body mass indexLUNG FUNCTION | S. MOTAMEDI-FAKHR ET AL.
The model for each parameter and its considerations are detailed in the supplementary material (equations
section).
Results
An SLP normative value calculator Excel spreadsheet was developed to facilitate calculation of reference
ranges for the studied parameters. The calculator is colour coded to simulate a “traffic light” approach. In
addition, it is possible to manually input observed values for each parameter and automatically obtain
their corresponding z-scores. The calculator spreadsheet is available in the supplementary material. In the
following section, the growth-related trend for each parameter is depicted. The black line shows the
expected or predicted value, the blue line is the upper limit of normal (ULN), and the green line is the
lower limit of normal (LLN). The probability of observing a value lower than the LLN or higher than the
ULN is 2.5%.
Respiratory rate
Figure 2 shows growth-related change in median fR. Height entries are estimated rather than observed (see
the visual representation of the reference equations section in the supplementary material for more
information); the graph provides only an approximate guidance on the overall trend; for actual values use
the normative value calculator spreadsheet.
Inspiratory time
Figure 3 depicts the growth-related changes in median tI. tI increases rapidly during early life and up to
age ∼20 years (where the slope falls to 0.1), and almost linearly thereafter. Height entries are estimated
and therefore the graph only provides guidance on the overall trend.
Expiratory time
The model for tE depends only on age; therefore, figure 4 accurately depicts the age-related changes in
median tE.
Duty cycle
tI/ttot increases during early life, peaks at age 13 years, and decreases gradually thereafter. tI/ttot is
dependent on both age and height, and therefore figure 5 provides approximate guidance on the overall
trend.
Relative thoracic contribution
Figure 6 shows the age-related changes for RTC for males and females separately. RTC increases with age
and is ∼6.7% higher in females across all ages. Figure 6 can be used directly for interpretation, as the
model does not depend on height.
3.5
Expected value
LLN
ULN
3.0
2.5
Median tI s
2.0
1.5
1.0
FIGURE 3 Growth-related change in 0.5
median inspiratory time (tI). LLN:
lower limit of normal; ULN: upper 0 20 40 60 80
limit of normal. Age years
https://doi.org/10.1183/23120541.00050-2021 4LUNG FUNCTION | S. MOTAMEDI-FAKHR ET AL.
5
Expected value
LLN
ULN
4
Median tE s
3
2
1
FIGURE 4 Growth-related change in
median expiratory time (tE). LLN:
lower limit of normal; ULN: upper 0 20 40 60 80
limit of normal. Age years
Thoraco-abdominal asynchrony
TAA was modelled with age only, and as such figure 7 can be used directly for interpretation. TAA is high
and variable during early life and decreases considerably in both magnitude and variability with age.
IE50
Given the current sample size, IE50 does not appear to significantly correlate with age, height or sex.
Therefore, the expected value and the upper and lower limits of normal are constant. Figure 8 provides a
visual clarification of this.
Discussion
This study provides, for the first time, a preliminary set of normative (reference) equations for seven tidal
breathing parameters of respiratory rate ( fR), inspiratory time (tI), expiratory time (tE), duty cycle,
thoraco-abdominal asynchrony (TAA), relative thoracic contribution (RTC) and IE50 measured using SLP.
Here, we discuss our findings regarding each parameter in relation to the existing body of literature.
0.55
Expected value
LLN
ULN
0.50
Median tI/ttot
0.45
0.40
0.35
FIGURE 5 Growth-related change in
median duty cycle (tI/ttot). LLN: 0.30
lower limit of normal; ULN: upper
limit of normal; tI: inspiratory time; 0 20 40 60 80
ttot: total breath time. Age years
https://doi.org/10.1183/23120541.00050-2021 5LUNG FUNCTION | S. MOTAMEDI-FAKHR ET AL.
100
80
Median RTC %
60
40
20
Male expected value Female expected value
FIGURE 6 Growth-related change in Male LLN Female LLN
median relative thoracic contribution 0 Male ULN Female ULN
(RTC) in males and females. LLN:
lower limit of normal; ULN: upper 0 20 40 60 80
limit of normal. Age years
Respiratory rate
Normative equations or reference ranges for fR have been covered in the literature for infants [17] and
children aged ⩽3 years by GAGLIARDI and RUSCONI [18]. They used body weight as the sole predictor of
respiratory rate in 635 infants and children weighing 14–20 kg. These data are similar, with fR ranging
from 18 to 35 breaths·min−1 ( judging from the scatterplot in figure 2 therein) and between 18 and
32 breaths·min−1 in our study.
For children aged 4–16 years WALLIS et al. [19] provide a set of normative equations based on direct
measurement of fR by observing the movement of the chest in 1109 healthy resting children in a seated
position. The reported ULN and LLN (i.e. upper and lower 2.5%) are narrower than in our study.
Furthermore, our expected values and trend of changing fR with age agrees with a review article providing
reference equation for fR in the first 18 years of life. FLEMING et al. [20] reported a rapid reduction in fR
and its variability, most pronounced during early life, particularly in those aged 2–3 years.
In adults, the norm seems to be a constant 12–20 breaths·min−1 range for fR [21]. Looking at the entire
age range, our results suggest a more rapid decline in approximately the first 20 years of life and a small
linear reduction thereafter. The reported expected values for adults are well within the suggested range,
potentially indicating agreement.
80
Expected value
LLN
ULN
60
Median TAA °
40
20
FIGURE 7 Growth-related change in 0
median thoraco-abdominal asyn-
chrony (TAA). LLN: lower limit of 0 20 40 60 80
normal; ULN: upper limit of normal. Age years
https://doi.org/10.1183/23120541.00050-2021 6LUNG FUNCTION | S. MOTAMEDI-FAKHR ET AL.
Expected value
2.0 LLN
ULN
1.8
Median IE50
1.6
1.4
1.2
FIGURE 8 Tidal inspiratory/
expiratory flow at 50% volume
(IE50) does not correlate with age, 1.0
height or sex. Expected value, LLN
and ULN were 1.29, 0.96 and 1.88,
respectively. LLN: lower limit of
normal; ULN: upper limit of 0 20 40 60 80
normal. Age years
Inspiratory time, expiratory time and duty cycle
Normative values or reference equations are not well established for tI and tE during quiet tidal breathing.
Most studies pertain to mechanical ventilation. However, indications of what might constitute a normal tI
and tI/ttot do exist. TOBIN et al. [22] reported a normal tI of 1.6±0.3 s in young healthy subjects (aged
20–50 years, n=47) and 1.67±0.35 s in older healthy subjects (aged 60–81 years, n=18). Note that the
reported values are mean±SD measured in the supine position. The average age for the young and old
cohorts were 29 and 69 years, respectively. Using our equation to calculate tI by substituting 29 years for
age and the predicted height from our data (≈174 cm), the predicted value was 1.54 s. For a 69-year-old
with an estimated height of ∼170 cm, the predicted tI was 1.59 s. This is a crude comparison, and the
discrepancies can be attributed to different measurement devices (SLP versus respiratory inductance
plethysmography (RIP)), subject position (seated versus supine), summary statistic (median versus mean)
and possibly to a different demographic. However, the trend and the difference between old and young
cohorts is confirmed in our data. We found that tI increases with age and height up to ∼20 years of life
and more slowly thereafter.
tE is similar to tI. There are few published studies looking at normative tE in tidal breathing in healthy
subjects. Those published do not overlap with the age range investigated in this study. In short, our results
suggest that tE increases more rapidly during the first 20 years of life and gradually (linearly) thereafter.
Duty cycle (tI/ttot) has also been primarily used in relation to mechanical ventilation [23]. We have
observed an increase in duty cycle in children up to 13 years and a gradual decrease with age thereafter.
PARREIRA et al. [24] measured tI/ttot in 104 healthy subjects in the supine position using calibrated RIP
bands. They reported a significant difference between males and females in the younger cohort (aged
20–39 years), but not in the other age bands. In our equation for tI/ttot, sex has not been identified as a
determining factor (tI/ttot was predicted by age and height only). Using optoelectronic plethysmography
(OEP) with 83 healthy adult subjects, MENDES et al. [25] reported that tI/ttot did not change with posture
or sex, which confirms our finding. Furthermore, actual values reported for expected tI/ttot in healthy
adults are broadly similar to ours, with TOBIN et al. [22] and PARREIRA et al. [24] reporting an average tI/ttot
of approximately 0.42±0.03 and 0.39±0.04, respectively. WILKENS et al. [26] reported an average duty cycle
of 0.37 in 10 healthy adults at rest using OEP. This appears to be lower than our estimated expected value
for similar age and height, although this difference might be explained by the small sample size (10 versus
198) and use of an alternative summary statsitic (mean versus median). There are no published normative
values of tI/ttot for children, and therefore our study provides these unique data.
Thoraco-abdominal asynchrony
Phase-angle or thoraco-abdominal asynchrony has been used to assess respiratory function in children [6,
7, 27] and adults [8, 28]. Based on our data, TAA is high and variable during early life and reduces in
both magnitude and variability with age. MAYER et al. [29] report an average TAA of 15.7° in a cohort of
50 young children (aged 3–5 years) in the seated position. This agrees with our results, as does the
apparent trend of decreasing TAA with age (see figure 7 in [29]). PARREIRA et al. [24] report phase angle in
https://doi.org/10.1183/23120541.00050-2021 7LUNG FUNCTION | S. MOTAMEDI-FAKHR ET AL.
adults, but the reported values are considerably higher than ours (approximately 5° versus 13°). This is
probably due to the difference in position of subjects (supine versus seated). A higher TAA in the supine
position compared to seated is shown in MAYER et al. [29]. TAA in healthy subjects in a seated position is
reported elsewhere [28, 30]. The number of healthy subjects is low (n=10 and n=9 at rest, respectively),
and the method for calculation of phase differs slightly from what has been used herein. The reported
values for phase in these studies can take either a negative or positive number, whereas in our study TAA
is an absolute measure of asynchrony (a non-negative number) [27]. Looking at the absolute values of the
reported TAA in healthy subjects at rest, we see a rough agreement with our results (low TAA in adult
subjects, generally ∼5° and not exceeding 10°).
Relative thoracic contribution
RTC characterises the spatial dynamics of the thoraco-abdominal motion. This parameter has been studied
in monitoring of several patient groups: post-thoracic surgery [31], neuromuscular disease [9],
dysfunctional breathing [32], COPD [33] and in weaning patients from mechanical ventilators [34]. In our
study, we have found that RTC increases with age and is ∼6.7% higher in females than in males across all
ages included in the study. Our results partially fit with the account of ribcage contribution when it comes
to females having a higher ribcage contribution [25], but differs in the reported trend of decreasing
ribcage contribution with age in adult subjects, seen in that and other studies [25, 35]. In infants and very
young children, the trend seems to be the opposite, with RTC increasing with age [36]. A comparison
between reported values for RTC in children [37] and adults [25] also indicates that ribcage contribution
may increase from childhood to adulthood, and that is where we have seen the most pronounced increase
in our study. Reported values for ribcage contribution seem to be inconsistent [25, 37, 38], but most
studies agree that RTC is higher in females and that ribcage contribution decreases with age in healthy
seated adults. We speculate that this discrepancy may be due to inclusion of both children and adults in
determining the reference equation. Additionally, our study has the largest sample size in comparison to
the aformentioned studies, which may carry with it deeper insight.
IE50
IE50 is as defined by KAPLAN et al. [39] and is not studied as extensively as some of the other tidal
breathing parameters; as such, published normative values or reference equations for IE50 are currently
unknown. As a surrogate measure of airway obstruction [6] it quantifies the effective shape of tidal
breathing flow/volume loop at the middle point (tidal volume=50%). IE50 was not found to correlate with
age, sex or height in our study; therefore, its expected value (1.29) and upper and lower limits of normal
(0.96 and 1.88, respectively) remained constant across the population.
Limitations
The sample size could be criticised for a normative value study. However, it should be emphasised that
SLP is still novel, and as such a large volume of data are yet to be collected. Interest in SLP is growing, and
new data will augment the datasets presented. Although a sample size of 198 is not representative of an
entire population, distribution analysis of the parameters allowed accurate modelling of the predictive
equations. Our recent small-scale clinical validation of the developed reference equations confirms this and
shows promise [40]. More information on the validation study can also be found in the final section of the
supplementary material. This is an extremely valuable starting point for interpretation of breathing pattern
data as evidenced in the discussion, as well as for SLP.
Another shortcoming of the study was in recruitment of healthy subjects, which was based on having no
history of a respiratory disease. It would have been ideal to have basic spirometry and smoking history
available. In addition, since ethnicity data were not recorded, reference equations were not adjusted for
ethnicity.
Conclusion
We have provided a set of growth-adjusted reference equations for seven tidal breathing parameters
measured using SLP. Expected normative values for fR, tI, tI/ttot and TAA agree well with previous studies.
RTC in females was higher than in males, which is in line with the existing literature. However, the
increasing trend of adult RTC with age in our study contradicts the commonly reported reduction with
age. We suspect this is due to inclusion of both children and adult subjects in our models. Expected values
for normal RTC as a whole remain inconsistent in the literature.
We have unique normative values for tE and IE50. These equations may facilitate further use of these
parameters in future research and clinical necessity.
https://doi.org/10.1183/23120541.00050-2021 8LUNG FUNCTION | S. MOTAMEDI-FAKHR ET AL.
A reference range calculator (an Excel spreadsheet) is provided in the supplementary material which
should help clinicians and researchers better interpret SLP data and tidal breathing in general. This may
be of particular benefit given the coronavirus disease 2019 pandemic, since tidal breathing may be an
alternative, non-aerosol-generating procedure for lung function assessment.
Acknowledgement: We sincerely thank Sanja Stanojevic (The Hospital for Sick Children, University of Toronto,
Toronto, ON, Canada) for her invaluable input on using GAMLSS and guidance on developing reference equations. We
are grateful to Hamzah Hmeidi, Amna Khalid, Jenny Conlon and Angelique Laubscher (PneumaCare Limited,
Cambridge, UK) and James Stockley and Liam O’Reilly (University Hospitals Birmingham NHS Foundation Trust,
Birmingham, UK) for the collection of high-quality data that was donated to this reference cohort, and of course we
remain indebted to all participants in the measurement collection.
Conflict of interest: S. Motamedi-Fakhr is a full-time employee of PneumaCare Limited. R. Iles is a past employee,
founder and shareholder of PneumaCare. N. Barker has nothing to disclose. J. Alexander has nothing to disclose.
B.G. Cooper reports that his department has had the free loan of Thora 3 Di device from Pneumacare for the past
5 years as it has developed clinical use of the device.
References
1 Anderson EL, Turnham P, Griffin JR, et al. Consideration of the aerosol transmission for COVID-19 and public
health. Risk Anal 2020; 40: 902–907.
2 Miller MR, Hankinson J, Brusasco V, et al. Standardisation of spirometry. Eur Respir J 2005; 26: 319–338.
3 Lødrup Carlsen KC. Tidal breathing at all ages. Monaldi Arch Chest Dis 2000; 55: 427–434.
4 Hull JH, Lloyd JK, Cooper BG. Lung function testing in the COVID-19 endemic. Lancet Respir Med 2020; 8:
666–667.
5 Motamedi-Fakhr S, Iles R, Barney A, et al. Evaluation of the agreement of tidal breathing parameters measured
simultaneously using pneumotachography and structured light plethysmography. Physiol Rep 2017; 5: e13124.
6 Hmeidi H, Motamedi-Fakhr S, Chadwick E, et al. Tidal breathing parameters measured using structured light
plethysmography in healthy children and those with asthma before and after bronchodilator. Physiol Rep 2017; 5:
e13168.
7 Hmeidi H, Motamedi-Fakhr S, Chadwick EK, et al. Tidal breathing parameters measured by structured light
plethysmography in children aged 2–12 years recovering from acute asthma/wheeze compared with healthy
children. Physiol Rep 2018; 6: e13752.
8 Motamedi-Fakhr S, Wilson RC, Iles R. Tidal breathing patterns derived from structured light plethysmography in
COPD patients compared with healthy subjects. Med Devices 2016; 10: 1–9.
9 Fleck D, Curry C, Donnan K, et al. Investigating the clinical use of structured light plethysmography to assess
lung function in children with neuromuscular disorders. PLoS One 2019; 14: e0221207.
10 Dizdar EA, Bozkaya D, Sari FN, et al. Tidal breathing parameters measured by structured light plethysmography
in newborns: is it feasible in neonatal intensive care unit? Am J Perinatol 2020; in press [http://doi.org/10.1055/s-
0040-1708883].
11 Niérat MC, Dubé BP, Llontop C, et al. Measuring ventilatory activity with structured light plethysmography (SLP)
reduces instrumental observer effect and preserves tidal breathing variability in healthy and COPD. Front Physiol
2017; 8: 316.
12 O’Reilly L, Sapey E, Desando S, et al. The effect of posture on ventilation using structured light plethysmography
(SLP) in alpha 1 anti-trypsin deficiency (A1AT). Eur Respir J 2014; 44: Suppl. 58, P4268.
13 Quanjer PH, Stanojevic S, Cole TJ, et al. Multi-ethnic reference values for spirometry for the 3–95-yr age range:
the global lung function 2012 equations. Eur Respir J 2012; 40: 1324–1343.
14 Rigby RA, Stasinopoulos DM. Generalized additive models for location, scale and shape. JR Stat Soc Ser C
(Applied Stat) 2005; 54: 507–554.
15 Schwarz G. Estimating the dimension of a model. Ann Stat 1978; 6: 461–464.
16 van Buuren S, Fredriks M. Worm plot: a simple diagnostic device for modelling growth reference curves. Stat Med
2001; 20: 1259–1277.
17 Fuchs O, Latzin P, Thamrin C, et al. Normative data for lung function and exhaled nitric oxide in unsedated
healthy infants. Eur Respir J 2011; 37: 1208–1216.
18 Gagliardi L, Rusconi F. Respiratory rate and body mass in the first three years of life. Arch Dis Child 1997; 76:
151–154.
19 Wallis LA, Healy M, Undy MB, et al. Age related reference ranges for respiration rate and heart rate from 4 to
16 years. Arch Dis Child 2005; 90: 1117–1121.
20 Fleming S, Thompson M, Stevens R, et al. Normal ranges of heart rate and respiratory rate in children from birth
to 18 years of age: a systematic review of observational studies. Lancet 2011; 377: 1011–1018.
21 Royal College of Physicians (RCP). National Early Warning Score (NEWS) 2: Standardising the Assessment of
Acute-Illness Severity in the NHS. London, RCP, 2017. Available from: www.rcplondon.ac.uk/projects/outputs/
national-early-warning-score-news-2
22 Tobin MJ, Chadha TS, Jenouri G, et al. Breathing patterns: 1. Normal subjects. Chest 1983; 84: 202–205.
23 Koga T, Watanabe K, Sano M, et al. Breathing intolerance index: a new indicator for ventilator use. Am J Phys
Med Rehabil 2006; 85: 24–30.
24 Parreira VF, Bueno CJ, França DC, et al. Breathing pattern and thoracoabdominal motion in healthy individuals:
influence of age and sex. Rev Bras Fisioter 2010; 14: 411–416.
25 Mendes LPS, Vieira DSR, Gabriel LS, et al. Influence of posture, sex, and age on breathing pattern and chest wall
motion in healthy subjects. Braz J Phys Ther 2020; 24: 240–248.
26 Wilkens H, Weingard B, Lo Mauro A, et al. Breathing pattern and chest wall volumes during exercise in patients
with cystic fibrosis, pulmonary fibrosis and COPD before and after lung transplantation. Thorax 2010; 65:
808–814.
https://doi.org/10.1183/23120541.00050-2021 9LUNG FUNCTION | S. MOTAMEDI-FAKHR ET AL.
27 Allen JL, Sivan Y. Measurements of chest wall function. In: Stocks S, Sly P, Tepper RS, et al. Infant Respiratory
Function Testing. New York, Wiley-Liss, 1996; pp. 329–351.
28 Fregonezi G, Sarmento A, Pinto J, et al. Thoracoabdominal asynchrony contributes to exercise limitation in mild
asthmatic subjects. Front Physiol 2018; 9: 719.
29 Mayer OH, Clayton RG, Jawad AF, et al. Respiratory inductance plethysmography in healthy 3- to 5-year-old
children. Chest 2003; 124: 1812–1819.
30 Pereira MC, Porras DC, Lunardi AC, et al. Thoracoabdominal asynchrony: two methods in healthy, COPD, and
interstitial lung disease patients. PLoS One 2017; 12: e0182417.
31 Elshafie G, Kumar P, Motamedi-Fakhr S, et al. Measuring changes in chest wall motion after lung resection using
structured light plethysmography: a feasibility study. Interact Cardiovasc Thorac Surg 2016; 23: 544–547.
32 Boulding R, Stacey R, Niven R, et al. Dysfunctional breathing: a review of the literature and proposal for
classification. Eur Respir Rev 2016; 25: 287–294.
33 Cavalcanti AGL, Rattes Lima CSF, Barros de Sá R, et al. Influence of posture on the ventilatory pattern and the
thoraco-abdominal kinematics of patients with chronic obstructive pulmonary disease (COPD). Physiother Theory
Pract 2014; 30: 490–494.
34 Priori R, Chakrabarti B, Angus R, et al. Contributions of rib cage (RC) and abdomen (AB) to tidal volume are
useful indicators for the assessment of difficult-to-wean patients. Eur Respir J 2012; 40: Suppl. 56, P4644.
35 Kaneko H, Horie J. Breathing movements of the chest and abdominal wall in healthy subjects. Respir Care 2012;
57: 1442–1451.
36 Hershenson MB, Colin AA, Wohl ME, et al. Changes in the contribution of the rib cage to tidal breathing during
infancy. Am Rev Respir Dis 1990; 141: 922–925.
37 Brant TCS, Parreira VF, Mancini MC, et al. Padrão respiratório e movimento toracoabdominal de crianças
respiradoras orais. [Breathing pattern and thoracoabdominal motion in mouth-breathing children]. Rev Bras
Fisioter 2008; 12: 495–501.
38 Verschakelen JA, Demedts MG. Normal thoracoabdominal motions. Influence of sex, age, posture, and breath
size. Am J Respir Crit Care Med 1995; 151: 399–405.
39 Kaplan V, Zhang JN, Russi EW, et al. Detection of inspiratory flow limitation during sleep by computer assisted
respiratory inductive plethysmography. Eur Respir J 2000; 15: 570–578.
40 Motamedi Fakhr S, Barker N, Alexander J, et al. Small-scale clinical validation of structured light plethysmography
(SLP) preliminary reference equations. Eur Respir J 2020; 56: 3367.
https://doi.org/10.1183/23120541.00050-2021 10You can also read