Burden of Norovirus in the United States, as Estimated Based on Administrative Data: Updates for Medically Attended Illness and Mortality, 2001-2015
←
→
Page content transcription
If your browser does not render page correctly, please read the page content below
Clinical Infectious Diseases
    MAJOR ARTICLE

Burden of Norovirus in the United States, as Estimated
Based on Administrative Data: Updates for Medically
Attended Illness and Mortality, 2001–2015
Rachel M. Burke,1, Claire P. Mattison,1,2 Talia Pindyck,1,3 Rebecca M. Dahl,4 Jessica Rudd,4 Daoling Bi,1 Aaron T. Curns,1 Umesh Parashar,1 and Aron J. Hall1

                                                                                                                                                                                                    Downloaded from https://academic.oup.com/cid/advance-article/doi/10.1093/cid/ciaa438/5820114 by guest on 01 January 2021
1
 Division of Viral Diseases, Centers for Disease Control and Prevention, Atlanta, Georgia, USA, 2Oak Ridge Institute for Science and Education, Oak Ridge, Tennessee, USA, 3Epidemic Intelligence
Service, Centers for Disease Control and Prevention, Atlanta, Georgia, USA, and 4Maximus Federal, contracting agency to the Division of Viral Diseases, Centers for Disease Control and
Prevention, Atlanta, Georgia, USA

   Background. Up-to-date estimates of the burden of norovirus, a leading cause of acute gastroenteritis (AGE) in the United
States, are needed to assess the potential value of norovirus vaccines in development. We aimed to estimate the rates, annual counts,
and healthcare charges of norovirus-associated ambulatory clinic encounters, emergency department (ED) visits, hospitalizations,
and deaths in the United States.
   Methods. We analyzed administrative data on AGE outcomes from 1 July 2001 through 30 June 2015. Data were sourced from
IBM MarketScan Commercial and Medicare Supplemental Databases (ambulatory clinic and ED visits), the Healthcare Utilization
Project National Inpatient Sample (hospitalizations), and the National Center for Health Statistics multiple-cause-of-mortality data
(deaths). Outcome data (ambulatory clinic and ED visits, hospitalizations, or deaths) were summarized by month, age group, and set-
ting. Healthcare charges were estimated based on insurance claims. Monthly counts of cause-unspecified gastroenteritis-associated
outcomes were modeled as functions of cause-specified outcomes, and model residuals were analyzed to estimate norovirus-
associated outcomes. Healthcare charges were estimated by applying average charges per cause-unspecified gastroenteritis encounter
to the estimated number of norovirus encounters.
   Results. We estimate 900 deaths (95% confidence interval [CI], 650–1100), 109 000 hospitalizations (95% CI, 80 000–145 000),
465 000 ED visits (95% CI, 348 000–610 000), and 2.3 million ambulatory clinic encounters (95% CI, 1.7–2.9 million) annually due
to norovirus, with an associated $430–$740 million in healthcare charges.
   Conclusions. Norovirus causes a substantial health burden in the United States each year, and an effective vaccine could have
important public health impact.
   Keywords. norovirus; norovirus incidence; gastroenteritis; United States.

Noroviruses, a diverse group of viruses within the family                                            on synthesis of various studies examining data for the period
Caliciviridae [1, 2], are a leading cause of acute gastroenteritis                                   ranging from 1993 to 2010 [4]. However, norovirus burden is
(AGE) worldwide [3]. Typical norovirus symptoms include di-                                          dynamic, as circulating norovirus strains vary each year, and
arrhea, vomiting, and abdominal cramps. Although illness is                                          the emergence of new strains is often associated with increased
usually self-limiting, it can cause severe outcomes (hospitaliza-                                    outbreaks [6, 7]. Furthermore, an increasing trend in norovirus
tion or death) in vulnerable populations, such as young children                                     AGE hospitalization rates was seen during 1997–2006, sug-
and older adults [4]. Given that a candidate norovirus vaccine                                       gesting that previous estimates may underrepresent the cur-
recently completed a phase 2b trial, up-to-date estimates of the                                     rent burden. Using 3 different administrative datasets for the
norovirus burden in the United States (US) are needed to as-                                         years 2001–2015, we provide updated estimates of US norovirus
sess the potential value of vaccination and to provide baseline                                      burden and its associated healthcare charges, focusing on 4 dis-
data from which future vaccine impact can be determined [5].                                         tinct outcomes: ambulatory clinic encounters, emergency de-
A previous study estimated the US burden of norovirus based                                          partment (ED) visits, hospitalizations, and deaths.

                                                                                                     METHODS

  Received 19 February 2020; editorial decision 1 April 2020; accepted 13 April 2020;                Data Sources
published online April 14, 2020.                                                                     Ambulatory clinic encounters and ED visit data were sourced from
  Correspondence: R. M. Burke, Centers for Disease Control and Prevention, 1600 Clifton Rd
NE, MS H24-5, Atlanta, GA 30329 (rburke@cdc.gov).                                                    2 IBM MarketScan Research Databases: Commercial and Medicare
Clinical Infectious Diseases®  2020;XX(XX):1–8                                                       Supplemental [8]. Hospitalization data were obtained from the
Published by Oxford University Press for the Infectious Diseases Society of America 2020. This       National Inpatient Sample of the Healthcare Cost and Utilization
work is written by (a) US Government employee(s) and is in the public domain in the US.
DOI: 10.1093/cid/ciaa438                                                                             Project (NIS-HCUP), a nationally representative database of

                                                                                                 Norovirus Burden in the US, 2001–2015 • cid 2020:XX (XX XXXX) • 1
community hospital discharges [9]. Deaths were identified from gastroenteritis; as a result, ICD codes are too insensitive to di-
the National Center for Health Statistics (NCHS) multiple-cause- rectly calculate burden [11, 12]. We therefore applied a previously
of-mortality dataset. For each outcome during July 2001–June 2015, developed method to estimate norovirus-attributable outcomes
data were summarized by month and year and stratified by age from available data on all AGE-related outcomes [13–15]. For
group: < 5 years, 5–17 years, 18–64 years, 65–74 years, 75–84 years, each outcome and age group, we modeled the monthly counts of
and ≥ 85 years. Given smaller sample sizes, only 3 age groups were cause-unspecified gastroenteritis as a function of monthly counts
used for calculation of mortality rates: < 5 years, 5–64 years, and for known pathogens. Models also included a term for time—that
≥ 65 years. Because all data were fully de-identified and no interaction is, sequential month of study—to account for secular trends. The
occurred with human subjects, this study was deemed nonresearch negative binomial distribution was used, and models were fitted
and thus exempt from institutional review board review. on the natural scale to facilitate interpretation of estimated coeffi-
Downloaded from https://academic.oup.com/cid/advance-article/doi/10.1093/cid/ciaa438/5820114 by guest on 01 January 2021
cients. Predictors included monthly counts of age group–specific
Definitions rotavirus, Clostridioides difficile, and non–C. difficile bacterial in-
We used International Classification of Diseases, Ninth Revision, fections, as well as monthly counts of parasitic infections summed
Clinical Modification (ICD-9-CM) codes to identify cause- across all ages. The form of the final models is shown below,
unspecified and cause-specified AGE-coded ambulatory where E(CUi,j) denotes the expected count of cause-unspecified
clinic encounters, ED visits, and hospital discharges. We used gastroenteritis in age group i during year-month j. Additional de-
International Classification of Diseases, Tenth Revision (ICD-10) tails are given in the Supplementary Methods. Estimated param-
codes from the NCHS multiple cause-of-mortality dataset to eters are shown in Supplementary Appendix Table 2.
identify AGE-coded deaths [10]. Cause-specified AGE included
bacterial, viral (not including norovirus), and parasitic causes • Ambulatory clinic encounters, ED visits, hospitalizations, and
(Table 1). Cause-unspecified AGE codes included ICD-9-CM mortality in ages ≥ 65 years: E(CUi, j) = β0i + β1iRotai,j + β2iC.
codes such as 009.0 (infectious colitis, enteritis, and gastroenter- difficilei, j + β3iOtherBacti,j + β4iParaall,j + β5i Timej;
itis) and 787.91 (diarrhea not otherwise specified), and their ICD- • Mortality in ages < 5 and 5–64 years: E(CUi,j) = β0i +
10 equivalents (Supplementary Appendix Table 1). In a sensitivity β1i Rotaall,j + β2iC.difficileall,j + β3iOtherBactall,j + β4iParaall,j + β
analysis, we tested a revised definition of AGE that also included Timej.
5i
outcomes with only a vomiting-specific code (ICD-9-CM: 787.01,
787.03; ICD-10: R11.1) and no other AGE-associated codes. The second step of estimation involved analysis of model
residuals. We calculated the minimum residual by seasonal
Statistical Methods for Estimation of Norovirus year (July–June), and then subtracted this value from the
Due to limited routine use of norovirus diagnostic testing, monthly residuals to obtain estimates of norovirus-associated
healthcare encounters are rarely coded for norovirus-specific outcomes. Finally, norovirus-coded outcomes were added to
Table 1. Mean Annual Encounters (in 10 000s) and Deaths (Counts) Associated With Acute Gastroenteritis by Pathogen Category, United States, 2001–2015a
Estimated
Ambulatory Clinic Estimated Estimated
Cause ICD-9-CM Codes ICD-10 Codes Encountersb ED Visitsb Hospitalizations Deathsc
Cause-unspecified 009.0–009.3, 558.9, 787.91, A09, K52.9, A08.3–A08.4, 1376.6 (94.5) 202.2 (93.4) 90.2 (73.7) 6089 (38.1)
AGE 008.69, 008.8 A08.8, K55.0,d K55.9d
Cause-specifiede … … 79.8 (5.5) 14.4 (6.6) 32.3 (26.4) 9890 (61.9)
AGE
Viral 008.61–008.67 A08.0–A08.2 9.4 (0.6) 2.0 (0.9) 1.8 (1.5) 22 (0.1)
Bacterial 001.0–01.9, 002.0–002.9, A00.0–A05.9 72.9 (5) 13.1 (6) 30.1 (24.6) 9843 (61.6)
003.0–003.1, 003.3–003.9,
004.0–004.9, 005.0–005.9,
008.0–008.5
Parasitic 006.0–006.2, 006.8–006.9, A06.0–A07.9 3.9 (0.3) 0.3 (0.1) 0.3 (0.2) 27 (0.2)
007.0–007.9
All-cause AGE … … 1456.4 (100) 216.6 (100) 122.4 (100) 15 979 (100)
Data are presented as no. (%).
Abbreviations: AGE, acute gastroenteritis; ED, emergency department; ICD-9-CM, International Classification of Diseases, Ninth Revision, Clinical Modification; ICD-10, International
Classification of Diseases, Tenth Revision.
a
From 1 July 2001 through 30 June 2015.
b
Extrapolated to the population using census data.
c
Raw numbers presented (ie, not in 10 000).
d
Included only for children aged < 5 years in 2001–2004.
e
Multiple codes may be assigned to a given record; thus, the sum of cases for each specific cause exceeds the subtotals for “cause unspecified” and “cause specified.” However, if any
cause-specified code was included in the record, the encounter was categorized as such.
2 • cid 2020:XX (XX XXXX) • Burke et almodel-estimated norovirus outcomes to generate the final calculated for each outcome using age-specific estimated norovirus
values, hereafter referred to as “estimated norovirus.” For mor- rates (Table 2), assuming a life expectancy of 78.6 years [18].
tality estimates, additional calculations were performed on
model residuals due to less distinct seasonality in some age Economic Analysis
groups. More details are given in the Supplementary Methods. A secondary aim of this analysis was to estimate norovirus-
associated healthcare charges in the US. The median charges for
Extrapolation to the Population cause-unspecified gastroenteritis encounters were calculated by
For ambulatory clinic encounters and ED visits, rates were calcu- age group and outcome for each year, and updated to 2016 US
lated by dividing the number of estimated cases by the monthly dollars [19, 20]. The mean was taken across years and applied
MarketScan populations from July 2001 to July 2015 for each age to the estimated average total annual number of norovirus-
group. These rates were applied to census data (for the full US pop- associated healthcare encounters across the study period to
Downloaded from https://academic.oup.com/cid/advance-article/doi/10.1093/cid/ciaa438/5820114 by guest on 01 January 2021
ulation) to estimate the total number of norovirus-associated visits generate a total estimate for norovirus-associated healthcare
for each setting [16, 17]. Norovirus counts for hospitalizations were charges.
estimated as described above, and these counts applied to census
RESULTS
data to generate rate estimates. Similarly, mortality rates were cal-
culated by applying the number of estimated deaths to census data, Over the course of the 14-year study period, the majority of
by age group. Confidence intervals (CIs) were derived from the AGE-coded outcomes were cause-unspecified (ranging from
95% CIs of the modeled unspecified AGE cases. Lifetime risks were 38% for deaths to 95% for ambulatory clinic encounters)
Table 2. Mean Annual Counts and Rates of All-cause Acute Gastroenteritis and Estimated Norovirusa by Outcome and Age Group, United States, Seasonal
Years 2001–2002 Through 2014–2015
All-cause AGE Estimateda Norovirus
Age Group, y Counts in 10 000b Rate per 10 000 PYc Counts in 10 000b (95% CI) Rate per 10 000 PYc (95% CI) % of All-cause AGE
Ambulatory clinic encounters(Table 1). Within cause-specified AGE outcomes, bacterial CI, 107–203) per 10 000 PY, while the estimated norovirus-
illnesses, particularly C. difficile, accounted for the bulk of associated ED visit rate was 32 (95% CI, 24–41) per 10 000 PY,
the diagnoses (Supplementary Appendix Table 3). Norovirus- accounting for 13% and 19% of AGE-associated ambulatory
coded outcomes accounted for < 0.25% of all-cause AGE clinic and ED visits, respectively.
(Supplementary Appendix Table 4). Estimated norovirus ED visit rates spiked in 2002–2003,
a year during which a new norovirus strain emerged and was
Ambulatory Clinic Encounters and ED Visits associated with increased outbreak activity [21, 22]; a spike
We estimated a mean annual rate of 75 (95% CI, 58–95) was also noted for ED visit rates in 2004–2005, a year during
norovirus-associated ambulatory clinic encounters per 10 000 which another new norovirus strain emerged [23] (Figure 1).
person-years (PY) and 15 (95% CI, 12–20) norovirus-associated Both ambulatory clinic visit rates and ED visit rates spiked in
ED visits per 10 000 PY (Table 2), across all ages, equivalent to
Downloaded from https://academic.oup.com/cid/advance-article/doi/10.1093/cid/ciaa438/5820114 by guest on 01 January 2021
2006–2007, another year during which a new norovirus strain
2.3 million ambulatory clinic encounters and 470 000 ED visits emerged and was associated with increased outbreak activity
annually. Estimated norovirus rates for each of these outcomes [21, 24]. A clear winter seasonality was noted in most age
were disproportionately high in children aged < 5 years and groups for both settings; however, in the age groups 65–74 and
adults aged ≥ 85 years. Among children aged < 5 years, the an- 75–84 years, annual median estimated norovirus ambulatory
nual estimated norovirus ambulatory clinic encounter and ED clinic encounters did not have a pronounced winter seasonality
visit rates were 281 (95% CI, 221–356) per 10 000 PY and 46 (Supplementary Appendix Figures 1 and 2).
(95% CI, 36–59) per 10 000 PY, accounting for 23% and 30% of
AGE-associated ambulatory clinic encounters and ED visits, re- Hospitalizations
spectively. Among adults aged ≥ 85 years, the annual estimated We estimated a mean annual rate of 3.6 (95% CI, 2.6–4.8)
norovirus ambulatory clinic encounter rate was 151 (95% norovirus-associated hospitalizations per 10 000 PY, accounting
Figure 1. Estimated rates of norovirus encounters by seasonal year—United States, 2001–2002 through 2014–2015. Estimated annual rates of norovirus-related encoun-
ters varied by seasonal year as well as outcome. Abbreviations: ED, emergency department; K, thousands; M, millions; PY, person-years.
4 • cid 2020:XX (XX XXXX) • Burke et alfor 9% of all-cause AGE hospitalizations and equivalent to a modest winter seasonality, with pronounced and elevated
110 000 hospitalizations per year (Table 2). Estimated noro- peaks in the 2002–2003, 2006–2007, and 2012–2013 seasonal
virus hospitalization rates were disproportionately high in the years; though a new norovirus strain emerged in 2012–2013,
youngest and oldest age groups. Among children < 5 years old, it was not associated with increased outbreak activity [25]
the annual estimated norovirus hospitalization rate was 13 (95% (Supplementary Appendix Figures 1 and 2).
CI, 10–16) per 10 000 PY, accounting for 25% of all-cause AGE
hospitalizations in this age group. Among adults ≥ 85 years Healthcare Charges
old, the annual estimated norovirus hospitalization rate was 29 Norovirus-associated ambulatory clinic and ED visits resulted
(95% CI, 21–38) per 10 000 PY, accounting for 11% of all-cause in an average of $225 million and $237 million annually in US
AGE hospitalizations in this age group. Estimated norovirus healthcare charges, respectively. Compared to other age groups,
Downloaded from https://academic.oup.com/cid/advance-article/doi/10.1093/cid/ciaa438/5820114 by guest on 01 January 2021
hospitalization rates spiked in 2002–2003 and 2006–2007 sea- adults aged 18–64 years carried the highest mean charge per
sonal years and exhibited a pronounced winter seasonality in norovirus ambulatory clinic and ED visit ($111 and $586, re-
all age groups (Figure 1 and Supplementary Appendix Figures spectively), and had the highest total estimated national charges
1 and 2). for norovirus ambulatory clinic and ED visits ($84 million and
$141 million, respectively) (Table 3). On average, norovirus
Deaths hospitalizations resulted in $106 million annually in US health-
We estimated a mean annual rate of 2.8 (95% CI, 2.2–3.6) no- care charges; more than half of these charges were associated
rovirus deaths per million PY, making up 5% of all-cause AGE with children < 5 years of age, as this age group had the highest
deaths and equivalent to 900 norovirus deaths annually (Table 2). mean charge per hospitalization ($2513).
Norovirus deaths were highest among adults aged ≥ 65 years
(19 per million PY [95% CI, 14–24]) and accounted for 86%
DISCUSSION
of estimated norovirus deaths across all ages. Estimated noro-
virus mortality rates increased in 2002–2003 and 2006–2007, as Based on this comprehensive analysis of 3 distinct national ad-
seen in hospitalizations. Mortality rates remained elevated until ministrative databases, we estimate that norovirus is associated
2011–2012, when rates again decreased (Figure 1). Estimated with approximately 900 deaths (2.8 per 1 000 000 PY), 109 000
norovirus mortality rates in adults ≥ 65 years old exhibited hospitalizations (3.6 per 10 000 PY), 465 000 ED visits (15.3 per
Table 3. Estimated Healthcare Burden and Medical Charges Associated With Norovirus in the United States, July 2001–June 2015 (in 2016 US Dollars)
Estimated Total Annual NV Mean Charge per Estimated Total Annual Charges,
Age Group, y Counts in 10 000s (95% CI) Encounter, US$ (SD) Millions of 2016 US$ (95% CI)
Ambulatory clinic encounters10 000 PY), and 2 270 000 ambulatory clinic encounters (74.9 norovirus strains associated with increased outbreak activity
per 10 000 PY) annually in the US, resulting in nearly $600 mil- (2002–2003 and 2006–2007) [21, 24, 37]. Overall, we did not
lion in medical charges each year. The norovirus rate estimates see similar spikes during the 2009–2010 and 2012–2013 sea-
produced in this study confirm and expand on previously pub- sonal years (except for mortality in 2012–2013), during which
lished work. Prior studies using the same databases and mod- new GII.4 norovirus variants also emerged; outbreak activity
eling methods estimated 800 deaths, 71 000 hospitalizations, during those seasonal years did not reach the levels seen in
400 000 ED visits, and 1 693 000 ambulatory clinic encounters 2002–2003 or 2006–2007 [25, 38]. Because genotype data were
due to norovirus anually in the US [13–15]; our estimates for not available for norovirus-coded outcomes, we were unable to
ambulatory clinic encounters, ED visits, hospitalizations, and verify these patterns even with limited data.
deaths were somewhat higher but generally comparable. Similar Several limitations of this analysis should be considered.
Downloaded from https://academic.oup.com/cid/advance-article/doi/10.1093/cid/ciaa438/5820114 by guest on 01 January 2021
modeling studies performed using administrative databases Certain assumptions in the methods may have led to overesti-
from the United Kingdom, Taiwan, and Canada have also re- mation of the norovirus burden. For instance, other viruses with
sulted in comparable norovirus burden estimates: 49 outpatient similar seasonality to norovirus (such as rotavirus, astrovirus,
visits per 10 000 PY and 2–7 hospitalizations per 10 000 PY or sapovirus) may have been mistakenly attributed to norovirus
[26–28], whereas estimates from Japan were somewhat higher if they were not specifically coded. In the case of rotavirus, this
at 389 outpatient visits and 13 hospitalizations per 10 000 PY would have been most likely in age groups that are not often
[29]. Our estimates are also aligned with norovirus burden esti- tested for rotavirus, but who may still be affected (eg, older in-
mates generated using alternative methods. Passive surveillance dividuals). On the other hand, other aspects of the method may
conducted within specific US healthcare systems have estimated have led to underestimation of the norovirus burden. First, in
the norovirus burden as 56–64 ambulatory clinic encounters the analysis of residuals, we assumed that there was 1 month
per 10 000 PY [11, 30], while passive and active surveillance in in each seasonal year where there were no norovirus-associated
European countries have estimated a norovirus burden in the outcomes. However, it is known that norovirus circulates year-
range of 9–54 outpatient visits per 10 000 PY, 1.2–3.4 hospi- round in the US [7]. Second, ICD codes are not fully sensitive
talizations per 10 000 PY, and 0.5–4.0 deaths per 1 000 000 PY for AGE [39]; the resulting smaller overall AGE envelope could
[31–35]. have led to an underestimate of norovirus. Third, although no-
The present study was also consistent with prior observa- rovirus can present with only vomiting (no diarrhea), we did
tions that the elderly may be more vulnerable to severe out- not include encounters with the corresponding ICD codes
comes from norovirus [36]; we estimated that 86% of annual (vomiting in the absence of diarrheal/general gastroenteritis
norovirus-associated deaths and 43% of norovirus-associated codes). When we included these codes into our overall gastro-
hospitalizations in the US occur in adults aged ≥ 65 years. enteritis counts as a sensitivity analysis, we found that our es-
In contrast, the incidence of norovirus ambulatory clinic en- timates of norovirus were nonnegligibly increased for several
counters and ED visits was highest in children < 5 years of age, outcomes (Supplementary Appendix Table 5); however, since
highlighting the disproportionate burden of norovirus in the these estimates were, in some cases, far in excess of the 20% in-
outpatient setting among young children. On average, approx- crease that might be expected based on previous research [40],
imately 20%–25% of norovirus-associated ambulatory clinic we suspect that our estimation methods may not reliably be ex-
and ED visits annually occurred in children aged < 5 years, and tended to vomit-only outcomes, given differences in the under-
the annual estimated norovirus ambulatory clinic and ED visit lying distribution of causes of vomit-only presentations. It is also
rates in this age group were approximately 3-fold higher than possible that our method could have misattributed background
the respective annual rates across all ages combined. Estimated trends to norovirus, or vice versa, if there were secular trends in
norovirus-associated hospitalization rates were also high in this overall norovirus rates over time. However, given the absence
age group, again nearly 3-fold higher than the estimated rate of a norovirus vaccine or novel therapeutic, a decreasing sec-
across the age spectrum. These J- and U-shaped patterns, with ular trend seems unlikely. If there were an increasing secular
the highest rates of norovirus-associated outcomes seen in the trend in norovirus, this method would tend to underestimate
pediatric and elderly populations, are also consistent with pre- the burden. Unfortunately, we were not able to extend this anal-
vious research in high-resource settings using diverse methods ysis beyond 2015; given the importance of relatively consistent
[26, 27, 29, 32, 34]. trends in ICD-coded outcomes to the analysis method, we felt it
Our norovirus estimates were consistent with known noro- prudent to end the study period at the switch from ICD-9-CM
virus epidemiology: deaths and healthcare encounters demon- to ICD-10-CM. Despite these limitations, the robustness of the
strated a wintertime (December–February) seasonality, with estimates to variations in model parameters (Supplementary
rates peaking in December and January for each outcome, Appendix Table 6) and the consistency of results with known
across most age groups. Norovirus healthcare encounters spiked norovirus seasonality as well as existing literature lend confi-
with the emergence of new genogroup II, type 4 (GII.4) variant dence to these estimates.
6 • cid 2020:XX (XX XXXX) • Burke et alDownloaded from https://academic.oup.com/cid/advance-article/doi/10.1093/cid/ciaa438/5820114 by guest on 01 January 2021
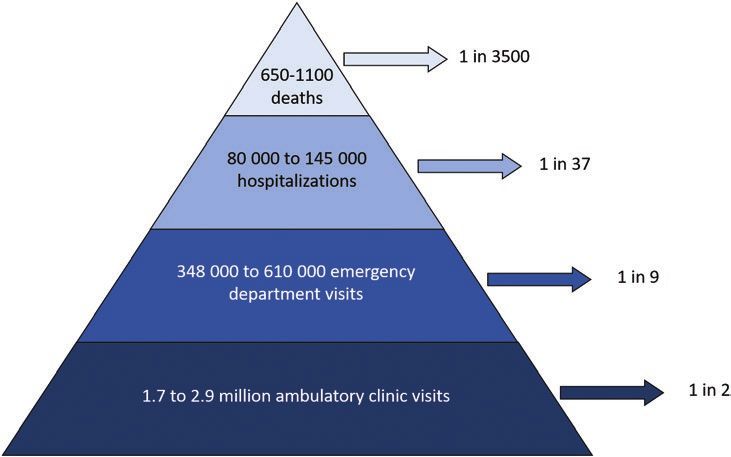
Figure 2. Disease burden of norovirus in the United States. Ranges of total annual deaths, hospitalizations, emergency department visits, and ambulatory clinic encounters
are presented within the pyramid; the corresponding estimated lifetime risk is noted with arrows.
Other limitations stem from the use of the MarketScan data, emergency department, 1 in 37 to be hospitalized, and 1 in 3500
which are not nationally representative. Because MarketScan to die from norovirus illness at some point within their life-
includes only individuals with employer-sponsored commer- time (Figure 2). The burden of outpatient encounters is highest
cial insurance or employer-sponsored Medicare Supplement among children, while the elderly experience the highest rates
plans (< 60% of the full US population), if these persons seek of norovirus-associated hospitalizations and deaths. With sev-
care for AGE at different rates than nonincluded individuals eral norovirus vaccines in development [5, 42, 43], these find-
(eg, uninsured or Medicaid-covered persons), then our results ings provide a benchmark against which a future vaccine can be
for ambulatory clinic and ED visits may not be a good repre- evaluated, as well as an indication of which populations should
sentation of the full US population. For instance, if uninsured be targeted for greatest public health impact. Active surveil-
or underinsured persons are more likely to present to an ED lance of norovirus is warranted to refine burden estimates and
and less likely to present to an ambulatory care clinic for AGE, provide more detail and precision, particularly with regards to
then our ambulatory care numbers may be overestimates, specific norovirus genotypes and economic costs.
while our ED numbers may be underestimates of the national
burden. However, it is reassuring to note that estimates of noro- Supplementary Data
Supplementary materials are available at Clinical Infectious Diseases online.
virus hospitalization rates were similar across many age groups
Consisting of data provided by the authors to benefit the reader, the posted
in both NIS-HCUP and MarketScan despite population differ- materials are not copyedited and are the sole responsibility of the authors, so
ences (Supplementary Appendix Table 7), and analysis suggests questions or comments should be addressed to the corresponding author.
that norovirus estimates would remain within the calculated
Notes
confidence limits even if rates were adjusted for differences in
Acknowledgments. The authors acknowledge the advice of Dr Ismael
database populations. Ortega-Sánchez as regards the economic applications of this paper.
Last, the financial data obtained from MarketScan represent Disclaimer. The findings and conclusions in this report are those of the
total charges billed to payers and not actual settled costs, and authors and do not necessarily represent the official position of the Centers
for Disease Control and Prevention.
could overestimate the healthcare spending associated with no-
Potential conflicts of interest. The authors: No reported conflicts of
rovirus; however, since these numbers do not account for lost interest. All authors have submitted the ICMJE Form for Disclosure of
productivity (work absenteeism) or premature death, the total Potential Conflicts of Interest.
economic burden is likely underestimated [41]. Differences
References
in charges between norovirus-associated and other cause-
1. Vinjé J. Advances in laboratory methods for detection and typing of norovirus. J
unspecified gastroenteritis treatment could also affect our es- Clin Microbiol 2015; 53:373–81.
timates of healthcare charges, as could differences in charges 2. Chhabra P, de Graaf M, Parra GI, et al. Updated classification of norovirus
genogroups and genotypes. J Gen Virol 2019; 100:1393–406.
for individuals represented within the MarketScan databases as 3. Kirk MD, Pires SM, Black RE, et al. World Health Organization estimates of the
compared to the general US population. global and regional disease burden of 22 foodborne bacterial, protozoal, and viral
diseases, 2010: a data synthesis. PLoS Med 2015; 12:e1001921.
Norovirus causes a significant burden in the US, causing 1 in 4. Hall AJ, Lopman BA, Payne DC, et al. Norovirus disease in the United States.
2 Americans to have an ambulatory clinic visit, 1 in 9 to go the Emerg Infect Dis 2013; 19:1198–205.
Norovirus Burden in the US, 2001–2015 • cid 2020:XX (XX XXXX) • 75. Lopman BA, Steele D, Kirkwood CD, Parashar UD. The vast and varied global 23. Bull RA, Tu ET, McIver CJ, Rawlinson WD, White PA. Emergence of a new no-
burden of norovirus: prospects for prevention and control. PLoS Med 2016; rovirus genotype II.4 variant associated with global outbreaks of gastroenteritis. J
13:e1001999. Clin Microbiol 2006; 44:327–33.
6. Zheng DP, Widdowson MA, Glass RI, Vinje J. Molecular epidemiology of 24. Centers for Disease Control and Prevention. Norovirus activity—United States,
genogroup II-genotype 4 noroviruses in the United States between 1994 and 2006. 2006–2007. MMWR Morb Mortal Wkly Rep 2007; 56:842–6.
J Clin Microbiol 2010; 48:168–77. 25. Leshem E, Wikswo M, Barclay L, et al. Effects and clinical significance of
7. Cannon JL, Barclay L, Collins NR, et al. Genetic and epidemiologic trends of no- GII.4 Sydney norovirus, United States, 2012-2013. Emerg Infect Dis 2013;
rovirus outbreaks in the United States from 2013 to 2016 demonstrated emer- 19:1231–8.
gence of novel GII.4 recombinant viruses. J Clin Microbiol 2017; 55:2208–21. 26. Verstraeten T, Cattaert T, Harris J, Lopman B, Tam CC, Ferreira G. Estimating the
8. Adamson DM, Chang S, Hansen LG. Health research data for the real burden of medically attended norovirus gastroenteritis: modeling linked primary
world: the MarketScan Databases (white paper). 2006. Available at: http:// care and hospitalization datasets. J Infect Dis 2017; 216:957–65.
patientprivacyrights.org/wp-content/uploads/2011/06/Thomson-Medstat- 27. Burke RM, Shih SM, Yen C, et al. Burden of severe norovirus disease in Taiwan,
white-paper.pdf. Accessed 18 April 2020. 2003–2013. Clin Infect Dis 2018; 67:1373–8.
9. Healthcare Utilization Project. NIS overview. Available at: https://www.hcup-us. 28. Morton VK, Thomas MK, McEwen SA. Estimated hospitalizations attributed to
ahrq.gov/nisoverview.jsp. Accessed 21 August 2019. norovirus and rotavirus infection in Canada, 2006–2010. Epidemiol Infect 2015;
Downloaded from https://academic.oup.com/cid/advance-article/doi/10.1093/cid/ciaa438/5820114 by guest on 01 January 2021
10. Esposito DH, Holman RC, Haberling DL, et al. Baseline estimates of diarrhea- 143:3528–37.
associated mortality among United States children before rotavirus vaccine intro- 29. Chang CH, Sakaguchi M, Weil J, Verstraeten T. The incidence of medically-
duction. Pediatr Infect Dis J 2011; 30:942–7. attended norovirus gastro-enteritis in Japan: modelling using a medical care in-
11. Hall AJ, Rosenthal M, Gregoricus N, et al. Incidence of acute gastroenteritis and surance claims database. PLoS One 2018; 13:e0195164.
role of norovirus, Georgia, USA, 2004–2005. Emerg Infect Dis 2011; 17:1381–8. 30. Grytdal SP, DeBess E, Lee LE, et al. Incidence of norovirus and other viral patho-
12. Cardemil CV, O’Leary S, Beaty B, et al. Primary care physician knowledge, atti- gens that cause acute gastroenteritis (AGE) among Kaiser Permanente member
tudes and diagnostic testing practices for norovirus and acute gastroenteritis. In: populations in the United States, 2012–2013. PLoS One 2016; 11:e0148395.
Pediatric Academic Societies Meeting, Baltimore, MD, 2019. 31. Phillips G, Tam CC, Conti S, et al. Community incidence of norovirus-associated
13. Gastanaduy PA, Hall AJ, Curns AT, Parashar UD, Lopman BA. Burden of noro- infectious intestinal disease in England: improved estimates using viral load for
virus gastroenteritis in the ambulatory setting—United States, 2001–2009. J Infect norovirus diagnosis. Am J Epidemiol 2010; 171:1014–22.
Dis 2013; 207:1058–65. 32. O’Brien SJ, Donaldson AL, Iturriza-Gomara M, Tam CC. Age-specific incidence
14. Hall AJ, Curns AT, McDonald LC, Parashar UD, Lopman BA. The roles of rates for norovirus in the community and presenting to primary healthcare facil-
Clostridium difficile and norovirus among gastroenteritis-associated deaths in the ities in the United Kingdom. J Infect Dis 2016; 213(Suppl 1):S15–8.
United States, 1999–2007. Clin Infect Dis 2012; 55:216–23. 33. Verhoef L, Koopmans M, VAN Pelt W, et al. The estimated disease burden of no-
15. Lopman BA, Hall AJ, Curns AT, Parashar UD. Increasing rates of gastroenteritis rovirus in the Netherlands. Epidemiol Infect 2013; 141:496–506.
hospital discharges in US adults and the contribution of norovirus, 1996–2007. 34. Kowalzik F, Binder H, Zoller D, et al. Norovirus gastroenteritis among hospital-
Clin Infect Dis 2011; 52:466–74. ized patients, Germany, 2007–2012. Emerg Infect Dis 2018; 24:2021–8.
16. National Center for Health Statistics. Vintage 2018 postcensal estimates of the 35. Bernard H, Hohne M, Niendorf S, Altmann D, Stark K. Epidemiology of noro-
resident population of the United States (April 1, 2010, July 1, 2010-July 1, 2018), virus gastroenteritis in Germany 2001–2009: eight seasons of routine surveil-
by year, county, single-year of age (0, 1, 2, .., 85 years and over), bridged race, lance. Epidemiol Infect 2014; 142:63–74.
Hispanic origin, and sex. Prepared under a collaborative arrangement with 36. Burke RM, Shah MP, Wikswo ME, et al. The norovirus epidemiologic triad: pre-
the U.S. Census Bureau. U.S. Census Bureau of the unbridged Vintage 2018 dictors of severe outcomes in US norovirus outbreaks, 2009–2016. J Infect Dis
postcensal estimates by 5-year age group, 2019. Available at: https://www.cdc.gov/ 2019; 219:1364–72.
nchs/nvss/bridged_race.htm”/nchs/nvss/bridged_race.htm 37. Siebenga JJ, Vennema H, Zheng DP, et al. Norovirus illness is a global problem:
17. National Center for Health Statistics. Bridged-race intercensal estimates of the emergence and spread of norovirus GII.4 variants, 2001–2007. J Infect Dis 2009;
resident population of the United States for July 1, 2000-July 1, 2009, by year, 200:802–12.
county, single-year of age (0, 1, 2, .., 85 years and over), bridged race, Hispanic 38. Yen C, Wikswo ME, Lopman BA, Vinje J, Parashar UD, Hall AJ. Impact of an
origin, and sex. Prepared under a collaborative arrangement with the U.S. Census emergent norovirus variant in 2009 on norovirus outbreak activity in the United
Bureau. U.S. Census Bureau of the revised unbridged postcensal estimates by States. Clin Infect Dis 2011; 53:568–71.
5-year age group, 2008. Available at: /nchs/nvss/bridged_race.htm 39. Pindyck T, Hall AJ, Tate JE, et al. Validation of acute gastroenteritis-related ICD-CM
18. Centers for Disease Control and Prevention. Life expectancy. Available at: https:// codes in pediatric and adult U.S. populations. Clin Infect Dis 2020. In press.
www.cdc.gov/nchs/fastats/life-expectancy.htm. Accessed 1 December 2019. 40. World Health Organization. WHO estimates of the global burden of foodborne
19. Bureau of Economic Analysis, US Department of Commerce. Available at: www. diseases: Foodborne Disease Burden Epidemiology Reference Group 2007–2015.
bea.gov. Accessed 1 November 2019. Geneva, Switzerland: WHO, 2015.
20. Dunn A, Grosse SD, Zuvekas SH. Adjusting health expenditures for inflation: a 41. Bartsch SM, Lopman BA, Hall AJ, Parashar UD, Lee BY. The potential eco-
review of measures for health services research in the United States. Health Serv nomic value of a human norovirus vaccine for the United States. Vaccine 2012;
Res 2018; 53:175–96. 30:7097–104.
21. Centers for Disease Control and Prevention. Norovirus activity—United States, 42. Riddle MS, Chen WH, Kirkwood CD, MacLennan CA. Update on vaccines for
2002. MMWR Morb Mortal Wkly Rep 2003; 52:41–5. enteric pathogens. Clin Microbiol Infect 2018; 24:1039–45.
22. Widdowson MA, Cramer EH, Hadley L, et al. Outbreaks of acute gastroenteritis 43. Mattison CP, Cardemil CV, Hall AJ. Progress on norovirus vaccine research:
on cruise ships and on land: identification of a predominant circulating strain of public health considerations and future directions. Expert Rev Vaccines 2018;
norovirus—United States, 2002. J Infect Dis 2004; 190:27–36. 17:773–84.
8 • cid 2020:XX (XX XXXX) • Burke et alYou can also read