Effects of long sleep time and irregular sleep-wake rhythm on cognitive function in older people - Nature
←
→
Page content transcription
If your browser does not render page correctly, please read the page content below
www.nature.com/scientificreports
OPEN Effects of long sleep time
and irregular sleep–wake rhythm
on cognitive function in older
people
Masato Okuda1, Akiko Noda1*, Kunihiro Iwamoto2, Honoka Nakashima1, Kozue Takeda1,
Seiko Miyata2, Fumihiko Yasuma3, Norio Ozaki2 & Akito Shimouchi4
Sleep disturbances and cognitive decline are common in older adults. We aimed to investigate the
effects of the total sleep time (TST) and sleep–wake rhythm on executive function and working
memory in older adults. In 63 older participants, we measured the TST, wake after sleep onset
(WASO), and sleep timing (midpoint between bedtime and wake-up time) using actigraphy. Executive
function was evaluated with the trail making test B (TMT-B) and Wisconsin card sorting test (WCST).
The number of back task (N-back task) was used to measure working memory. Participants with
a TST ≥ 8 h had a significantly lower percentage of correct answers (% correct) on the 1-back task than
those with a TST < 8 h. The % correct on the 1-back task was significantly correlated with the TST,
WASO, and sleep timing. Multiple regression analyses revealed that the TST and sleep timing were
significant factors of the % correct on the 1-back task. The TMT-B score was significantly correlated
with the sleep timing. Category achievement on the WCST was significantly correlated with the
standard deviation of the sleep timing. Therefore, a long sleep time and an irregular sleep–wake
rhythm could have adverse effects on executive function and working memory in older people.
Sleep disturbances and cognitive decline are common in older a dults1. Sleep patterns often change with age,
resulting in a decrease in the total sleep time (TST), and an increase in sleep f ragmentation2, 3. A recent observa-
tional cross-sectional study involving community-dwelling older Chinese people demonstrated that both short
(< 6 h) and long (> 8 h) sleep durations corresponded to poor scores on the Mini-Mental State Examination
(MMSE), which provides a global measurement of cognitive f unction4. Moreover, a meta-analysis based on self-
reporting showed an association between both short and long sleep durations and poor cognitive performance
in an older p opulation5. Although a long sleep duration may be related to sleep fragmentation and increased risk
of mortality6, the mechanisms underlying the relationship between a long sleep duration and cognitive decline
remain unclear.
The circadian rhythm affects the cognition-related cortical and arousal-promoting subcortical brain regions
of the thalamus, anterior hypothalamus, and locus coeruleus in the brainstem7. The circadian clock regulates
sleep and cognitive functions in both a sleep-dependent and sleep-independent m anner8. Disturbances in the
circadian rhythm are enhanced with ageing and are particularly prominent in patients with Alzheimer’s disease9.
In addition, disruptions in the sleep–wake rhythm have been related to the severity of Alzheimer’s disease or later
stages of dementia10. However, the role of the sleep–wake rhythm in cognitive function has not been completely
evaluated in community-dwelling older people free from dementia-related disorders.
The MMSE or revised Hasegawa’s dementia scale (HDS-R)11 is commonly used to screen patients for demen-
tia. Little is known about whether the TST or sleep–wake rhythm is associated with generalized or specific
cognitive impairment. The different domains of cognitive function have been widely assessed with the trail mak-
ing test B (TMT-B)12, Wisconsin card sorting test (WCST)13, and number of back task (N-back task)14, 15. The
TMT-B and WCST are used to evaluate executive function. Executive function comprises high-level cognitive
processes that facilitate one’s behaviour to optimize the approach to unfamiliar circumstances16. The N-back task
1
Department of Biomedical Sciences, Chubu University Graduate School of Life and Health Sciences, 1200,
Matsumoto‑cho, Kasugai‑shi, Aichi 487‑8501, Japan. 2Department of Psychiatry, Nagoya University Graduate
School of Medicine, Nagoya, Japan. 3Department of Internal Medicine, National Hospital Organization Suzuka
Hospital, Suzuka, Japan. 4Department of Lifelong Sports for Health, Chubu University Collage of Life and Health
Sciences, Kasugai, Japan. *email: anoda@isc.chubu.ac.jp
Scientific Reports | (2021) 11:7039 | https://doi.org/10.1038/s41598-021-85817-y 1
Vol.:(0123456789)www.nature.com/scientificreports/
has been utilized to investigate the role of the prefrontal cortex in working memory processes. A long sleep time
and an irregular sleep–wake rhythm may have a negative impact on the different domains of cognitive function.
Therefore, in this study, we aimed to investigate the effects of the TST and sleep–wake rhythm on executive
function and working memory in older people.
Methods
Participants. Sixty-three consecutive volunteers aged ≥ 60 years (39 males, 24 females; mean age,
70.4 ± 4.8 years) were enrolled in this study. We used a questionnaire to collect data on the following: age; body
mass index; smoking status; alcohol intake; history of hypertension, diabetes mellitus, and hyperlipidaemia;
current medications; Epworth sleepiness scale score17; and Pittsburgh sleep quality index18. An active smoker
was defined as any participant who was either currently smoking or had quit within the last 4 years19. Alcohol
rinks20. Participants with systolic blood pressure ≥ 140 mmHg
intake referred to the regular intake of alcoholic d
or diastolic blood pressure ≥ 90 mmHg, or those receiving antihypertensive therapy were considered to have
hypertension21. Diabetes mellitus and hyperlipidaemia were defined by the use of oral hypoglycaemic and lipid-
lowering agents, respectively. The participants had no history of myocardial infarction, angina pectoris, heart
failure, cerebral infarction, cerebral haemorrhage, chronic obstructive pulmonary disease or the use of antide-
pressants, benzodiazepines, or sleep medications. This study was approved by the ethics committee of Chubu
University (Approval number 270098). After explaining the nature of the study and procedures involved, we
obtained written informed consent from all participants. We performed this study in accordance with relevant
guidelines/regulations.
Actigraphy. Actigraphy (Ambulatory Monitoring Inc., New York, NY, USA) was performed for 5–7 con-
secutive days. The actigraph was worn around the wrist on the non-dominant side and was set to store data in
1-min increments. The bedtime and wake-up time, sleep diary-derived parameters, were used to ascertain and
set the analysis interval for the actigraphy device22. We analysed the actigraphy data using the algorithm supplied
by the Action W-2 clinical sleep analysis software package for Windows (Ambulatory Monitoring Inc., New
York, NY, USA). Sleep and activity were scored according to the Cole–Kripke formula23. We evaluated the TST,
sleep efficiency (calculated as TST/time spent in bed × 100), and wake after sleep onset (WASO). Each of these
parameters was averaged per night during which actigraphy was performed. Moreover, the bedtime, wake-up
time, and sleep timing (midpoint between bedtime and wake-up time) were assessed as sleep-wake parameters24.
Home sleep apnoea test. Participants were screened for sleep apnoea using a portable device (SAS-2100,
NIHON KODEN, Tokyo, Japan), in which a nasal pressure sensor and a pulse oximeter were used to record
airflow, pulse, and oxygen saturation ( SpO2). The participants were instructed on how to wear and use the equip-
ment. We evaluated the apnoea–hypopnea index (AHI) as the total number of apnoeas and hypopneas divided
by the artifact-free recording time, along with the minimum S pO2.
Cognitive function tests. HDS‑R. The HDS-R is commonly used as a screening test for dementia,
and consists of nine simple questions, with a maximum score of 30 points. The participants were asked to state
their age, the date, and their location; repeat three words, and perform a serial subtraction of seven starting
at 100. They were then asked to recall digits backwards, three words, and five objects, and state the names of
vegetables11. The HDS-R score has shown a significant correlation with the MMSE score25.
TMT‑B. The TMT-B provides information on visual searching, scanning, processing speed, mental flexibility,
and executive function12. In this test, participants drew lines to connect numbers and letters in alternating pat-
terns by connecting the first number with the first letter, and they continued to connect number–letter pairs
until the last number of 13 was reached. Participants were required to perform these procedures sequentially as
quickly as possible. The time to completion (score, in seconds) was recorded.
WCST. The WCST (WCST-Keio F-S version, Japanese Stroke Data Bank, Japan) is used to measure executive
functions, such as the ability to reason the abstract and then to shift cognitive strategies in response to chang-
ing environmental c ontingencies13, 26. In the present study, we particularly measured category achievement and
total errors. Category achievement was defined as the number of categories for which six consecutive correct
responses were achieved (eight was the maximum number of categories that could be achieved). Total errors
were defined as the total number of incorrect responses27.
N‑back task. The N-back task is used to assess working memory via software that requires participants to
continually update their mental set while responding to previously seen stimuli (i.e., numbers)14, 28, 29. The test
comprises the 0- and 1-back conditions, with 14 trials in each condition; the stimulus duration and inter-stim-
ulus interval was 0.4 s and 1.4 s, respectively. Participants responded to stimuli using the numeric keypad of
a computer. Performance was measured as % correct (Hits + Correct Rejections/Total Stimuli × 100) and the
mean reaction time for correct hits. In the N-back task, the participants monitored a series of number stimuli.
They were asked to indicate when the presented number was the same as the previously presented number. The
stimuli consisted of numbers (2, 4, 6, or 8) shown in a random sequence, which were displayed at the points of
a diamond-shaped box28.
Scientific Reports | (2021) 11:7039 | https://doi.org/10.1038/s41598-021-85817-y 2
Vol:.(1234567890)www.nature.com/scientificreports/
Statistical analyses. All data are expressed as the mean ± standard deviation (SD). We compared the
data on smoking status, alcohol intake, hypertension, diabetes mellitus, hyperlipidaemia, Epworth sleepiness
scale score, Pittsburgh sleep quality index, sleep–wake rhythm, home sleep apnoea test results, and cognitive
performance parameters between the groups (men vs. women, and participants with a TST < 8 h vs. those with a
TST ≥ 8 h30) using the chi-square test or non-paired t-test. Pearson’s correlation analyses were performed to
evaluate the relationships between the parameters of sleep and cognitive function. Additionally, multiple regres-
sion analyses including the stepwise forward selection method were performed to determine the independent
parameters that correlated with cognitive function (as assessed by the HDS-R, TMT-B, WCST, and N-back task),
in relation to age, sex, TST, WASO, sleep timing, SD of sleep timing, AHI, and minimum S pO2. A probability
value less than 0.05 was considered statistically significant. All statistical analyses were performed using SPSS
Statistics version 25.0 (IBM Corporation, Armonk, New York, USA).
Results
Demographic/sleep parameters and cognitive function in both sexes. Table 1 summarizes par-
ticipants’ characteristics and the results of the actigraphy, home sleep apnoea test, and cognitive function tests
based on the HDS-R, TMT-B, WCST, and N-back task for both sexes.
Comparison of the sleep and cognitive performance parameters between men and women showed that the
WASO was significantly longer, and sleep efficiency was significantly lower, in men than in women (WASO:
47.1 ± 47.2 min vs. 25.6 ± 24.7 min, p = 0.021; sleep efficiency: 90.2 ± 8.9% vs. 94.2 ± 4.9%, p = 0.023). Smoking and
alcohol intake were more frequent in men than in women (smoking: 23.1% vs. 0.0%, p = 0.011; alcohol intake:
59.0% vs. 12.5%, p < 0.001). However, the prevalence of hyperlipidaemia was lower in men than in women (12.8%
vs. 45.8%, p = 0.003). The prevalence of hypertension and diabetes mellitus did not significantly differ between
the sexes (Table 1).
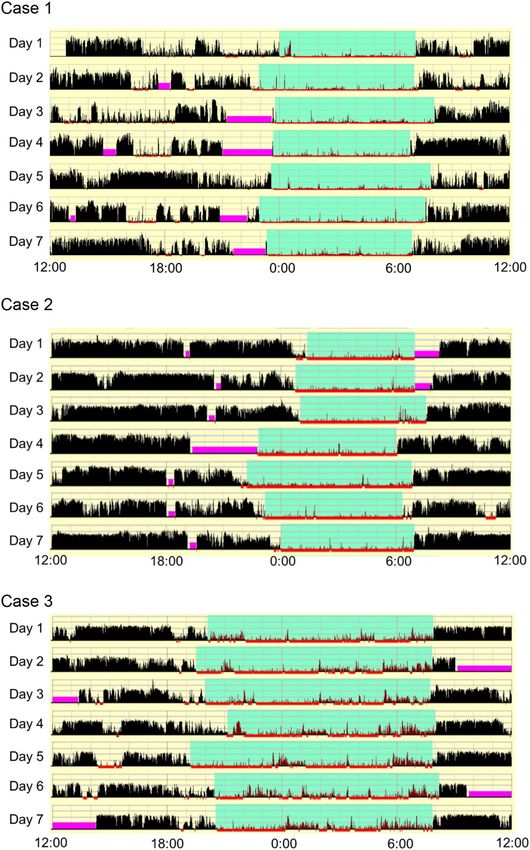
Figure 1 shows the 24-h actigrams for three cases. Cases 1, 2, and 3 are representative of a normal data set,
an irregular sleep–wake rhythm, and a long sleep time, respectively (Table 2). With regard to the cognitive
function tests, the % correct on the 1-back task was lower in case 3 than in cases 1 and 2 (case 1: 100%; case 2:
96.4%; case 3: 32.1%). Additionally, the category achievement on the WCST and total error on WCST was lower
and higher, respectively, in case 2 than in case 1 (category achievement: case 1: 6; case 2: 4; case 3: 5; total errors:
case 1: 12; case 2; 21; case 3: 18).
TST based on actigraphy and cognitive function. The % correct on the 1-back task was significantly
lower in participants with a TST ≥ 8 h than in those with a TST < 8 h (63.1 ± 18.7% vs. 78.1 ± 19.9%, p = 0.012).
The WASO was significantly longer, and sleep efficiency was significantly lower, in participants with a TST ≥ 8 h
than in those with a TST < 8 h (WASO: 80.5 ± 56.4 min vs. 25.9 ± 23.9 min, p = 0.002; sleep efficiency: 85.3 ± 10.1%
vs. 93.7 ± 5.8%, p = 0.007). The bedtime was significantly earlier, and the wake-up time was significantly later, in
participants with a TST ≥ 8 h than in those with a TST < 8 h (bedtime: 21:48 ± 00:49 vs. 23:09 ± 01:10, p < 0.001;
wake-up time: 06:50 ± 00:35 vs. 05:58 ± 01:15, p < 0.001). There were more smokers among participants with
a TST ≥ 8 h than among those with a TST < 8 h (33.3% vs. 8.3%, p = 0.016) (Table 3).
Relationships between cognitive function and demographic/sleep parameters. The HDS-R
score was significantly correlated with the TST and WASO (TST: r = − 0.266, p = 0.035; WASO: r = − 0.298,
p = 0.018), and sex was a significant factor of the HDS-R score (β = − 0.293, p = 0.026). The TMT-B score was
significantly correlated with the sleep timing (r = − 0.281, p = 0.026), which was a significant factor of the TMT-B
score (β = − 0.298, p = 0.027). The category achievement on the WCST was significantly correlated with the SD of
sleep timing (r = − 0.303, p = 0.016). Total errors on the WCST were significantly correlated with the SD of sleep
timing (r = 0.277, p = 0.028). The % correct on the 1-back task was significantly correlated with the TST, WASO,
and sleep timing (TST: r = − 0.357, p = 0.004; WASO: r = − 0.257, p = 0.042; sleep timing: r = 0.262, p = 0.038).
The TST and sleep timing were significant factors of the % correct on the 1-back task (TST: β = − 0.341, p = 0.048;
sleep timing: β = 0.265, p = 0.037). No significant correlations were found between the AHI or minimum S pO2
and the parameters of the HDS-R, TMT-B, WCST, or N-back task (Table 4).
Discussion
We found that the % correct on the 1-back task was significantly lower in participants with a TST ≥ 8 h than
in those with a TST < 8 h. Additionally, the sleep timing was associated with executive function and working
memory. Our findings suggest that a long sleep time and an irregular sleep–wake rhythm are involved in declines
in executive function and working memory in older people. Sleep parameters based on actigraphy might serve
as novel noninvasive indicators of cognitive decline in the geriatric population.
This study showed that the % correct on the 1-back task and the HDS-R score, as a global measurement of
cognitive function, were significantly correlated with the TST and WASO in community-dwelling older men
and women without heart failure, coronary artery disease, or stroke. In 782 older community-dwelling women,
a longer TST (≥ 459.8 min) was concomitant with a low modified MMSE score, and the WASO was related to
greater impairment in delayed recall, low semantic fluency, and digit s pan31. A cross-sectional analysis of 3132
older community-dwelling men revealed a link between both a long TST (> 8 h) and the WASO, as determined
using actigraphy, and a slightly poor modified MMSE score32. A prospective cohort study of 737 community-
dwelling older people (76% women) without dementia demonstrated that sleep fragmentation was a significant
risk factor for the subsequent development of Alzheimer’s disease over a follow-up period of up to 6 years33.
Therefore, we believe that sleep fragmentation and a long sleep likely contribute to an increased risk of working
memory decline.
Scientific Reports | (2021) 11:7039 | https://doi.org/10.1038/s41598-021-85817-y 3
Vol.:(0123456789)www.nature.com/scientificreports/
Total (n = 63) Men (n = 39) Women (n = 24) p
Demographics
Age (years) 70.4 ± 4.8 70.0 ± 4.1 71.2 ± 5.9 0.347
Height (cm) 160.9 ± 8.4 166.2 ± 5.4 152.3 ± 4.5 < 0.001
Weight (kg) 59.8 ± 9.9 64.4 ± 8.2 52.4 ± 7.8 < 0.001
BMI (kg/m2) 23.1 ± 3.1 23.4 ± 3.1 22.6 ± 3.2 0.351
Risk factors
Smoking (%) 14.3 23.1 0.0 0.011
Alcohol intake (%) 41.3 59.0 12.5 < 0.001
Hypertension (%) 69.8 71.8 66.7 0.667
Diabetes mellitus (%) 6.3 2.6 12.5 0.116
Hyperlipidaemia (%) 25.4 12.8 45.8 0.003
Sleep tests
Questionnaires
Epworth sleepiness scale 5.8 ± 4.1 5.6 ± 4.1 6.1 ± 4.2 0.634
Pittsburgh sleep quality index 5.3 ± 3.0 5.3 ± 3.2 5.2 ± 2.5 0.856
Actigraphy
TST (min) 441.6 ± 74.8 452.4 ± 79.8 424.1 ± 63.5 0.146
Sleep efficiency (%) 91.7 ± 7.8 90.2 ± 8.9 94.2 ± 4.9 0.023
WASO (min) 38.9 ± 41.2 47.1 ± 47.2 25.6 ± 24.7 0.021
Bedtime 22:50 ± 01:14 22:45 ± 01:25 22:57 ± 00:52 0.476
Wake-up time 06:10 ± 01:11 06:16 ± 01:14 06:00 ± 01:07 0.385
Sleep timing 02:30 ± 01:02 02:31 ± 01:09 02:29 ± 00:51 0.905
SD of sleep timing (min) 28.7 ± 12.6 28.5 ± 12.8 29.2 ± 12.6 0.834
Home sleep apnoea test
AHI (/h) 10.0 ± 9.6 11.3 ± 10.9 8.1 ± 6.7 0.160
Minimum SpO2 (%) 86.0 ± 5.2 86.0 ± 5.3 86.0 ± 5.2 0.994
Cognitive function tests
HDS-R score 28.0 ± 2.2 27.5 ± 2.3 28.9 ± 1.5 0.005
TMT-B (s) 109.1 ± 36.8 107.4 ± 38.6 111.9 ± 34.4 0.643
WCST
Category achievement 4.8 ± 1.1 5.0 ± 1.0 4.6 ± 1.4 0.240
Total errors 14.6 ± 4.5 13.8 ± 3.3 15.8 ± 5.8 0.084
N-back task
0-back task
% correct 97.1 ± 4.7 96.8 ± 4.5 97.6 ± 5.0 0.494
Reaction time (ms) 697.8 ± 110.3 707.6 ± 110.9 681.9 ± 109.7 0.372
1-back task
% correct 74.5 ± 20.5 76.3 ± 21.2 71.6 ± 19.4 0.376
Reaction time (ms) 954.9 ± 226.5 945.7 ± 237.2 969.8 ± 212.0 0.684
Table 1. Demographic/sleep parameters and cognitive function in both sexes. Data are expressed as
the mean ± standard deviation. BMI body mass index, TST total sleep time, WASO wake after sleep onset, SD
standard deviation, AHI apnoea–hypopnea index, HDS-R revised Hasegawa’s dementia scale, TMT-B trail
making test B, WCST Wisconsin card sorting test.
Smoking was a risk factor for dementia in later life (age > 65 years)34. In our study, smoking was more fre-
quent in participants who slept ≥ 8 h than in those who slept < 8 h. According to a previous study involving 1115
older Chinese adults from three communities, a longer sleep duration was recorded in smokers than in non-
smokers4. Furthermore, smoking was related to long durations of sleep among women35. It was also concomitant
with disturbances in sleep architecture, including a longer latency to sleep onset and a shift towards lighter sleep
stages in a cohort study of 6400 participants aged above 40 years36. Our results suggest that smoking plays an
important role in sleep fragmentation and long sleep time, both of which lead to cognitive decline in the long run.
A long sleep duration was related to increased m ortality6 and an elevated pulse wave velocity30. Both short
and long sleep durations were associated with an increased risk of hypertension and a therosclerosis37–39. Hyper-
tension has been recognized as a risk factor for cardiovascular disease40, 41 and dementia in midlife34 but not
in older age42. We did not find any difference in the incidence of hypertension, diabetes mellitus, or hyperlipi-
daemia between participants who slept ≥ 8 h and those who slept < 8 h. A long sleep duration was reported to
not influence the prevalence of hypertension or diabetes m ellitus30, 31, which is similar to our findings. Thus,
the relationship between a long sleep duration and the prevalence of lifestyle diseases in older people has not
Scientific Reports | (2021) 11:7039 | https://doi.org/10.1038/s41598-021-85817-y 4
Vol:.(1234567890)www.nature.com/scientificreports/
Figure 1. Actigram of three representative cases. The horizontal axis reflects the time over a 24-h period
(from noon to noon). The vertical axis reflects the amount of activity recorded by the actigraph, with the black
bars indicating the movement activity within one min. The light blue section indicates the period in which
the participant was thought to be in bed, and the pink sections indicate the periods in which the participant
had apparently removed the actigraphy instrument.
Scientific Reports | (2021) 11:7039 | https://doi.org/10.1038/s41598-021-85817-y 5
Vol.:(0123456789)www.nature.com/scientificreports/
Sleep parameters Case 1 Case 2 Case 3
TST (min) 471.9 413.7 706.0
Sleep efficiency (%) 98.4 97.5 66.1
WASO (min) 7.6 10.0 227.6
Bedtime 23:28 23:55 20:09
Wake-up time 07:19 06:48 07:54
Sleep timing 03:24 03:22 02:02
SD of sleep timing (min) 20.7 47.8 22.3
Table 2. Sleep parameters based on actigraphy of three representative cases. TST total sleep time, WASO wake
after sleep onset, SD standard deviation.
TST < 8 h (n = 48) TST ≥ 8 h (n = 15) p
Demographics
Age (years) 70.5 ± 4.9 70.3 ± 5.0 0.931
Male (%) 60.4 66.7 0.663
Height (cm) 160.2 ± 8.4 162.8 ± 8.7 0.330
Weight (kg) 59.9 ± 10.1 59.7 ± 9.8 0.930
BMI (kg/m2) 23.3 ± 3.3 22.4 ± 2.3 0.341
Risk factors
Smoking (%) 8.3 33.3 0.016
Alcohol intake (%) 35.4 60.0 0.091
Hypertension (%) 70.8 66.7 0.759
Diabetes mellitus (%) 6.3 6.7 0.954
Hyperlipidaemia (%) 27.1 20.0 0.582
Sleep tests
Questionnaires
Epworth sleepiness scale 6.6 ± 4.0 3.4 ± 3.5 0.008
Pittsburgh sleep quality index 5.6 ± 3.1 4.2 ± 2.4 0.116
Actigraphy
Sleep efficiency (%) 93.7 ± 5.8 85.3 ± 10.1 0.007
WASO (min) 25.9 ± 23.9 80.5 ± 56.4 0.002
Bedtime 23:09 ± 01:10 21:48 ± 00:49 < 0.001
Wake-up time 05:58 ± 01:15 06:50 ± 00:35 < 0.001
Sleep timing 02:33 ± 01:08 02:19 ± 00:34 0.289
SD of sleep timing (min) 29.4 ± 13.3 26.5 ± 10.4 0.434
Home sleep apnoea test
AHI (/h) 10.3 ± 9.8 9.2 ± 9.2 0.702
Minimum SpO2 (%) 85.8 ± 5.2 86.6 ± 5.6 0.586
Cognitive function tests
HDS-R score 28.3 ± 2.0 27.2 ± 2.5 0.101
TMT-B (s) 105.2 ± 32.8 121.5 ± 46.5 0.137
WCST
Category achievement 4.8 ± 1.1 5.0 ± 1.1 0.541
Total errors 15.1 ± 4.7 13.1 ± 3.6 0.135
N-back task
0-back task
% correct 97.2 ± 4.8 96.9 ± 4.5 0.839
Reaction time (ms) 701.7 ± 112.4 685.4 ± 105.7 0.622
1-back task
% correct 78.1 ± 19.9 63.1 ± 18.7 0.012
Reaction time (ms) 949.5 ± 220.6 972.1 ± 251.6 0.738
Table 3. Comparison of demographic/sleep parameters and cognitive function by TST. Data are expressed
as the mean ± standard deviation. TST total sleep time, BMI body mass index, WASO wake after sleep onset,
SD standard deviation, AHI apnoea–hypopnea index, HDS-R revised Hasegawa’s dementia scale, TMT-B trail
making test B, WCST Wisconsin card sorting test.
Scientific Reports | (2021) 11:7039 | https://doi.org/10.1038/s41598-021-85817-y 6
Vol:.(1234567890)www.nature.com/scientificreports/
Simple Multiple Simple Multiple
correlation regression correlation regression
analysis analysis analysis analysis
r p β p r p β p
HDS-R TMT-B
Age − 0.120 0.349 − 0.088 0.491 0.208 0.103 0.219 0.104
Sex − 0.293 0.026 − 0.075 0.576
TST − 0.266 0.035 − 0.241 0.164 0.104 0.417 − 0.012 0.949
WASO − 0.298 0.018 0.003 0.986 0.078 0.541 0.065 0.729
Sleep timing − 0.082 0.522 − 0.103 0.417 − 0.281 0.026 − 0.298 0.027
SD of sleep timing − 0.167 0.190 − 0.241 0.079 − 0.040 0.755 − 0.132 0.353
AHI − 0.157 0.220 0.011 0.941 0.017 0.893 0.179 0.243
Minimum SpO2 0.130 0.310 0.130 0.400 0.091 0.477 0.193 0.235
WCST Category achievement Total errors
Age 0.051 0.694 0.067 0.619 0.025 0.844 0.026 0.847
Sex 0.209 0.125 − 0.236 0.087
TST 0.028 0.828 0.099 0.586 − 0.105 0.415 − 0.128 0.484
WASO − 0.125 0.327 − 0.227 0.235 0.023 0.859 0.136 0.477
Sleep timing 0.101 0.431 0.040 0.762 − 0.017 0.895 0.035 0.791
SD of sleep timing − 0.303 0.016 − 0.212 0.140 0.277 0.028 0.216 0.136
AHI − 0.061 0.633 − 0.111 0.469 0.046 0.719 0.090 0.560
Minimum SpO2 − 0.075 0.561 − 0.148 0.365 0.053 0.681 0.130 0.426
0-back task % correct Reaction time
Age − 0.026 0.839 0.008 0.953 0.066 0.609 0.129 0.354
Sex − 0.038 0.788 0.127 0.368
TST − 0.210 0.098 − 0.138 0.470 − 0.046 0.719 − 0.068 0.715
WASO − 0.167 0.190 − 0.085 0.671 − 0.021 0.872 − 0.069 0.726
Sleep timing 0.080 0.535 0.070 0.616 − 0.144 0.261 − 0.173 0.209
SD of sleep timing 0.052 0.686 0.061 0.683 0.071 0.582 0.015 0.920
AHI 0.013 0.919 − 0.003 0.983 0.141 0.271 0.228 0.155
Minimum SpO2 − 0.035 0.786 − 0.037 0.829 0.038 0.768 0.132 0.433
1-back task % correct Reaction time
Age − 0.145 0.257 − 0.053 0.675 0.057 0.655 0.037 0.790
Sex 0.210 0.102 − 0.092 0.517
TST − 0.357 0.004 − 0.341 0.048 0.126 0.327 0.175 0.354
WASO − 0.257 0.042 − 0.043 0.809 0.065 0.614 − 0.073 0.713
Sleep timing 0.262 0.038 0.265 0.037 − 0.131 0.308 − 0.144 0.299
SD of sleep timing − 0.040 0.758 − 0.002 0.989 0.076 0.556 0.056 0.708
AHI − 0.091 0.479 − 0.203 0.162 0.120 0.347 0.209 0.195
Minimum SpO2 − 0.027 0.834 − 0.077 0.614 0.027 0.832 0.081 0.635
Table 4. Relationships among cognitive function and demographic/sleep parameters. HDS-R revised
Hasegawa’s dementia scale, TMT-B trail making test B, TST total sleep time, WASO wake after sleep onset, SD
standard deviation, AHI apnoea-hypopnea index, WCST Wisconsin card sorting test.
yet been clarified. Further studies could address the impact of an objective long sleep time on risk factors for
cardiovascular disease and cognitive decline.
An irregular sleep–wake rhythm was associated with reduced executive function and working memory in
community-dwelling older adults in our study. A prospective observation study in 1287 older women demon-
strated that executive function alone was positively associated with circadian rhythm measures, independent of
the baseline MMSE s core43. Tranah et al. reported that a reduced affinity to the circadian activity rhythm was
a risk factor for developing dementia and mild cognitive impairment (MCI) in 1282 older w omen44, and in a
study on osteoporotic features, they also showed that older women with circadian rhythm abnormalities had
a higher mortality risk in a cohort of 3027 older community-dwelling w omen45. Circadian clock disruption
promotes oxidative stress, inflammation, and a loss of synaptic homeostasis. Wakefulness increases sympathetic
output, suppressing the functioning of the glymphatic system. Together, the aforementioned factors promote
neurodegeneration46. Hence, an evaluation of the sleep–wake rhythm may help facilitate the early detection and
prevention of sleep-related cognitive declines in older people.
With regard to sleep disordered breathing (SDB), the AHI and minimum S pO2 were not correlated with the
parameters of the HDS-R, TMT-B, WCST, or N-back task in our study. In a cross-sectional study of 718 older
Scientific Reports | (2021) 11:7039 | https://doi.org/10.1038/s41598-021-85817-y 7
Vol.:(0123456789)www.nature.com/scientificreports/
men aged 79–97 years47 and in our recent study48, no association was found between the AHI and performance
on cognitive tests, including tests of memory function, concentration, and attention. Furthermore, undiagnosed
SDB had a limited impact on cognitive function in the cohorts of generally healthy older adults and those with
severe cases49. Severe hypoxia and subsequent frequent arousals during sleep contribute to the incidence of car-
diovascular disease50,51. Accordingly, age-dependent SDB without severe hypoxia or frequent arousal in older
people might not lead to cognitive decline.
We observed sex-based differences in sleep efficiency, the WASO, smoking, alcohol intake, and
the HDS-R score. The higher prevalence of obstructive sleep apnoea in men than in women might play a role52,
but there was no significant sex-based difference in the AHI or minimum SpO2 in this study. In a community-
based study, a longer WASO and severe sleep fragmentation were reported in men than in women53. The preva-
lence of smoking and alcohol consumption was found to be higher in men than in women in a cohort of 4115
Chinese people54. The results of these previous reports seem consistent with our findings. The HDS-R score
was significantly lower in men than in women, and multiple regression analyses revealed that the sex was a sig-
nificant factor of the HDS-R score. Dementia was more prevalent in women than in men in studies conducted
in Japan55,56, but there was no significant sex-based difference in the prevalence or incidence of dementia due to
Alzheimer’s disease according to a systematic review and meta-analysis of population-based studies57. However,
the prevalence of MCI has been found to be higher in men than in women58,59. Considering the affinity of men
for habitual drinking or smoking and/or the high prevalence of SDB in middle aged population, the consequent
sleep fragmentation or reduced sleep quality may promote the occurrence of cognitive decline and MCI ear-
lier in life. Sex-based differences in the potential risk factors and the prevalence of MCI and dementia should
be investigated in future research.
The present study has some methodological limitations. First, the study population was relatively small. Sec-
ond, this was an observational study. Third, we could not measure circadian activity rhythm variables (amplitude,
mesor, and robustness) by actigraph which was utilized in the present study. Although weaker circadian patterns
are associated with ageing and cognitive declining in older adults, disrupted circadian activity rhythms could
be an early indicator of executive function d eclines43. Future trials with larger sample sizes are warranted to
elucidate the effect of a long sleep and the circadian activity rhythm on executive function and working memory
in the older population.
Conclusions
Our findings revealed that a long sleep time was associated with a reduced working memory alone, whereas
an irregular sleep–wake rhythm had adverse effects on executive function and working memory in community-
dwelling older people. Therefore, evaluations of the sleep–wake rhythm and the objective TST along with SDB
screening at home could provide valuable insights into cognitive decline in older people.
Received: 8 November 2020; Accepted: 24 February 2021
References
1. Yaffe, K., Falvey, C. M. & Hoang, T. Connections between sleep and cognition in older adults. Lancet Neurol. 13, 1017–1028 (2014).
2. Ohayon, M. M., Carskadon, M. A., Guilleminault, C. & Vitiello, M. V. Meta-analysis of quantitative sleep parameters from child-
hood to old age in healthy individuals: Developing normative sleep values across the human lifespan. Sleep 27, 1255–1273 (2004).
3. Wolkove, N., Elkholy, O., Baltzan, M. & Palayew, M. Sleep and aging: 1. Sleep disorders commonly found in older people. CMAJ
176, 1299–1304 (2007).
4. Ding, G., Li, J. & Lian, Z. Both short and long sleep durations are associated with cognitive impairment among community-dwelling
Chinese older adults. Medicine (Baltimore) 99, e19667 (2020).
5. Lo, J. C., Groeger, J. A., Cheng, G. H., Dijk, D. J. & Chee, M. W. Self-reported sleep duration and cognitive performance in older
adults: A systematic review and meta-analysis. Sleep Med. 17, 87–98 (2016).
6. Grandner, M. A. & Drummond, S. P. Who are the long sleepers? Towards an understanding of the mortality relationship. Sleep
Med. Rev. 11, 341–360 (2007).
7. Schmidt, C., Peigneux, P. & Cajochen, C. Age-related changes in sleep and circadian rhythms: Impact on cognitive performance
and underlying neuroanatomical networks. Front. Neurol. 3, 118 (2012).
8. Kondratova, A. A. & Kondratov, R. V. The circadian clock and pathology of the ageing brain. Nat. Rev. Neurosci. 13, 325–335 (2012).
9. Ju, Y. E. et al. Sleep quality and preclinical Alzheimer disease. JAMA Neurol. 70, 587–593 (2013).
10. Gehrman, P. et al. The relationship between dementia severity and rest/activity circadian rhythms. Neuropsychiatr. Dis. Treat. 1,
155–163 (2005).
11. Imai, Y. & Hasegawa, K. The revised Hasegawa’s dementia scale (HDS-R): Evaluation of its usefulness as a screening test for
dementia. J. Hong Kong Coll. Psychiatr. 4, 20–24 (1994).
12. Tombaugh, T. N. Trail Making Test A and B: Normative data stratified by age and education. Arch. Clin. Neuropsychol. 19, 203–214
(2004).
13. Alvarez, J. A. & Emory, E. Executive function and the frontal lobes: A meta-analytic review. Neuropsychol. Rev. 16, 17–42 (2006).
14. Callicott, J. H. et al. Physiological dysfunction of the dorsolateral prefrontal cortex in schizophrenia revisited. Cereb. Cortex 10,
1078–1092 (2000).
15. Owen, A. M., McMillan, K. M., Laird, A. R. & Bullmore, E. N-back working memory paradigm: A meta-analysis of normative
functional neuroimaging studies. Hum. Brain Mapp. 25, 46–59 (2005).
16. Gilbert, S. J. & Burgess, P. W. Executive function. Curr. Biol. 18, R110–R114 (2008).
17. Johns, M. W. A new method for measuring daytime sleepiness: The Epworth sleepiness scale. Sleep 14, 540–545 (1991).
18. Buysse, D. J., Reynolds, C. F. 3rd., Monk, T. H., Berman, S. R. & Kupfer, D. J. The Pittsburgh Sleep Quality Index: A new instrument
for psychiatric practice and research. Psychiatry Res. 28, 193–213 (1989).
19. Kondo, T. et al. Smoking and smoking cessation in relation to all-cause mortality and cardiovascular events in 25,464 healthy male
Japanese workers. Circ. J. 75, 2885–2892 (2011).
20. Cho, Y. et al. Alcohol intake and cardiovascular risk factors: A Mendelian randomisation study. Sci. Rep. 5, 18422 (2015).
Scientific Reports | (2021) 11:7039 | https://doi.org/10.1038/s41598-021-85817-y 8
Vol:.(1234567890)www.nature.com/scientificreports/
21. Umemura, S. et al. The Japanese Society of Hypertension Guidelines for the Management of Hypertension (JSH 2019). Hypertens.
Res. 42, 1235–1481 (2019).
22. Morgenthaler, T. et al. Practice parameters for the use of actigraphy in the assessment of sleep and sleep disorders: An update for
2007. Sleep 30, 519–529 (2007).
23. Cole, R. J., Kripke, D. F., Gruen, W., Mullaney, D. J. & Gillin, J. C. Automatic sleep/wake identification from wrist activity. Sleep
15, 461–469 (1992).
24. Youngstedt, S. D., Kripke, D. F., Elliott, J. A. & Klauber, M. R. Circadian abnormalities in older adults. J. Pineal Res. 31, 264–272
(2001).
25. Osafune, M., Deguchi, K. & Abe, K. Ideal combination of dementia screening tests. Nihon Ronen Igakkai Zasshi 51, 178–183 (2014).
26. Tomida, K. et al. Relationship of psychopathological symptoms and cognitive function to subjective quality of life in patients with
chronic schizophrenia. Psychiatry Clin. Neurosci. 64, 62–69 (2010).
27. Banno, M. et al. Wisconsin Card Sorting Test scores and clinical and sociodemographic correlates in Schizophrenia: Multiple
logistic regression analysis. BMJ Open 2, e001340 (2012).
28. Callicott, J. H. et al. Physiological characteristics of capacity constraints in working memory as revealed by functional MRI. Cereb.
Cortex 9, 20–26 (1999).
29. Jacola, L. M. et al. Clinical utility of the N-back task in functional neuroimaging studies of working memory. J. Clin. Exp. Neu‑
ropsychol. 36, 875–886 (2014).
30. Niijima, S. et al. Long sleep duration: A nonconventional indicator of arterial stiffness in Japanese at high risk of cardiovascular
disease: the J-HOP study. J. Am. Soc. Hypertens. 10, 429–437 (2016).
31. Spira, A. P. et al. Actigraphic sleep duration and fragmentation in older women: Associations with performance across cognitive
domains. Sleep 40, zsx073 (2017).
32. Blackwell, T. et al. Association of sleep characteristics and cognition in older community-dwelling men: The MrOS sleep study.
Sleep 34, 1347–1356 (2011).
33. Lim, A. S., Kowgier, M., Yu, L., Buchman, A. S. & Bennett, D. A. Sleep fragmentation and the risk of incident Alzheimer’s disease
and cognitive decline in older persons. Sleep 36, 1027–1032 (2013).
34. Livingston, G. et al. Dementia prevention, intervention, and care. Lancet 390, 2673–2734 (2017).
35. Kripke, D. F., Garfinkel, L., Wingard, D. L., Klauber, M. R. & Marler, M. R. Mortality associated with sleep duration and insomnia.
Arch. Gen. Psychiatry 59, 131–136 (2002).
36. Zhang, L., Samet, J., Caffo, B. & Punjabi, N. M. Cigarette smoking and nocturnal sleep architecture. Am. J. Epidemiol. 164, 529–537
(2006).
37. Grandner, M. et al. Sleep duration and hypertension: Analysis of > 700,000 adults by age and sex. J. Clin. Sleep Med. 14, 1031–1039
(2018).
38. Vgontzas, A. N., Fernandez-Mendoza, J., Liao, D. & Bixler, E. O. Insomnia with objective short sleep duration: The most biologi-
cally severe phenotype of the disorder. Sleep Med. Rev. 17, 241–254 (2013).
39. Nakazaki, C. et al. Association of insomnia and short sleep duration with atherosclerosis risk in the elderly. Am. J. Hypertens. 25,
1149–1155 (2012).
40. Wright, J. T. Jr. et al. A randomized trial of intensive versus standard blood-pressure control. N. Engl. J. Med. 373, 2103–2116
(2015).
41. Yildiz, M. et al. Left ventricular hypertrophy and hypertension. Prog. Cardiovasc. Dis. 63, 10–21 (2020).
42. Mansukhani, M. P., Kolla, B. P. & Somers, V. K. Hypertension and cognitive decline: implications of obstructive sleep apnea. Front.
Cardiovasc. Med. 6, 96 (2019).
43. Walsh, C. M. et al. Weaker circadian activity rhythms are associated with poorer executive function in older women. Sleep 37,
2009–2016 (2014).
44. Tranah, G. J. et al. Circadian activity rhythms and risk of incident dementia and mild cognitive impairment in older women. Ann.
Neurol. 70, 722–732 (2011).
45. Tranah, G. J. et al. Circadian activity rhythms and mortality: The study of osteoporotic fractures. J. Am. Geriatr. Soc. 58, 282–291
(2010).
46. Musiek, E. S. & Holtzman, D. M. Mechanisms linking circadian clocks, sleep, and neurodegeneration. Science 354, 1004–1008
(2016).
47. Foley, D. J. et al. Sleep-disordered breathing and cognitive impairment in elderly Japanese-American men. Sleep 26, 596–599
(2003).
48. Kato, K. et al. Effects of sleep-disordered breathing and hypertension on cognitive function in elderly adults. Clin. Exp. Hypertens.
42, 250–256 (2020).
49. Sforza, E. et al. Cognitive function and sleep related breathing disorders in a healthy elderly population: The SYNAPSE study. Sleep
33, 515–521 (2010).
50. Noda, A. et al. Effect of aging on cardiac and electroencephalographic arousal in sleep apnea/hypopnea syndrome. J. Am. Geriatr.
Soc. 43, 1070–1071 (1995).
51. Noda, A., Yasuma, F., Okada, T. & Yokota, M. Influence of movement arousal on circadian rhythm of blood pressure in obstructive
sleep apnea syndrome. J. Hypertens. 18, 539–544 (2000).
52. Senaratna, C. V. et al. Prevalence of obstructive sleep apnea in the general population: A systematic review. Sleep Med. Rev. 34,
70–81 (2017).
53. McSorley, V. E., Bin, Y. S. & Lauderdale, D. S. Associations of sleep characteristics with cognitive function and decline among older
adults. Am. J. Epidemiol. 188, 1066–1075 (2019).
54. Wang, S. et al. Gender differences in general mental health, smoking, drinking and chronic diseases in older adults in Jilin province,
China. Psychiatry Res. 251, 58–62 (2017).
55. Sekita, A. et al. Trends in prevalence of Alzheimer’s disease and vascular dementia in a Japanese community: The Hisayama Study.
Acta Psychiatr. Scand. 122, 319–325 (2010).
56. Ikejima, C. et al. Multicentre population-based dementia prevalence survey in Japan: A preliminary report. Psychogeriatrics 12,
120–123 (2012).
57. Fiest, K. M. et al. The prevalence and incidence of dementia due to Alzheimer’s disease: A systematic review and meta-analysis.
Can. J. Neurol. Sci. 43, S51–S82 (2016).
58. Petersen, R. C. et al. Prevalence of mild cognitive impairment is higher in men. The Mayo Clinic Study of Aging. Neurology 75,
889–897 (2010).
59. Roberts, R. O. et al. The incidence of MCI differs by subtype and is higher in men: The Mayo Clinic Study of Aging. Neurology 78,
342–351 (2012).
Acknowledgements
The study was supported by the Japan Society for the Promotion of Science (KAKENHI Grant Number 25282210)
and Chubu University research grant (Number 19M27A1, 20M25A1).
Scientific Reports | (2021) 11:7039 | https://doi.org/10.1038/s41598-021-85817-y 9
Vol.:(0123456789)www.nature.com/scientificreports/
Author contributions
A.N. designed the present study. M.O. and A.N. wrote the manuscript. A.N., M.O., K.I., H.N. and N.O. collected
the data. M.O. and A.N. analyzed the data. A.N., M.O. and K.I. contributed the Interpretation of the results. K.T.,
S.M., F.Y. and A.S. critically revised the previous versions for of the manuscript. All authors read and approved
the final version of the manuscript.
Competing interests
The authors declare no competing interests.
Additional information
Correspondence and requests for materials should be addressed to A.N.
Reprints and permissions information is available at www.nature.com/reprints.
Publisher’s note Springer Nature remains neutral with regard to jurisdictional claims in published maps and
institutional affiliations.
Open Access This article is licensed under a Creative Commons Attribution 4.0 International
License, which permits use, sharing, adaptation, distribution and reproduction in any medium or
format, as long as you give appropriate credit to the original author(s) and the source, provide a link to the
Creative Commons licence, and indicate if changes were made. The images or other third party material in this
article are included in the article’s Creative Commons licence, unless indicated otherwise in a credit line to the
material. If material is not included in the article’s Creative Commons licence and your intended use is not
permitted by statutory regulation or exceeds the permitted use, you will need to obtain permission directly from
the copyright holder. To view a copy of this licence, visit http://creativecommons.org/licenses/by/4.0/.
© The Author(s) 2021
Scientific Reports | (2021) 11:7039 | https://doi.org/10.1038/s41598-021-85817-y 10
Vol:.(1234567890)You can also read