A biomechanical assessment of running with hallux unstable shoes of different material stiffness
←
→
Page content transcription
If your browser does not render page correctly, please read the page content below
Acta of Bioengineering and Biomechanics                                                                      Original paper
Vol. 21, No. 1, 2019                                                                       DOI: 10.5277/ABB-01309-2019-02

                                  A biomechanical assessment
                             of running with hallux unstable shoes
                                  of different material stiffness

                             QICHANG MEI1, 2, 3, YAODONG GU1, 2, 3*, JUSTIN FERNANDEZ2, 3, 4
                                     1
                                       Faculty of Sports Science, Ningbo University, Ningbo, China.
                                2
                                  Research Academy of Grand Health, Ningbo University, Ningbo, China.
                          3
                            Auckland Bioengineering Institute, University of Auckland, Auckland, New Zealand.
                         4
                            Department of Engineering Science, University of Auckland, Auckland, New Zealand.

     Purpose: Functional footwear with different unstable profiles has been widely used to mimic barefoot condition and offload plantar
loading for pathological or injury prevention. However, little research investigates the effect of unstable structure on particular foot
functions. In this study, a prototype of unstable shoe design with unstable element of different stiffness placed at the hallux (a regional-
ized rocker) was used. The primary objective was to analyse the biomechanical performance of running with hallux unstable shoes,
aiming to potentially stimulate and increase the toe gripping function. Methods: The lower limb kinematics and plantar pressure distribu-
tion were measured to comparatively analyse the soft (SS) and hard (SH) unstable shoes with flat control shoes (CS). Results: The SS
showed increased big toe and reduced forefoot plantar pressure. The SS led to similar lower limb kinematics to baseline CS except for
reduced hip abduction, increased rotation range of motion (ROM), increased peak ankle plantar flexion and ROM. The SH presented
significantly altered lower limb kinematics across hip, knee and ankle, and laterally distributed plantar pressure. Conclusions: Unstable
shoes with soft material led to reduced medial metatarsal loading by increasing the support area and modified joint kinematics minimally.
Unstable shoes with stiffer material presented compensatory kinematic movements across all joints and laterally shifted plantar loading
distribution. These findings may provide implications on toe grip function training for foot pressure off-loading.

Key words: regional unstable shoes, toes gripping function, kinematics, metatarsal loading

                   1. Introduction                                     like hallux valgus [4], present medially focused plan-
                                                                       tar loading to the metatarsal region. Relevant muscle
                                                                       and tendon dysfunction or degenerative conditions [7]
    The human foot is the most distinct adaptation                     are reported to contribute to the alteration of foot
from evolution of upright bipedal locomotion, char-                    biomechanical functions [2]. Furthermore, prolonged
acterised by formation of unique foot structure and                    running activities have led to increased foot and motor
function, including the arch and toes [1], [11]. Differ-               system pathology. The redistributed plantar pressure
ent foot arch types (flat, high and normal) have been                  following long distance running presents increased
reported to present both static and dynamic biome-                     forefoot and decreased toe loading, and more focussed
chanical functions for asymptomatic or pathological                    medial-lateral foot loading [17]. These are considered
feet [6], [16]. Important toe functions, both prehensile               as potential pre-cursor factors before running injuries
and ambulatory, have evolved naturally [9], and are                    manifest.
believed to increase the load bearing area in the push-                    Peripheral neuropathy disorders, especially diabe-
off phase of locomotion [13], [14]. However, foot                      tes mellitus, have been reported with increased risk of
deformities, particularly to the forefoot [14] and toes,               plantar ulceration due to repetitive loading impact
______________________________
   * Corresponding author: Yaodong Gu, Faculty of Sports Science, Ningbo University. No. 818, Fenghua Road, Jiangbei District,
Ningbo, Zhejiang, China. 315211. E-mail: guyaodong@hotmail.com
   Received: January 25th, 2019
   Accepted for publication: March 19th, 2019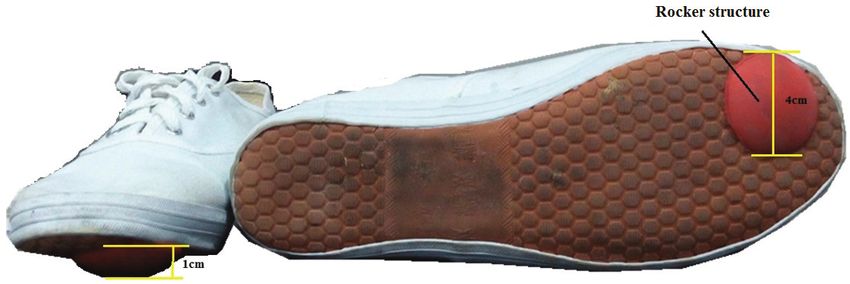
122 Q. MEI et al.
without protective sensation [12]. The success of shoes It was hypothesized that experimental shoes would
with protective functionality is not-conclusive, and stimulate the toe gripping function and present modi-
degenerated intrinsic muscles and deformed natural fied gait patterns, altered kinematic characteristics and
foot shape still are prevalent. Unstable shoes as one reduced forefoot plantar loading.
kind of functional footwear have been proposed based
on perturbation stimuli from unstable structures or
surfaces [18]. Footwear designed to alleviate pressure 2. Materials and methods
to specific plantar regions have been evaluated for
loading transfer and ulceration protection [5], [10],
[15], [22]. Specifically, the Masai Barefoot Technol- Participants
ogy (MBT) shoe with round outsole shape in the ante-
rior-posterior direction has been investigated on the Twenty-five male habitually shod (rearfoot striking)
effect of static postural control, dynamic walking and runners were recruited to join the study. The basic
running gait kinematics alteration, muscles activation, demographic information includes, age: 23.6 ± 2.1 years,
joint loading alleviation and plantar pressure redistri- height: 173 ± 4.6 cm, weight: 68 ± 5.8 kg, foot length:
bution [18], [23], [24], [25]. Based on the functional 255 ± 4.8 mm, measured with the use of a 3D foot
concept of unstable shoes, also known as ‘rocker scanner following previously established protocol
shoes’, specific structures to increase sole thickness [19]. All participants were right-foot dominant, which
and rigidity and perturb medial to lateral plantar sur- was defined by kicking football with preferred leg. No
face have been designed and tested with both genders history of wearing any unstable shoes, rocker shoes or
and different age groups under conditions of standing, toning shoes were reported, with no illness and global
walking or running [5], [10], [15], [21]. or regional motor disorders in the prior half year of
The gripping function of toes, especially hallux, the experiment. Participants with foot deformities or
could perform as actively pushing off the ground in the overpronation, oversupination, high-arched or flat foot
toe-off phase, thus expanding the load-bearing area, were excluded, and all had no history of systematic
which were concentrated in the forefoot region [9]. It sports or running training.
was reported in our previous studies [14], [15] that this This study was approved by the Ethics Committee
function would be highly pronounced among habitually of the Ningbo University (ARGH20150916). Partici-
barefoot population, exhibiting altered plantar pressure pants were informed of the purpose, requirements and
distribution and ankle joint kinematics during running process of this experiment. Written consent was ob-
activities. Despite the multiple studies considering tained before the test from each participant.
plantar unstable stimuli in rocker shoes, there are no
Test Shoes
studies that evaluate the effect of regionalized instabil-
ity integrated with special toe functions. Hence, in this All shoes are EU size of 41 (255 mm). The con-
study, a prototype of hallux unstable shoes was manu- trol (baseline) shoes (CS) selected were normal flat
factured, with an unstable hemisphere structure of dif- shoes with canvas cover and soft sole without heel-
ferent stiffness (Shoes Hard and Shoes Soft) fixed to toe drop and toe spring, which has been used in pre-
the outsole of the hallux region to form unstable stim- viously published studies [5], [10], [15]. The control
uli. The objective was to measure the immediate lower shoes were used as baseline for comparative analysis
extremity kinematics, plantar pressure distribution and of the foot and lower limb kinematics, plantar pres-
gait pattern response of healthy young males running sure and gait pattern versus experimental unstable
with experimental shoes compared to control flat shoes. shoes.
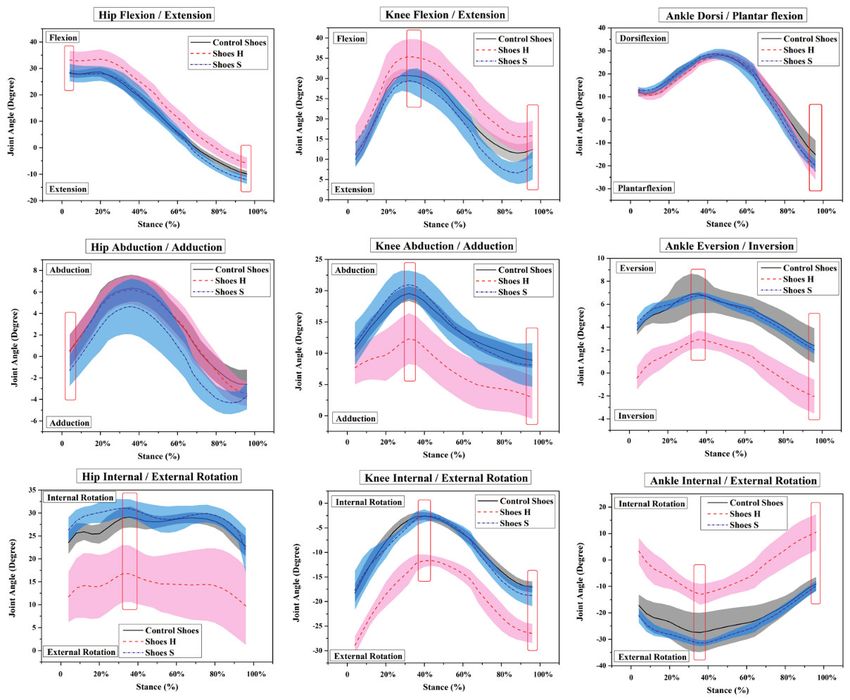
Fig. 1. The prototype of experimental shoes with rocker structure (a hemisphere 4 cm in diameter and 1 cm in height)
to the outsole of hallux region (based on the rocker stiffness, Shoes-S and Shoes-H are defined)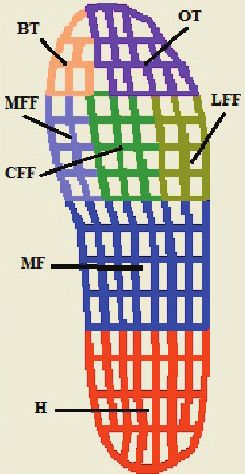
A biomechanical assessment of running with hallux unstable shoes of different material stiffness                 123

    Unstable structure with a hemisphere of 4 cm di-                  An insole plantar pressure measurement system
ameter and 1 cm height, was fixed to the outsole of               (Novel Pedar system, Germany) was used to record
the hallux region to form the experimental shoes in               foot pressure, with insole size of 41 (EU) and model
this study (Fig. 1). Footprint images from foot scanner           W-1644L-1645R, with a frequency of 100 Hz. The
were utilised in cooperation with outsole print of con-           insoles were calibrated with a pressure calibration
trol shoes to define the position of unstable structure           system from 0 to 50 N/cm2, so as to improve data
for experimental shoes, with the spherical vertex lo-             accuracy and reduce experiment error. The insole was
cating right under the central pressing point of hallux.          divided into seven anatomical parts (Fig. 2), including
Unstable stimuli to the hallux was devised with stiff-            heel (H), middle foot (MF), medial forefoot (MFF),
ness variation (Hard & Soft) of rubber elements,                  central forefoot (CFF), lateral forefoot (LFF), big toe
creating shoes-Hard (SH) and shoes-Soft (SS). The                 (BT) and other toes (OT). The BT region of insole
material properties were defined from measured                    was consistent with the location of unstable structure
elastic moduli (E) of Hard (3.3603 MPa) and Soft                  to the outsole of experimental shoes (SS & SH).
(0.3702 MPa) rubbers for unstable structures. The
stiffness values are presented using a Hardness scale
(HA) value of shoes-H (67.92) and shoes-S (8.44) cal-
culated from Eq. (1)
        E = (15.75 + 2.15 HA) / (100 – HA) [3].            (1)

   Test protocol and procedures
    The running tests, including collection of kinematic
and plantar pressure data, were conducted in a motion
analysis laboratory. Participants ran on an indoor track
at self-selected speed. Prior to the test, participants
randomly selected control shoes (CS) or experimental
shoes (SH & SS) to perform five minutes’ warm-up
for familiarization and step adjustment with dominant
(right) foot landing on the force platform, to avoid leg
dominance effect on biomechanical performance [8].
During the test, participants ran randomly with the
three shoe conditions.
    The kinematics test utilized an eight-camera Vicon                   Fig. 2. The seven anatomical regions of plantar insole
3D motion analysis system (Oxford Metrics Ltd., Ox-
ford, UK) and Nexus version 1.8.5 software to collect
                                                                       Data process and statistical analysis
and process lower limb kinematic data at a frequency
of 200 Hz. The Plug-In-Gait model [5], [13], using                    The kinematics and plantar pressure measurements
sixteen reflective markers, was used to capture the               were synchronously conducted. After five minutes’
lower limb kinematic data. Reflective markers (12 mm              warm-up and familiarization, participants were required
in diameter) were used to define the joint centre and             to run on the track with self-selected speed to present
motion axis, including left anterior-superior iliac spine         natural running characteristics and complete collection
(LASI), right anterior-superior iliac spine (RASI), left          of six successful trials of kinematic and plantar pres-
posterior-superior iliac spine (LPSI), right posterior-           sure data. Stance contact time and running speed were
superior iliac spine (RPSI), left thigh (LTHI), right             measured to evaluate gait patterns similar to previous
thigh (RTHI), left knee (LKNE), right knee (RKNE),                studies [5], [6], [8], [13], [16]. Kinematic data collec-
left tibia (LTIB), right tibia (RTIB), left ankle (LANK),         tion included mean joint angle (±SD), peak angle, joint
right ankle (RANK), left heel (LHEE), right heel                  range of motion of hip, knee and ankle during stance
(RHEE), left toe (LTOE) and right toe (RTOE). Par-                [5], [13]. Stance was defined from the vertical ground
ticipants’ height, weight, lower limb length, knee width          reaction force measured by the Kistler force platform
and ankle width were measured and inserted into the               with the threshold of vertical ground reaction force
model for the static model. A 3D Kistler force platform           over 20 N. Plantar pressure measurements included
(1000 Hz) was used to define stance with a threshold              maximal force, peak pressure and force time integral
vertical ground reaction force value of 20 N.                     for each anatomical part to analyse foot biomechanical
124 Q. MEI et al.
function [6], [8], [13], [15], [16]. All six trials of kine- hibited between CS and SS ( p = 0.024) and SS and SH
matic and plantar pressure data were averaged and ( p = 0.031). However, CS and SH revealed no differ-
normalized to minimize the inter-trials’ error. ence ( p = 0.75). The running speed recorded for the
Contact time, running speed, peak angle value, joint three shoe designs were 2.46 ± 0.1 m/s (CS), 2.54
range of motion, maximal force, peak pressure and ± 0.12 m/s (SH) and 2.69 ± 0.11 m/s (SS). A sig-
force time integral were identified for statistical analy- nificant difference was observed between CS and SS
sis using SPSS 17.0 (SPSS, Chicago, IL, US). The ( p = 0.001) and SS and SH ( p = 0.031), however, CS
repeated measures ANOVA and post hoc Bonferroni and SH again showed no difference ( p = 0.217).
test was conducted on the statistics analysis of kine-
matic and plantar pressure while running with control
Lower limb kinematics
shoes (CS) and experimental shoes (SH & SS). The
significance level was set at 0.05. The lower limb kinematics varied significantly un-
der conditions of running with CS, SH and SS (Fig. 3)
for joints angles in stance. Peak angles and range of
3. Results motion (ROM) are presented in the Table 1. Both SS
and CS showed consistent joint motion trends. How-
ever, SS showed significantly smaller peak hip ab-
Participants randomly selected CS, SH and SS to duction angle, larger horizontal ROM, smaller peak
perform the running test with self-selected speed. The knee extension angle, larger peak ankle plantarflexion
stance times of the right foot were 0.263 ± 0.019s angle and larger sagittal ROM than CS. The SH pres-
(CS), 0.262 ± 0.023 s (SH) and 0.248 ± 0.019 s (SS), ents significant differences with CS and SS, as illus-
respectively. There was a significant difference ex- trated in Fig. 3 and Table 1.
Fig. 3. The lower extremity joints angle curve in a stance (the black solid line represents CS,
the red dash line represents SH, and the blue dot line represents SS) with significance highlighted with rectangleA biomechanical assessment of running with hallux unstable shoes of different material stiffness 125
Table 1. The peak angle value and ROM of lower extremity joints (N = 25)
Motion Control
Joints Shoes H Shoes S
[°] Shoes
§¶
Flex. 28.59(1.77) 33.53(3.63) 28.42(3.31)
Ext. –9.88(1.12) –5.9(2.22)§¶ –11.25(1.53)
ROM 38.47(2.89) 39.43(5.85) 39.67(4.84)
Abd. 6.37(1.25)¢ 6.21(1.33)¶ 4.65(2.59)
Hip Add. –2.61(1.39) –3.49(1.13) –4.32(1.05)
ROM 8.98(2.64) 9.7(2.46) 8.97(3.64)
Int. Rot. 29.14(2.29) 16.78(6.26)§¶ 31.08(1.96)
Ext. Rot. 22.74(2.23) 9.72(8.49)§¶ 21.76(6.92)
ROM 6.4(4.52)¢ 7.06(2.23)¶ 9.32(4.96)
Flex. 30.73(1.58) 35.41(4.32)§¶ 29.44(2.88)
Ext. 10(1.91)¢ 14.12(4.28)§¶ 6.64(2.73)
ROM 20.73(3.49) 21.29(8.6) 22.8(5.61)
Abd. 19.54(1.73) 12.33(4.06)§¶ 20.97(2.25)
Knee Add. 8.87(1.21) 2.94(3.44)§¶ 8.12(3.49)
ROM 10.67(2.94) 9.39(3.46)¶ 12.85(5.74)
Int. Rot. –2.59(0.77) –11.68(1.27)§¶ –2.55(1.29)
Ext. Rot. –18.29(1.82) –28.91(1.89)§¶ –18.8(2.15)
ROM 15.7(2.59) 17.23(3.16) 16.25(3.44)
Dorsiflex. 28.04(1.23) 28.17(2.23) 28.73(2.16)
Plantarflex. –15.15(6.22)¢ –22.39(3.66)§ –19.96(2.37)
ROM 43.19(7.45)¢ 50.56(5.89)§ 48.69(4.53)
Ever. 6.89(1.67) 2.92(0.78)§¶ 6.77(0.28)
Ankle Inver. 2.37(1.51) –2.07(1.48)§¶ 2.01(0.38)
ROM 4.52(3.18) 4.99(2.26) 4.76(0.66)
Int. Rot. –9.08(2.62) 10.46(6.82)§¶ –9.81(1.94)
Ext. Rot. –27.44(7.45) –13(3.93)§¶ –31.52(1.08)
ROM 18.36(4.88) 23.46(2.89)§ 21.71(3.02)
Notes: “§”, “¶”, and “¢” indicates significance ( p < 0.05), “§“ representing
significance between CS and SH, “¶” representing significance between SH
and SS, and “¢” representing CS and SS.
Plantar pressure 0.000) and SH ( p = 0.003 and p = 0.003). The force
time integral in BT while running with CS is smaller
The maximal force (a), peak pressure (b) and force
than SH ( p = 0.001) and SS ( p = 0.000). For the OT
time integral (c), all presented significant differences
region, SH showed similar behavior with larger
at the forefoot and toe regions (Fig. 4). In the MFF, SS
maximal force ( p = 0.000 and p = 0.000), peak pres-
showed reduced maximal force compared to CS ( p =
sure ( p = 0.002 and p = 0.000) and force time integral
0.39) and SH ( p = 0.27), with significance in peak
( p = 0.000 and p = 0.005) than CS and SS, respec-
pressure ( p = 0.008 and p = 0.015) and force time
tively.
integral ( p = 0.002 and p = 0.003). In the CFF, the SS
showed smaller maximal force than CS ( p = 0.006)
and SH ( p = 0.017), and reduced peak pressure ( p =
0.002) and force time integral ( p = 0.013), compared 4. Discussion
to CS. The peak pressure of CS in CFF is significantly
larger than that of SH ( p = 0.001). For the LFF,
maximal force ( p = 0.016 and p = 0.015) and force Previous studies have evaluated the biomechanics
time integral ( p = 0.018 and p = 0.015) showed dif- of unstable or rocker shoes across participants of dif-
ference between CS & SH and SS & SH. The peak ferent age, gender and pathology. This study proposed
pressure of SH in LFF was larger ( p = 0.031) than a novel functional footwear prototype integrating the
that of SS. For the BT, the SS showed greater maximal unstable stimuli with toes gripping function, which is
force and peak pressure than CS ( p = 0.000 and p = the first design combining toe function with stimuli of126 Q. MEI et al.
varying stiffness. The purpose of this study was to unstable stimuli conditions [5], but are consistent
investigate the effect of running with hallux focussed among different foot types (flat, high and normal
unstable shoes (SH & SS) compared to baseline con- arch) [6]. Participants in this study were instructed to
trol shoes. The SS presented altered gait pattern run with self-selected speed due to safety risks con-
(stance time and speed) and plantar pressure parame- cerning the use of unstable shoes. SS exhibited higher
ters (maximal force, peak pressure and force time speed and shorter contact time compared to CS and SH,
integral) while retaining a consistent motion trend respectively. These might partly be explained by the
with CS. What else, the SH showed deviated plantar soft stimuli from the SS, which triggers the gripping
pressure and kinematics from CS and SS. function of toes (particular the hallux) during push-off
phase. However, further investigation on muscle ac-
tivities from EMG data may needed. But, the outcome
is consistent with previous findings of shorter contact
time with active toe function [13], which is in contrast
to other studies that show longer contact time with
slower speed when experiencing unstable perturba-
tions [5].
The SS illustrates consistent lower extremity joint
angle trends with the CS during the stance phase (Fig. 3).
However, the hip rotation ROM in stance and peak
knee extension angle in push-off phase of CS are
greater than SS. This may be partly explained by the
location of the unstable attached to the SS, which has
been shown to induce compensatory movements and
different muscle activity as with a previous study [5].
Furthermore, the ankle ROM in this study increased
with respect to the CS, whereas another study showed
reduced ankle ROM compared to CS [21]. The likely
reason may be that in this study we used a regional-
ized unstable placement to the hallux but the previous
study used a whole sole rocker. Moreover, the SS pre-
sents larger peak ankle plantarflexion [20] (Table 1),
which also contributes to increased ROM from the
windlass mechanism [14]. Another explanation is that
the ankle, which is at a limbs length away from the
centre of mass, presents greater kinematic excursion
away from baseline, compared to proximal joints near
the centre of mass [23].
The SH significantly alters the lower limb kine-
matic characteristics during stance compared to the
CS and SS. During push-off, the SH leads to more
unstable stimuli to the hallux region than the SS due to
the higher elastic modulus, and exhibits different joint
angles compared to the CS and SS. For the hip, larger
peak flexion and smaller extension angle are pre-
sented among the rearfoot striking participants, which
is a possible compensatory strategy for the stiff unsta-
Fig. 4. The maximal force, peak pressure and force time integral ble perturbation in the push-off phase. The increased
of running with CS, SH and SS (“§”, “¶”, and “¢” indicates
significance p < 0.05, with “§” representing significance
externally rotated position of the hip with the SH is
between CS and SH, “¶” representing significance the involuntary response of stiffer hallux unstable
between SH and SS, and “¢” representing CS and SS) stimuli. A previous study reported the primary com-
pensatory motion was at the distal joints (ankle and
Gait patterns differ among individuals of different knee) compared to the proximal hip joint [23], how-
age [8], shod and barefoot or striking habits [13], and ever, this study found hip motion compensation wasA biomechanical assessment of running with hallux unstable shoes of different material stiffness 127
also significant. Consistent with previous studies [5], studies will focus on the effect of walking and running
[23], the knee and ankle with the SH showed greater with the hallux unstable shoes between genders and
kinematic variations than the CS and SS, respectively. under controlled speed situations. The longitudinal
With SH peak knee flexion is greater, whereas peak training effect from hallux unstable shoes shall be
knee abduction and internal rotation is decreased. considered.
During push-off, knee extension is reduced, whereas
knee adduction and external rotation is increased. This
is consistent with previously reported compensatory 5. Conclusion
mechanisms leading to kinematics changes of the
distal joint [5], [23] and potential protective strategies
to reduce knee joint loading [10]. The ankle joint is This study proposed a novel unstable shoe design
significantly inversed and internally rotated for the with unstable elements of different stiffness placed at
SH, the likely consequence of passive adjustment to the hallux. The primary objective was to analyse the
the regionalized unstable stimuli [5], [23], [24]. biomechanical performance of running with hallux
The plantar pressure distribution has been previ- unstable shoes, aiming to potentially stimulate and
ously utilized to analyse foot function [6], [15], [16], increase the toe gripping function. Unstable shoes with
and widely integrated into injury risk assessment [2], soft material led to reduced medial metatarsal loading by
[4], [12], [14], [15], [17]. The plantar pressure showed increasing the support area and modified joint kinemat-
no difference at the heel and mid foot regions since the ics minimally. Unstable shoes with stiffer material
unstable rocker structure was only attached to the hal- presented compensatory kinematic movements across
lux outsole. As hypothesized, the SS presents greatly all joints and laterally shifted plantar loading distribu-
reduced maximal force, peak pressure and force time tion.
integral to the medial forefoot, central forefoot and
lateral forefoot regions. In contrast, the plantar load-
ing increased at the big toe region. The toes gripping Acknowledgement
function may explain the higher pressure to the BT
and reduction at the forefoot [9], and decreased load- This study was sponsored by the National Natural Science
ing to the metatarsals [2], [13], [14] due to increased Foundation of China (No. 81772423), and K.C. Wong Magna Fund
load bearing area. The importance of the toes function in Ningbo University. The first author of this paper is supported by
is highlighted from deformation [4], [14], fatigue [17] the New Zealand-China Doctoral Research Scholarship.
and pathology [12] studies. Hence, the toe function
has implications for training using the rocker to ad- Conflict of interests
dress pathology seen in neuropathology and ulceration
risk.
The authors declare that no conflict of interest exist in this
With SH, the maximal force, peak pressure and
study.
force time integral remain consistent to the MFF and
CFF regions (apart from the decreased peak pressure
in CFF), and increase to the LFF and OT regions. The References
increased kinetics to the LFF and OT regions is linked
with the increased ankle inversion and internal rota- [1] CROMPTON R.H., PATAKY T.C., Stepping out, Science, 2009,
tion. The force time integral (impulse) to the BT re- 80(323), 1174–1175.
gion increased greatly in the SH compared to CS, pos- [2] D’AOÛT K., PATAKY T.C., DE CLERCQ D., AERTS P., The effects
sibly indicating that the hallux is passively contacting of habitual footwear use: foot shape and function in native
the sole without active gripping motion. This has im- barefoot walkers, Footwear Sci., 2009, 1, 81–94, DOI: 10.1080/
19424280903386411.
plications for risks of ankle sprain with the SH.
[3] GENT A.N., Engineering with rubber: how to design rubber
Several limitations concerning this study should components, Carl Hanser Verlag GmbH Co KG, Munich 2012.
not be ignored. Firstly, all participants were males, [4] GU Y., LI F., LI J. et al., Plantar Pressure Distribution Char-
which was originally for the purpose of alleviating acter in Young Female with Mild Hallux Valgus Wearing
gender-related locomotion functional difference. Sec- High-Heeled Shoes, J. Mech. Med. Biol., 2014a, 14, 1450008,
ondly, self-preferred running speed was instructed DOI: 10.1142/S0219519414500080.
[5] GU Y., LU Y., MEI Q. et al., Effects of different unstable sole
during the test, which initially aimed at presenting the construction on kinematics and muscle activity of lower
individual performance from running different shoes limb, Hum. Mov. Sci., 2014b, 36, 46–57, DOI: 10.1016/
without interference from controlled speed. Future j.humov.2014.04.008.128 Q. MEI et al.
[6] HILLSTROM H.J., SONG J., KRASZEWSKI A.P. et al., Foot type [17] NAGEL A., FERNHOLZ F., KIBELE C., ROSENBAUM D., Long
biomechanics. Part 1: Structure and function of the asympto- distance running increases plantar pressures beneath the
matic foot, Gait Posture, 2013, 37, 445–451, DOI: 10.1016/ metatarsal heads. A barefoot walking investigation of 200
j.gaitpost.2012.09.007. marathon runners, Gait Posture, 2008, 27, 152–155, DOI:
[7] HUGHES J., CLARK P., KLENERMAN L., The importance of 10.1016/j.gaitpost.2006.12.012.
the toes in walking, J. Bone Joint Surg. Br., 1990, 72–B, [18] NIGG B., FEDEROLF P.A., VON TSCHARNER V., NIGG S., Unstable
245–251. shoes: functional concepts and scientific evidence, Footwear
[8] JANDOVA S., VOLF P., VAVERKA F., The influence of minimal- Sci., 2012, 4, 73–82, DOI: 10.1080/19424280.2011.653993.
ist and conventional sports shoes and lower limbs dominance [19] SHU Y., MEI Q., FERNANDEZ J. et al., Foot Morphological Dif-
on running gait, Acta Bioeng. Biomech., 2018, 20(3), 3–9. ference between Habitually Shod and Unshod Runners, PLoS
[9] LAMBRINUDI C., Use and Abuse of Toes, Postgrad. Med. J., One, 2015, 10, e0131385, DOI: 10.1371/journal.pone.0131385.
1932, 8, 459–464, DOI: 10.1136/pgmj.8.86.459. [20] SMITH G., LAKE M., LEES A., WORSFOLD P.R., Measurement
[10] LI F., MEI Q., GU Y., Effects of unstable elements with differ- procedures affect the interpretation of metatarsophalangeal
ent hardness on lower limb loading, Acta Bioeng. Biomech., joint function during accelerated sprinting, J. Sports Sci., 2012,
2015, 17, 1–8, DOI: 10.5277/ABB-00111-2014-03. 30, 1521–1527, DOI: 10.1080/02640414.2012.713501.
[11] LIEBERMANN D.E., Human evolution: Those feet in ancient [21] SOBHANI S., HIJMANS J., VAN DEN HEUVEL E. et al., Biome-
times, Nature, 2012, 483, 550–551, DOI: 10.1038/483550a. chanics of slow running and walking with a rocker shoe,
[12] LU Y.C., MEI Q.C., GU Y.D., Plantar Loading Reflects Ulcera- Gait Posture, 2013, 38, 998–1004, DOI: 10.1016/
tion Risks of Diabetic Foot with Toe Deformation, Biomed. j.gaitpost.2013.05.008.
Res. Int., 2015, DOI: 10.1155/2015/326493. [22] SOBHANI S., VAN DEN HEUVEL E., BREDEWEG S. et al., Effect
[13] MEI Q., FERNANDEZ J., FU W. et al., A comparative biome- of rocker shoes on plantar pressure pattern in healthy female
chanical analysis of habitually unshod and shod runners runners, Gait Posture, 2014, 39, 920–925, DOI: 10.1016/
based on a foot morphological difference, Hum. Mov. Sci., j.gaitpost.2013.12.003.
2015a, 42, 38–53, DOI: 10.1016/j.humov.2015.04.007. [23] SOUSA A.S.P., MACEDO R., SANTOS R., TAVARES J.M.R.S.,
[14] MEI Q., FERNANDEZ J., HUME P., GU Y., Investigating biome- Influence of wearing an unstable shoe construction on com-
chanical function of toes through external manipulation inte- pensatory control of posture, Hum. Mov. Sci., 2013, 32,
grating analysis, Acta Bioeng. Biomech., 2016, 18, 87–92, 1353–1364, DOI: 10.1016/j.humov.2013.07.004.
DOI: 10.5277/ABB-00360-2015-02. [24] SOUSA A.S.P., SILVA A., MACEDO R. et al., Influence of long-
[15] MEI Q.C., FENG N., REN X.J. et al., Foot Loading Patterns term wearing of unstable shoes on compensatory control of
with Different Unstable Soles Structure, J. Mech. Med. Biol., posture: An electromyography-based analysis, Gait Posture,
2015, 15, 1550014, DOI: 10.1142/S0219519415500141. 2014, 39, 98–104, DOI: 10.1016/j.gaitpost.2013.06.003.
[16] MOOTANAH R., SONG J., LENHOFF M.W. et al., Foot Type [25] SVENNINGSEN F.P., KAALUND E., CHRISTENSEN T.Å. et al.,
Biomechanics. Part 2: Are structure and anthropometrics Influence of anterior load carriage on lumbar muscle activa-
related to function?, Gait Posture, 2013, 37, 452–456, DOI: tion while walking in stable and unstable shoes, Hum. Mov.
10.1016/j.gaitpost.2012.09.008 Sci., 2017, 56, 20–28, DOI: 10.1016/j.humov.2017.10.010.You can also read