QBD APPROACH TO HPLC METHOD DEVELOPMENT AND VALIDATION OF CEFTRIAXONE SODIUM
←
→
Page content transcription
If your browser does not render page correctly, please read the page content below
Patel et al. Future Journal of Pharmaceutical Sciences
https://doi.org/10.1186/s43094-021-00286-4
                                                                (2021) 7:141
                                                                                                                               Future Journal of
                                                                                                                         Pharmaceutical Sciences

 RESEARCH                                                                                                                                         Open Access

QbD approach to HPLC method
development and validation of ceftriaxone
sodium
Krunal Y. Patel1, Zarna R. Dedania1*, Ronak R. Dedania1 and Unnati Patel2

  Abstract
  Background: Quality by design (QbD) refers to the achievement of certain predictable quality with desired and
  predetermined specifications. A quality-by-design approach to method development can potentially lead to a more
  robust/rugged method due to emphasis on risk assessment and management than traditional or conventional
  approach. An important component of the QbD is the understanding of dependent variables, various factors, and
  their interaction effects by a desired set of experiments on the responses to be analyzed. The present study
  describes the risk based HPLC method development and validation of ceftriaxone sodium in pharmaceutical
  dosage form.
  Results: An efficient experimental design based on central composite design of two key components of the RP-
  HPLC method (mobile phase and pH) is presented. The chromatographic conditions were optimized with the
  Design Expert software 11.0 version, i.e., Phenomenex ODS column C18 (250 mm × 4.6 mm, 5.0 μ), mobile phase
  used acetonitrile to water (0.01% triethylamine with pH 6.5) (70:30, v/v), and the flow rate was 1 ml/min with
  retention time 4.15 min. The developed method was found to be linear with r2 = 0.991 for range of 10–200 μg/ml
  at 270 nm detection wavelength. The system suitability test parameters, tailing factor and theoretical plates, were
  found to be 1.49 and 5236. The % RSD for intraday and inter day precision was found to be 0.70–0.94 and 0.55–
  0.95 respectively. The robustness values were less than 2%. The assay was found to be 99.73 ± 0.61%. The results of
  chromatographic peak purity indicate the absence of any coeluting peaks with the ceftriaxone sodium peak. The
  method validation parameters were in the prescribed limit as per ICH guidelines.
  Conclusion: The central composite design experimental design describes the interrelationships of mobile phase
  and pH at three different level and responses to be observed were retention time, theoretical plates, and peak
  asymmetry with the help of the Design Expert 11.0 version. Here, a better understanding of the factors that
  influence chromatographic separation with greater confidence in the ability of the developed HPLC method to
  meet their intended purposes is done. The QbD approach to analytical method development was used for better
  understanding of method variables with different levels.
  Keywords: Quality by design, HPLC, Ceftriaxone sodium, Design approach

* Correspondence: zarnadedania.pharmacy@bmefcolleges.edu.in
1
 Department of Quality Assurance, Bhagwan Mahavir College of Pharmacy,
Vesu, Surat, Gujarat, India
Full list of author information is available at the end of the article

                                     © The Author(s). 2021 Open Access This article is licensed under a Creative Commons Attribution 4.0 International License,
                                     which permits use, sharing, adaptation, distribution and reproduction in any medium or format, as long as you give
                                     appropriate credit to the original author(s) and the source, provide a link to the Creative Commons licence, and indicate if
                                     changes were made. The images or other third party material in this article are included in the article's Creative Commons
                                     licence, unless indicated otherwise in a credit line to the material. If material is not included in the article's Creative Commons
                                     licence and your intended use is not permitted by statutory regulation or exceeds the permitted use, you will need to obtain
                                     permission directly from the copyright holder. To view a copy of this licence, visit http://creativecommons.org/licenses/by/4.0/.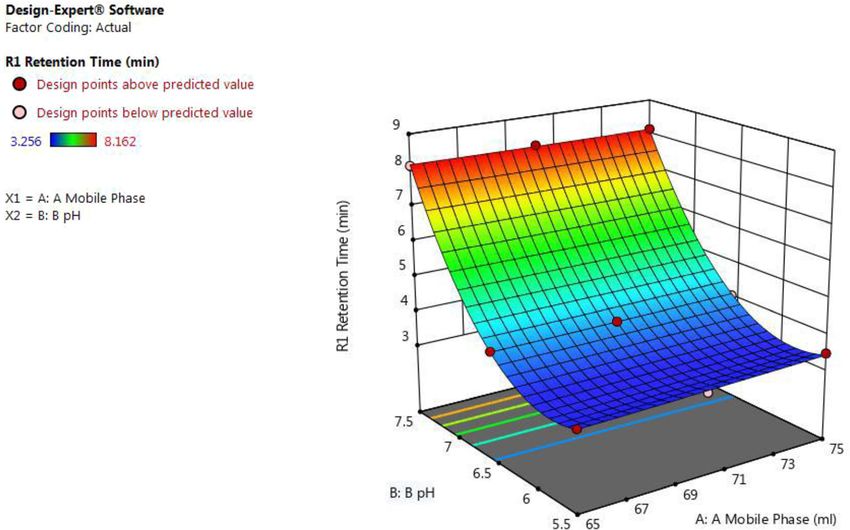
Patel et al. Future Journal of Pharmaceutical Sciences   (2021) 7:141                                                   Page 2 of 10

Background                                                              (150 mm × 4.6 mm × 5 μm particle size) was used at am-
A QbD is defined as “A systemic approach to the                         bient temperature.
method development that begins with predefined objec-
tives and emphasizes product and process understanding                  Chromatographic conditions
and process control, based on sound science and quality                 The Phenomenex C-18 column (250 mm × 4.6 mm hav-
risk management [1].” The QbD approach emphasizes                       ing 5.0 μm particle size equilibrated with a mobile phase
product and process understanding with quality risk                     consisting of acetonitrile to water (70:30, v/v)) was used.
management and controls, resulting in higher assurance                  The mobile phase pH 6.5 was adjusted with 0.01%
of product quality, regulatory flexibility, and continual               triethylamine. The flow rate was kept at 1 ml/min, and
improvement. The QbD method was based on the un-                        column was set at ambient temperature. Eluents were
derstanding and implementation of guidelines ICH Q8                     supervised using a PDA detector at 270.0 nm. A satisfac-
Pharmaceutical Development, ICH Q9 Quality Risk                         tory separation and peak symmetry for the drug were
Management, and ICH Q10 Pharmaceutical Quality Sys-                     obtained with the above chromatographic condition.
tem [2–4]. Analytical science is considered to be an inte-              The HPLC method for ceftriaxone sodium was opti-
gral part of pharmaceutical product development and                     mized for various parameters: mobile phase and pH as
hence go simultaneously during the entire product life                  two variables at three different levels using central com-
cycle. Analytical QbD defined as a science and risk-                    posite design.
based paradigm for analytical method development, en-
deavoring for understanding the predefined objectives to                Preparation of reference standard solution
control the critical method variables affecting the critical            The 1000 μg/ml standard stock solution was prepared by
method attributes to achieve enhanced method perform-                   dissolving an accurately 25 mg of ceftriaxone sodium in
ance, high robustness, ruggedness, and flexibility for                  25 ml methanol. The stock solution was further diluted
continual improvement [5, 6]. The result of analytical                  to a sub-stock 100 μg/ml. The 10 μg/ml solution was
QbD is well known, fit for purpose, and robust method                   prepared by diluting 1 ml of sub-stock solution to 10 ml
that reliably delivers the intended output over its life-               with methanol.
cycle, similar to the process QbD [7, 8]. For QbD, HPLC
methods, robustness, and ruggedness should be tested                    Selection of detection wavelength
earlier in the development stage of the method to ensure                Ten μg/ml ceftriaxone sodium was scanned in the range
the efficiency of the method over the lifetime of the                   of 200–400 nm, and wavelength maxima 270 nm was se-
product [9]. Otherwise, it can take considerable time                   lected as detection wavelength.
and energy to redevelop, revalidate, and retransfer ana-
lytical methods if a non-robust or non-rugged system is                 HPLC method development by QbD approach
adapted. The major objective of AQbD has been to iden-                  HPLC method development by Analytical QbD was as
tify failure modes and establish robust method operable                 follows.
design region or design space within meaningful system
suitability criteria and continuous life cycle management.              Selection of quality target product profile
Literature survey reveals QbD approaches for HPLC                       The QTPP plays an important role for identifying the
method were reported [10–13].                                           variables that affect the QTPP parameters. The retention
   The current work intends to develop and optimize the                 time, theoretical plates, and peak asymmetry were iden-
HPLC method for ceftriaxone sodium in pharmaceutical                    tified as QTPP for proposed HPLC method [14, 15].
dosage form by quality-by-design approach.
                                                                        Determine critical quality attributes
Methods                                                                 The CQAs are the method parameters that are directly
Materials                                                               affect the QTPP. The mobile phase composition and pH
Ceftriaxone sodium was procured as gift sample Salvavi-                 of buffer were two critical method parameters required
das Pharmaceutical Pvt. Ltd., Surat, Gujarat. All other                 to be controlled to maintain the acceptable response
reagents and chemicals used were of analytical grade,                   range of QTPP [16].
and solvents were used were of HPLC grade. The mar-
keted formulations MONOCEF 250 mg by Aristo were                        Factorial design
used for assay.                                                         After defining the QTPP and CQAs, the central compos-
                                                                        ite experimental design was applied to optimization and
Instruments and reference standards                                     selection of two key components: mobile phase and pH
The HPLC WATERS-2695 with Detector-UV VIS Dual                          of HPLC method. The various interaction effects and
Absorbance Detector WATERS-2487. C-18 column                            quadratic effects of the mobile phase composition and
Patel et al. Future Journal of Pharmaceutical Sciences         (2021) 7:141                                                    Page 3 of 10

pH of buffer solution on the retention time, theoretical                      Risk assessment
plates, and peak asymmetry was studied using central                          The optimized final method is selected against the attri-
composite statistical screening design.                                       butes of the method like that the developed method is
  A 2-factor, mobile phase composition and pH of buffer                       efficient and will remain operational throughout the
solution at 3 different levels, design was used with De-                      product’s lifetime. A risk-based approach based on the
sign Expert® (Version 11.0, Stat-Ease Inc., and M M), the                     QbD principles set out in ICH Q8 and ICH Q9 guide-
best suited response for second-order polynomial ex-                          lines was applied to the evaluation of method to study
ploring quadratic response surfaces [15].                                     the robustness and ruggedness [20]. The parameters of
                                                                              the method or its performance under several circum-
                                                                              stances, such as various laboratories, chemicals, analysts,
    Y ¼ β0 þ β1 A þ β2 B þ β12 AB þ β11 A2 þ β22 B2 B
                                                                              instruments, reagents, and days, were evaluated for ro-
        þ β22 B2 A þ β11 A2
                                                                              bustness and ruggedness studies [21].

  where A and B are independent variables coded for                           Implement a control strategy
levels, Y is the measured response associated with each                       A control strategy should be implemented after the devel-
combination of factor level, β0 is an intercept, and β1 to                    opment of method. The analytical target profile was set
β22 are regression coefficients derived from experimen-                       for the development of the analytical control strategy. The
tal runs of the observed experimental values of Y. Inter-                     analytical control strategy is the planned set of controls
action and quadratic terms respectively represent the                         that was derived from the understanding of the various
terms AB, A2, and B2.                                                         parameters, i.e., fitness for purpose, analytical procedure,
  Since multivariable interaction of variables and process                    and risk management. All these parameters ensure that
parameter have been studied, the factors were selected based                  both performance of the method and quality outputs are
on preliminary analysis [17]. As independent variables, mo-                   within the planned analytical target profile. Analytical
bile phase composition and pH of buffer were chosen and                       control strategy was planned for sample preparation,
shown in Table 1. The dependent variables were retention                      measurement, and replicate control operations [22].
time, peak area, and peak asymmetry as dependent variables
for proposed independent variables [18].                                      Continual improvement for managing analytical life cycle
                                                                              The best way in the management of analysis lifecycle is
                                                                              doing a continual improvement that can be imple-
Evaluation of experimental results and selection of final                     mented by monitoring the quality consistency and peri-
method conditions                                                             odic maintenance of HPLC instrument, computers, and
Using the CCD approach, these method conditions were                          updating of software and other related instrument and
assessed. At the first step, the conditions for retention                     apparatus can be done within laboratory [23].
time, theoretical plates, and peak asymmetry were evalu-
ated. For ceftriaxone sodium, this resulted in distinct                       Analytical method validation
chromatographic conditions. The proven acceptable                             Method validation is a documented evidence which pro-
ranges from robust regions where the deliberate varia-                        vides a high degree of assurance for a specific method
tions in the method parameters do not affect the quality.                     that the process used to confirm the analytical process is
This ensures that the method does not fail downstream                         suitable for its intended use. The developed HPLC
during validation testing. If the modeling experiments                        method for estimation ceftriaxone sodium was validated
do not have the desired response, the variable needs to                       as per ICH Q2 (R1) guidelines [24].
be optimized at different levels until the responses were
within the acceptable ranges [19]. The best suited chro-                      Linearity
matographic conditions shall be optimized using the De-                       The linearity of ceftriaxone sodium was evaluated by
sign Expert tools.                                                            analyzing 5 independent levels concentration range of
                                                                              10–200 μg/ml. The calibration curve was constructed by
                                                                              plotting peak area on y axis versus concentration on x-
Table 1 Coded values for independent variables                                axis. The regression line equation and correlation coeffi-
Factor                       Coded         Levels                             cient values were determined.
                             values
                                           −1            0            +1
                             given
                             factor                                           Precision
Acetonitrile to water        A             25:75         70:30        35:65
                                                                              Repeatability calculated by the measurement of six sam-
                                                                              ples 100 μg/ml ceftriaxone sodium. The intraday and
pH of buffer                 B             6.5           5.5          7.5
                                                                              interday precision were determined by analyzing three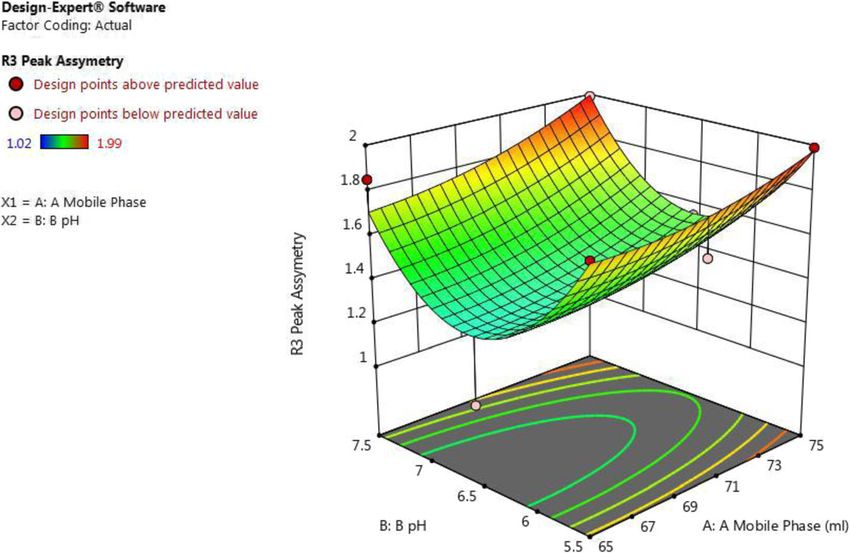
Patel et al. Future Journal of Pharmaceutical Sciences (2021) 7:141 Page 4 of 10
Table 2 Optimization of parameters for analysis of ceftriaxone sodium using CCD
Run Factor-1 Factor-2 Response-1 Response-2 Response-3
Acetonitrile to water pH Retention time Theoretical plate Peak asymmetry
1 70:30 6.5 4.033 5263 1.41
2 70:30 7.5 8.162 1798 1.66
3 75:25 5.5 3.468 1065 1.99
4 75:25 7.5 8.125 2352 1.99
5 65:35 6.5 4.017 8562 1.02
6 65:35 5.5 3.256 1523 1.96
7 75:25 6.5 4.018 5385 1.55
8 70:30 6.5 4.033 5263 1.41
9 70:30 5.5 3.265 2046 1.66
10 65:35 7.5 8.126 1689 1.85
11 70:30 6.5 4.033 5263 1.41
different concentrations of ceftriaxone sodium 100, 150, The % recovery of ceftriaxone sodium was calculated.
and 200 μg/ml concentrations at three times, on the The acceptance limit for % recovery as per ICH guide-
same day at an interval of 2 h and for three different lines was 98–102% of standard addition.
days. The acceptance limit for % RSD was less than 2.
LOD and LOQ
Accuracy The lowest drug concentration that can be accurately
The accuracy of the method was determined by calculat- identified and separated from the background is referred
ing by recovery study from marketed formulation by at to as a detection limit (LOD) and that can be quantified
three levels 80%, 100%, and 120% of standard addition. at the lowest concentration is referred to as LOQ, i.e.,
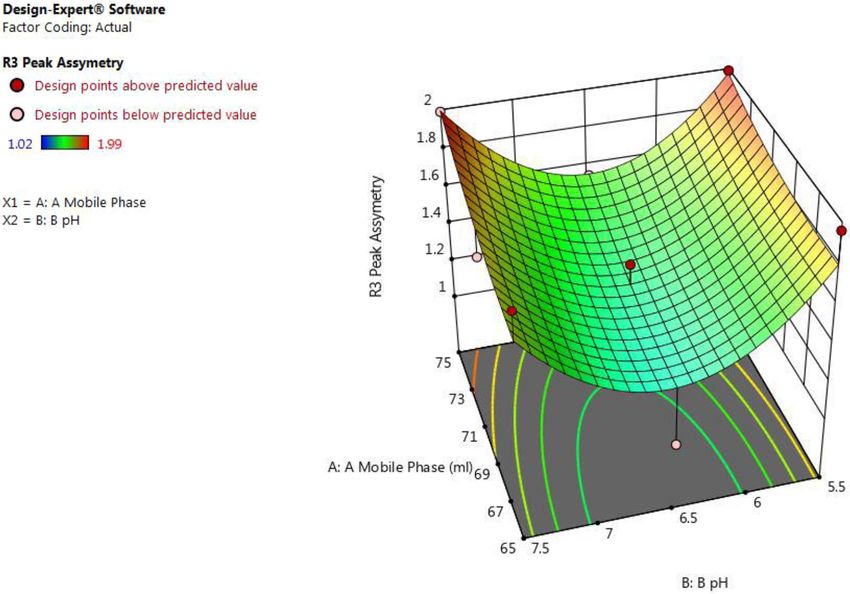
Fig. 1 3D surface plot for effect of combination of factors on R1 retention time of ceftriaxone sodium by using central composite designPatel et al. Future Journal of Pharmaceutical Sciences (2021) 7:141 Page 5 of 10 Fig. 2 3D surface plot for effect of combination of factors on R2 theoretical plate ceftriaxone sodium by using central composite design Fig. 3 3D surface plot for effect of combination of factors on R3 peak asymmetry of ceftriaxone sodium by using central composite design
Patel et al. Future Journal of Pharmaceutical Sciences      (2021) 7:141                                                      Page 6 of 10

Table 3 Obtained solution for optimized formulation
Code          Acetonitrile to water          pH          Retention time           Theoretical plates     Peak asymmetry        Desirability
C10           75:25                          6.5         4.156                    5836                   1.55                  0.765

the quantification limit. The following equation was used                     efficiency, peak asymmetry, and theoretical plates were
to measure LOD and LOQ according to ICH guidelines.                           calculated for standard solutions.

      LOD ¼ 3:3  σ=SD                                                        Assay
                                                                              Twenty tablets were weighed and powdered. Weigh an
      LOQ ¼ 10  σ=SD                                                         accurately about powder equivalent to 100 mg of ceftri-
                                                                              axone sodium, and transfer to 100 ml of volumetric flask.
  where σ is the standard deviation of the y-intercept of                     Add 25 ml of methanol, and perform sonication for 15
the regression line, and SD is the slope of the calibration                   min until the powder dissolves. Then, make up the vol-
curve.                                                                        ume up to the mark with mobile phase. Filter the result-
                                                                              ing solution with 0.42 μ Whatman filter paper. From the
Robustness and ruggedness studies                                             filtrate, dilute 0.5 ml to 10 ml to have a concentration of
The method’s robustness was calculated by subjecting                          100 μg/ml. The solution was analyzed by HPLC with
the method to a minor change in the state of the                              same chromatographic condition as linearity. The mean
method, such as pump flow rate and pH of mobile phase                         of 3 different assay were used for calculation.
composition. The ruggedness studies were determined
by changing the analyst as extraneous influencing factor.                     Results
The acceptance limit for calculated %RSD of peak area                         Initially, a mobile phase acetonitrile to water, 50:50 v/v,
was less than 2.                                                              was tried; the peak was observed at far retention time.
                                                                              No single peak was observed with mobile phase aceto-
System suitability studies                                                    nitrile to water, 80:20 v/v. The further mobile phase
The system suitability was evaluated by six replicate ana-                    tried was acetonitrile to water, 40:60 v/v. The improve-
lyses of ceftriaxone sodium. The retention time, column                       ment of peak shape and symmetry was done by adjusting

 Fig. 4 3D surface plot of desirability for obtaining optimized formulation
Patel et al. Future Journal of Pharmaceutical Sciences (2021) 7:141 Page 7 of 10
Table 4 Linearity of ceftriaxone sodium Factorial design [21]
Sr. no. Concentration (μg/ml) Peak area (mean ± SD) (n = 3) The CCD central composite design was selected for pro-
1 10 837465 ± 2542.14 posed HPLC method development. The optimization of
2 50 1867745 ± 2508.90
various parameters is shown in Table 2.
3 100 2714568 ± 2223.56
4 150 3774522 ± 1959.99 Design space
5 200 5268896 ± 2697.17 The response surface study type, central composite de-
sign, and quadric design model with 11 runs were used.
the buffer pH. The system suitability test parameters The proposed CCD experimental design was applied,
were satisfied with optimized chromatographic condi- and the evaluation of mobile phase composition and pH
tion. The optimized mobile phase consisting of aceto- of buffer was done against the three responses, retention
nitrile to water, 70:30 v/v, and pH 6.5 adjusted with time, theoretical plates, and peak asymmetry, and the re-
0.01% triethylamine. The central composite design was sult was summarized.
used further for the optimization of various parameters From Fig. 1 and equation retention time (for actual
within the design space. values) = 56.75 + 0.028 × A − 19.01 × B − 0.010 × AB +
0.000343 × A2 + 1.70458 × B2, it was concluded that as β1
positive coefficient (0.028) suggests that as the amount of
HPLC method development by QbD approach [25] acetonitrile in the mobile phase (A) increases and β2 nega-
Quality target product profile tive coefficient (− 19.01) suggests that as pH of buffer (B)
The QTPP selected were retention time, theoretical decreases, the value of retention time was increased.
plates, and peak asymmetry for optimization of HPLC From Fig. 2 and equation theoretical plates (for actual
chromatographic condition. values) = − 16774.36 − 4220.40 × A + 53225.20 × B +
56.05 × A × B + 26.83 × A2 − 4380.60 × B2, it was con-
cluded that as β1 negative coefficient (− 4220.40) sug-
Critical quality attributes gests that as the amount of acetonitrile in the mobile
The mobile phase composition acetonitrile to water, 70: phase (A) decreases and β2 positive coefficient
30, and pH of buffer solution adjusted with 0.01% (53225.20) suggests that as pH of buffer (B) increases,
triethylamine were identified. the value of theoretical plates was increased
Fig. 5 Linearity of 10–200 μg/ml ceftriaxone sodiumPatel et al. Future Journal of Pharmaceutical Sciences (2021) 7:141 Page 8 of 10
Table 5 Data for intraday and interday of ceftriaxone sodium
Precision period Concentration (μg/ml) (Mean ± SD) (n = 3) %RSD
Intraday precision 10 831995 ± 7787 0.94
100 2736502 ± 19105 0.70
200 5252142 ± 40415 0.77
Interday precision 10 839597 ± 8001 0.95
100 2741235 ± 19698 0.72
200 5249857 ± 28661 0.55
From Fig. 3 and equation peak asymmetry (for actual be y = 35441x + 60368 with a 0.991 correlation coeffi-
values) = 31.13 − 0.31 × A − 5.98 × B + 0.0055 × A × B cient when graph was plotted with peak area verses con-
+ 0.0021 × A2 + 0.429 × B2, it was concluded that as β1 centration (Fig. 5).
negative coefficient (− 0.31) suggests that as the amount
of acetonitrile in the mobile phase (A) decreases and β2 Precision
negative coefficient (− 5.98) suggests that as pH of buffer The % RSD for repeatability for ceftriaxone sodium
(B) decreases, the value of peak asymmetry was based on six times the measurement of the same con-
increased. centration (100 μg/ml) was found to be less than 0.082.
Interday and intraday precisions were shown in Table 5.
Optimized condition obtained The % RSD value less than 2 indicated that the devel-
It was obtained by studying all responses in different ex- oped method was found to be precise.
perimental conditions using the Design expert 11.0 soft-
ware, and optimized HPLC conditions and predicted Accuracy
responses are shown in Table 3. The accuracy was done by recovery study. Sample solu-
The observed value for responses was calculated by tions were prepared by spiking at 3 levels, i.e., 80%,
running the HPLC chromatogram for given set of mo- 100%, and 120%. The % recovery data obtained by the
bile phase and pH of buffer and then compared with the proposed HPLC method are shown in Table 6. The % of
predicted values to evaluate for % prediction error. recovery within 98–102% justify the developed method
was accurate as per the ICH Q2 (R1) guidelines.
Method validation
System suitability Robustness and ruggedness studies
The system suitability test was applied to a representa- For robustness and ruggedness studies 100 μg/ml solu-
tive chromatogram to check the various parameters such tion of ceftriaxone sodium was used. The robustness
as the retention time which was found to be 4.15 min, was studied by the slight but deliberate change in intrin-
theoretical plates were 5263, peak asymmetry was 1.49, sic method parameters like pH of mobile phase and flow
and % RSD of six replicate injections was 0.82. The 3D rate. The ruggedness was studied by change in analyst as
surface plot of desirability for obtaining optimized for- extraneous influencing factor. The % RSD for peak area
mulation is shown Fig. 4. were found to be less than 2 by change in pH of mobile
phase, flow rate, and analyst.
Linearity
The constructed calibration curve for ceftriaxone so- LOD and LOQ
dium was linear over the concentration range of 10– The LOD and LOQ for ceftriaxone sodium based on
200 μg/ml shown in Fig. 2 and Table 4. Typically, the re- standard deviation of slope and intercept were found to
gression equation for the calibration curve was found to be 0.22 μg/ml and 0.67 μg/ml respectively.
Table 6 Recovery of ceftriaxone sodium
Assay Amount equivalent to tablet Standard added Total amount Recovered amount (mg) ± % Recovered spiked amount ±
level powder(mg) (mg) (mg) SD (n = 3) SD (n = 3)
Blank 50 00 50 50.59 ± 0.71 101.19 ± 1.42
80% 50 40 90 40.17 ± 0.70 100.79 ± 1.73
100% 50 50 100 49.24 ± 0.43 99.57 ± 1.47
120% 50 60 110 59.63 ± 0.42 99.70 ± 1.40Patel et al. Future Journal of Pharmaceutical Sciences (2021) 7:141 Page 9 of 10
Assay pH. The analytical QbD concepts were extended to the
The optimized chromatogram ceftriaxone sodium HPLC method development for ceftriaxone sodium, and
showed a resolved peak at retention time 4.15 min when to determine the best performing system and the final
performed assay from tablets. The % assay of drug con- design space, a multivariant study of several important
tent was found to be 99.73 ± 0.61 (n = 3) for label claim process parameters such as the combination of 2 factors
of ceftriaxone sodium. The assay result indicated the namely the mobile phase composition and pH of buffer
method’s ability to measure accurately and specifically in at 3 different levels was performed. Their interrelation-
presence of excipients presents in tablet powder. ships were studied and optimized at different levels
using central composite design. Here, a better under-
Discussion standing of the factors influencing chromatographic sep-
The analytical quality-by-design HPLC method for the aration in the ability of the methods to meet their
estimation of ceftriaxone sodium in pharmaceutical for- intended purposes is done. This approach offers a prac-
mulation has been developed. The analytical target tical knowledge understanding that help for the develop-
product profile were retention time, theoretical plates, ment of a chromatographic optimization that can be
and peak asymmetry for the analysis of ceftriaxone used in the future. All the validated parameters were
sodium by HPLC. The two variables namely the mo- found within the acceptance criteria. The validated
bile phase composition and pH of buffer solution method was found to be linear, precise, accurate, spe-
were identified as the critical quality attributes that cific, robust, and rugged for determination of ceftriaxone
affect the analytical target product profile. The central sodium. The QbD approach to method development has
composite design was applied for two factors at three helped to better understand the method variables hence
different levels with the use of the Design Expert leading to less chance of failure during method valid-
Software Version 11.0. The risk assessment study ation and transfer. The automated QbD method devel-
identified the critical variables that have impact on opment approach using the Design Expert software has
analytical target profile [26–28]. In chromatographic provided a better performing more robust method in
separation, the variability in column selection, instru- less time compared to manual method development.
ment configuration, and injection volume was kept The statistical analysis of data indicates that the method
controlled while variables such as pH of mobile is reproducible, selective, accurate, and robust. This
phase, flow rate, and column temperature were method will be used further for routine analysis for qual-
assigned to robustness study. ity control in pharmaceutical industry.
The quality-by-design approach successfully devel-
Abbreviations
oped the HPLC method for ceftriaxone sodium. The QbD: Quality by design; API: Active pharmaceutical ingredient; CCD: Central
optimized RP-HPLC method for determination of cef- composite design; QTPP: Quality target product profile; CQA: Critical quality
triaxone sodium used Phenomenex C18 column (250 attribute; HPLC: High-performance liquid chromatography; RP HPLC: Reverse
phase high-performance liquid chromatography; LOQ: Limit of quantitation;
× 4.6 mm, 5 μm particle size) and mobile phase con- LOD: Limit of detection; RSD: Relative standard deviation
sist of acetonitrile to water, 70:30 v/v, pH adjusted to
6.5 with 0.01% triethylamine buffer. The retention Acknowledgements
All authors are very thankful to the Bhagwan Mahavir College of Pharmacy,
time for ceftriaxone sodium was found to be 4.15 Surat, for providing necessary facilities to carry out the research work.
min. The method was linear in the range of 10–
200 μg/ml with 0.991 correlation coefficient. The % Authors’ contributions
All authors associated with this research work declared that there is no
RSD for repeatability, intraday, and inter day preci- conflict of interest for publication of work. All authors have read and
sion was found to be less that 2% indicating the opti- approved the manuscript. The contribution of each author is mentioned
mized method was precise. The LOD and LOQ were below. KP: He is a M Pharm (Quality Assurance) Research Student and the
above work has been carried out by him as dissertation work. ZD: She is
0.22 μg/ml and 0.67 μg/ml, respectively. The % recov- Research Guide and HOD, Department of Quality Assurance and under her
ery of spiked samples was found to be 99.57 ± 1.47 noble guidance the QbD approach for HPLC method has been developed
to 100.79 ± 1.73 as per the acceptance criteria of the and validated as per ICH guidelines. She is also giving training for ease of
operation sophisticated instrument and involved in interpretation of data.
ICH guidelines. The method was developed as per the RD: He is a co-guide and under his noble guidance student can understand
ICH guidelines. the Design Expert Software and interpretation of statistical data. UP: She is a
graduate teaching assistant at University of Alabama at Huntsville, USA and
she has contributed for preparing the manuscript.
Conclusion
A quality-by-design approach to HPLC method develop- Funding
ment has been described. The method goals are clarified This research did not receive any specific grant from funding agencies in the
based on the analytical target product profile. The ex- public, commercial, or not-for-profit sectors.
perimental design describes the scouting of the key Availability of data and materials
HPLC method components including mobile phase and All data and material are available upon request.Patel et al. Future Journal of Pharmaceutical Sciences (2021) 7:141 Page 10 of 10
Declarations 17. Krull I, Swartz M, Turpin J, Lukulay P, Verseput R (2009) A quality-by-design
methodology for rapid LC method development part II. Liq Chroma Gas
Ethics approval and consent to participate Chroma N Am 27:48–69
Not applicable 18. Reid G, Morgado J, Barnett K, Harrington B, Wang J, Harwood J, Fortin D
(2013) Analytical QbD in pharmaceutical development. https://www.waters.
Consent for publication com/nextgen/in/en/library/application-notes/2019/analytical-quality-by-
Not applicable design-based-method-development-for-the-analysis-of-formoterol-
budesonide-and-related-compounds-using-uhplc-ms.html. Accessed 10
June 2018.
Competing interests
19. Molnar RH, Monks K (2010) Aspects of the “Design Space” in high pressure
No competing interests to declare.
liquid chromatography method development. J Chromatogra A 1217(19):
3193–3200. https://doi.org/10.1016/j.chroma.2010.02.001
Author details
1 20. Monks K, Molnar I, Rieger H, Bogati B, Szabo E (2012) Quality by design:
Department of Quality Assurance, Bhagwan Mahavir College of Pharmacy,
multidimensional exploration of the design space in high performance
Vesu, Surat, Gujarat, India. 2Department of Chemistry, The University of
liquid chromatography method development for better robustness before
Alabama in Huntsville, 301 Sparkman Dr, Huntsville AL-35899, USA.
validation. J Chromatogra A 1232:218–230. https://doi.org/10.1016/j.
chroma.2011.12.041
Received: 4 December 2020 Accepted: 18 June 2021
21. Ramalingam P, Kalva B, Reddy Y (2015) Analytical quality by design: a tool
for regulatory flexibility and robust analytics. Int J Ana Chem. https://doi.
org/10.1155/2015/868727
References 22. The International Conference on Harmonisation ICH Technical Requirements
1. Sandipan R (2012) Quality by design: A holistic concept of building quality for Registration of Pharmaceuticals for Human Use on Development and
in pharmaceuticals. Int J Pharm Biomed Res 3:100–108 Manufacture of Drug Substances (Chemical Entities and Biotechnological/
2. The International Conference on Harmonisation ICH Technical Requirements Biological Entities) Q11 (2012) https://database.ich.org/sites/default/files/
for Registration of Pharmaceuticals for Human Use on Pharmaceutical Q11%20Guideline.pdf
Development Q8(R2) (2009) https://database.ich.org/sites/default/files/Q8%2 23. Orlandini S, Pinzauti S, Furlanetto S (2013) Application of quality by design
8R2%29%20Guideline.pdf to the development of analytical separation methods. Ana Bioana Chem
3. The International Conference on Harmonisation ICH Technical Requirements 405(2-3):443–450. https://doi.org/10.1007/s00216-012-6302-2
for Registration of Pharmaceuticals for Human Use on Quality Risk 24. The International Conference on Harmonisation ICH Technical Requirements
Management Q9 (2005) https://database.ich.org/sites/default/files/Q9%2 for Registration of Pharmaceuticals for Human Use on Validation of
0Guideline.pdf Analytical Procedures: Text and Methodology Q2(R1) (2005) https://databa
4. The International Conference on Harmonisation ICH Technical Requirements se.ich.org/sites/default/files/Q2%28R1%29%20Guideline.pdf
for Registration of Pharmaceuticals for Human Use on Pharmaceutical 25. Reid G, Cheng G, Fortin D (2013) Reversed-phase liquid chromatographic
Quality System Q10 (2008) https://database.ich.org/sites/default/files/Q10%2 method development in an analytical quality by design framework. J Liq
0Guideline.pdf Chrom Related Tech 36(18):2612–2638. https://doi.org/10.1080/10826076.2
5. Borman P, Nethercote P, Chatfield M, Thompson D, Truman K (2007) The 013.765457
application of quality by design to analytical methods. Pharm Tech 31:142– 26. Elder P, Borman P (2013) Improving analytical method reliability across the
152 entire product lifecycle using QbD approaches. Pharmaceu Outsourcing, 14:
6. Schweitzer M, Pohl M, Hanna BM, Nethercote P, Borman P, Hansen G, Smith 14–19. http://www.pharmoutsourcing.com/Featured-Articles/142484-
K, Larew J (2010) Implications and opportunities of applying QbD principles Improving-Analytical-Method-Reliability-Across-the-Entire-Product-Lifecycle-
to analytical measurements. Pharm Tech 34:52–59 Using-QbD-Approaches/. Accessed 2019.
7. Galen WE (2004) Analytical Instrumentation Handbook 2nd edn. Marcel 27. Smith J, Jones M Jr, Houghton L (1999) Future of health insurance. N Engl J
Dekker Inc, New York Med 965:325–329
8. Snyder LR, Kirkland JJ, Glajch LJ (1997) Practical HPLC method development; 28. Schweitzer M, Pohl M, Hanna-Brown M (2010) Implications and
2nd edn. John Wiley & Sons Inc, New York. https://doi.org/10.1002/978111 opportunities of applying QbD principles to analytical measurements.
8592014 Pharmaceu Tech 34:52–59
9. Bhatt D, Rane S (2011) QbD approach to analytical RP-HPLC method
development and its validation. Int J Pharm Pharm Sci 3:79–187
10. Rajkotwala A, Shaikh S, Dedania Z, Dedania R, Vijyendraswamy S (2016) QbD Publisher’s Note
approach to analytical method development and validation of piracetam by Springer Nature remains neutral with regard to jurisdictional claims in
HPLC. World J Pharmacy Pharmaceutical Sci 5:1771–1784 published maps and institutional affiliations.
11. Singh P, Maurya J, Dedania Z, Dedania R (2017) QbD Approach for stability
indicating HPLC method for determination of artemether and lumefantrine
in combined dosage form. Int J Drug Reg Affairs 5:44–59
12. Prajapati R, Dedania Z, Jain V, Sutariya V, Dedania R, Chisti Z (2019) QbD
approach to HPLC method development and validation for estimation of
fluoxetine hydrochloride and olanzapine in pharmaceutical dosage form. J
Emerging Tech Innovative Res 6:179–195
13. Dhand V, Dedania Z, Dedania R, Nakarani K (2020) QbD approach to
method development and validation of orciprenaline sulphate by HPLC. J
Global Trends Pharm Sci 11:8634–8640
14. Krull I, Swartz M, Turpin J, Lukulay P, Verseput R (2008) A quality-by-design
methodology for rapid LC method development, part I. Liq Chroma Gas
Chroma N Am 26:1190–1197
15. Myers R, Montgomery D, Anderson-Cook C (2016) Response surface
methodology: process and product optimization using designed
experiments. 4th edn. New York: Wiley
16. Yubing T (2011) Quality by design approaches to analytical methods- FDA
perspective. https://www.fda.gov/files/about%20fda/published/Quality-by-
Design-Approaches-to-Analytical-Methods%2D%2D%2D%2DFDA-
Perspective%2D%2DYubing-Tang%2D%2DPh.D.%2D%2DOctober%2D%2D2
011%2D%2DAAPS-Annual-Meeting.pdf. Accessed 15 Dec 2018.You can also read