YouTube as a Source of Patient Information for Bipolar Disorder: A Content-Quality and Optimization Analysis
←
→
Page content transcription
If your browser does not render page correctly, please read the page content below
YouTube as a Source of Patient Information for
Bipolar Disorder: A Content-Quality and
Optimization Analysis
Tomasz Szmuda
Gdanski Uniwersytet Medyczny
Weronika Magdalena Żydowicz ( veronikazydowicz@wp.pl )
Gdanski Uniwersytet Medyczny https://orcid.org/0000-0002-5827-3736
Shan Ali
Gdanski Uniwersytet Medyczny
Karolina Fedorow
Gdanski Uniwersytet Medyczny
Paweł Słoniewski
Gdanski Uniwersytet Medyczny
Research
Keywords: bipolar disorder, Internet, online, psychiatry, YouTube
DOI: https://doi.org/10.21203/rs.3.rs-31091/v1
License: This work is licensed under a Creative Commons Attribution 4.0 International License.
Read Full License
Page 1/22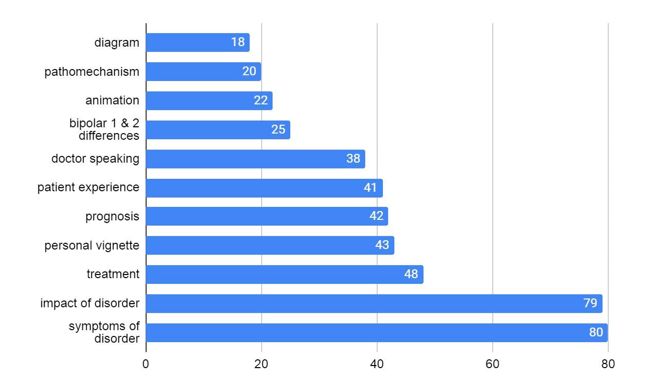
Abstract
Background YouTube is currently the second most popular website in the world and it is often used by
patients to access health information online. Our aim was to evaluate the content-quality of YouTube
videos relating to bipolar disorder.

Methods We chose the rst 30 videos for four different search phrases: ”bipolar disorder,” ”bipolar
disorder treatment,” ”bipolar disorder symptoms” and ”manic depression.” Video contents were evaluated
by two independent nal year medical students using the validated DISCERN instrument. Qualitative data,
quantitative data and the upload source was recorded for analysis.

Results Out of the total 120 videos, 80 videos met our inclusion criteria and were evaluated. The mean
DISCERN score was 63.5 (out of 75 possible points). This indicates that the quality of YouTube videos on
bipolar disorder is excellent. Reliability between the two raters was excellent (intraclass correlation
coe cient = 0.96). Nearly all videos had symptoms of the disorder (100%) and the impact of the disorder
on daily life (98.8%). Videos were mostly uploaded by educational channels (61.3%) and hospitals
(16.3%). Videos that had a doctor speaker had a signi cantly higher average daily views, comments and
a video power index (P
ethnicities.([CSL STYLE ERROR: reference with no printed form.]) Individuals with BD consistently report
social stigma as one of the greatest challenges of living with the condition and thus anonymously search
for medical information online (rather than seeking professional help).(Mileva et al. 2013) For this reason,
BD is often misdiagnosed or can go undiagnosed for up to 10 years which perpetuates the suffering from
the disease.(Shen et al. 2018)

Our aim was to assess the current quality and the reliability of YouTube videos on BD using a
comprehensive search strategy. We also sought to determine what optimizes a video for audience
engagement.

Materials And Methods
Search Strategy:

We searched YouTube on November 11, 2019 using the four key phrases; “bipolar disorder”, “bipolar
disorder treatment”, “bipolar disorder symptoms”, and “manic depression”. We felt that these search
terms offered a su cient view of BD videos because they are relative synonyms to BD. We intentionally
chose these phrases since after being given a diagnosis of “bipolar disorder” we anticipated that a
patient would probably use the same search term or a slight variation of it on YouTube.

Data Collection:

Previous research shows that 90% of search engine users only look at the rst 3 pages of searched
content. Thus, the rst 30 results of each search were viewed and evaluated under the chosen criteria and
results were recorded.(2006)

Inclusion and Exclusion Criteria:

Out of 116 videos, we evaluated a total of 80 videos related to BD. Any duplicates, advertisements, music
videos, videos in another language or videos clearly not related to BD (e.g. music videos) were excluded.

Variables Extracted:

We used the Google Chrome extension “VidIQ Vision for YouTube” to retrieve quantitative information
from each video. This included: total number of views, total number of comments, duration, video
description word count, video description link count, referrers, likes, dislikes, and video tags and time
since upload. Information about the host channel was also recorded: uploader name, average daily views,
average daily subscribers, subscribers, and tags.

Qualitative information included: impact of the disorder on everyday life, symptoms of BD, personal
story/vignette of person, difference between BP1 and BP2, results of treatment, discussion of prognosis,
animations, diagrams, pathomechanisms explained, a doctor speaker and/or a patient experience.

                                                    Page 3/22
We recorded the source of upload and categorized them into either: physician, hospital, patient,
educational or other.
Scoring System:
Videos were evaluated using the validated DISCERN instrument, by two medical students in the nal
clinical years of their studies who each had ve years of experience using the DISCERN instrument. The
DISCERN instrument is a sixteen-point questionnaire designed to allow lay-people to judge the reliability &
quality of health information as seen on Table 1.(Charnock et al. 1999; Rees et al. 2002) The rst fteen
questions are scored on a scale from 1-5 depending on if they meet the given criteria. A score of 1 means
the video de nitely did not ful ll the criteria, partial ful lment of criteria can be scored a 2-4 ranging on
the independent judgement of the scorer, and a 5 is a de nite yes. The total minimum score is 16 and the
maximum score is 80 points.
TABLE LEGENDS
Page 4/22Number Question Rating
1 Are the 1 2 3 4 5
aims clear?
2 Does it 1 2 3 4 5
achieve its
aims?
3 Is it 1 2 3 4 5
relevant?
4 Is it clear 1 2 3 4 5
what
sources of
informatio
n were
used to
compile the
publication
(other than
the author
or
producer)?
5 Is it clear 1 2 3 4 5
when the
informatio
n used or
reported in
the
publication
was
produced?
6 Is it 1 2 3 4 5
balanced
and
unbiased?
7 Does it 1 2 3 4 5
provide
details of
additional
sources of
support
and
informatio
n?
8 Does it 1 2 3 4 5
refer to
areas of
uncertainty
?
9 Does it 1 2 3 4 5
describe
how each
Page 5/22treatment
works?
10 Does it 1 2 3 4 5
describe
the bene ts
of each
treatment?
11 Does it 1 2 3 4 5
describe
the risks of
each
treatment?
12 Does it 1 2 3 4 5
describe
what would
happen if
no
treatment
is used?
13 Does it 1 2 3 4 5
describe
how the
treatment
choices
affect
overall
quality of
life?
14 Is it clear 1 2 3 4 5
that there
may be
more than
1 possible
treatment
choice?
15 Does it 1 2 3 4 5
provide
support for
shared
decision
making?
16 Based on 1 2 3 4 5
the
answers to
all of these
questions,
rate the
overall
quality of
the
publication
as a source
of
Page 6/22informatio
n about
treatment
choices
Table 1: The 16 question DISCERN Instrument
The last question is a summary of the previous 15 DISCERN questions and determines whether the
publication can be used as an appropriate source of information. An overall rating of 2 or below indicates
the publication is of “poor” quality with many shortcomings and is not useful or appropriate. A score of 3
indicates “fair” quality of publication that requires additional sources of information due to some
limitations. A score of 4 or above indicates “good” quality meaning the publication is useful and
appropriate as a source of information about treatment choices.(Charnock et al. 1999; Rees et al. 2002)
The DISCERN score may also be interpreted as a total out of 75 using only the rst 15 questions. A score
of 63 to 75 indicates an “excellent” score, 51 to 62 indicates a “good” score, 39 to 50 indicates a “fair”
score, 27-38 indicates a “poor” score and 16 to 26 indicates a “very poor” score.(Cassidy and Baker 2016;
Weil et al. 2014)
Video Optimization:
The optimization analysis method in this study is similar to a studies previously published.(Szmuda et al.
2020a; Szmuda et al. 2020b) The average daily views [total views/days since upload], the like ratio
[(likes/likes +dislikes)*100] and the video power index (VPI) [(like*100/(like + dislike))*(views/day)/100]
were used to assess the audience engagement with a video. Of note, standardized cut-off scores do not
exist for the VPI since it depends on the number of likes and views and this is highly variable depending
on how popular a video is. However, we have provided the mean VPI in the results section so that a reader
may use it for reference (to see if a VPI value is higher or lower than the mean).
Videos were grouped based on their qualitative content (e.g. if a video included the treatment of BP
disorder). These video groups were analyzed against their average daily views, like ratio, VPI and number
of comments.
Statistical Methods:
Descriptive statistics for continuous variables covered mean, median, range and standard deviation. The
Mann–Whitney U test was used to nd differences between categorical variables and the intraclass
correlation coe cient was used to ascertain inter-rater agreement. P < 0.05 was deemed signi cant.
Google Sheets (Google LLC, Mountain View, California, USA) was used for illustrations. Past (Hammer
and Harper, Øyvind Hammer, Natural History Museum, University of Oslo) was used for statistical
analysis.
Page 7/22Results
Video Contents:
A total of 80 unique videos were included in our content analysis. Figure 1 shows the
qualitative content of videos about BD. Almost all videos covered the symptoms (100%) and
the impact (99%) of BD on daily life. Most videos included the treatment (60%), the
prognosis (54%), a personal vignette (54%) and a patient experience concerning BD (51%).
However, most videos did not have: a doctor speaking (48%), animation (28%), BD
pathomechanisms (25%), a diagram (23%), and the differences between BD1 & BD2 (31%).
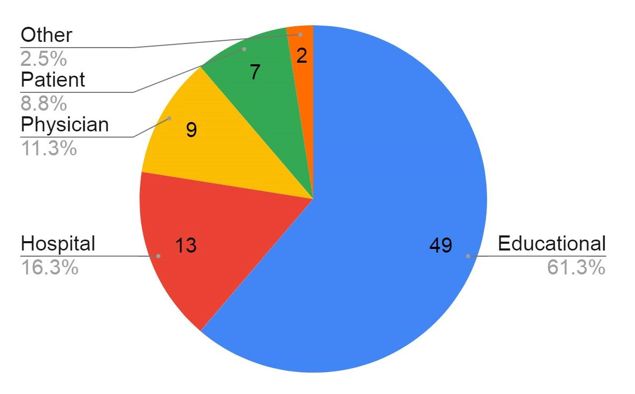
Video Upload Source:
Figure 2 illustrates the source of the videos uploaded. The majority of the videos were
uploaded by an educational channel 61.3% (49 videos). The remainder of the videos were
uploaded by a hospital 16.3% (13 videos), a physician 11.3% (9 videos), a patient 8.8% (7
videos) and 2.5% (2 videos) were uploaded by other sources.
Video Statistics:
The following represent the mean quantitative aspects of the videos overall: duration
1034.1 (47–7573) seconds, view count 323059 (1061–3500000), comments 702.3 (0–5960),
likes 6011.4 (0–61000), dislikes 153.8 (0–1683), average daily views 41 (0–630), like ratio
93.9 (50–100), video referrers 71.7 (0–527) and days since upload 1459.325 (125–4294).
The following represent the mean channel popularity of the videos: subscribers 1713569 (3–
21700000), daily views 6824841.4 (49.8–486900000) and daily subscribers 39832.6 (0.1–
1550000).
Video Quality Evaluation:
Page 8/22The mean DISCERN score of the two raters for DISCERN was 63.4 ± 11.3 (38-80) (out of
80 possible points). The first rater and second rater had a mean DISCERN score of 63.5 ±
11.3 (39–80, and 63.3 ± 11.3 (38–80), respectively. The intraclass correlation coefficient
for the absolute agreement between the two raters was 0.996 (95% Confidence Interval of
0.9938 to 0.9975); this is regarded as an “excellent” reliability according to Cicchetti and
Koo.(Cicchetti 1994; Koo and Li 2016; 2017)
The mean sum of the first 15 items of DISCERN was 59.3 (out of 75 total points). This is
considered “good” quality of information (62-51 points).(Cassidy and Baker 2016)
The mean DISCERN score between the two raters for question 16 was 4.1 (2–5). The mean
score for each individual rater was 4.1 (2–5) and 4.1 (2–5), respectively. This may be
regarded as a “good” quality of information that is useful for patients making treatment
choices. Specifically, 59 videos (73.75%) scored a 4 or above indicating a good quality of
publication.
The mean total DISCERN scores differed in regards to the uploader: patient videos scored
the lowest at 47.64 while physicians videos uploads scored the highest at 68.11. Hospital
videos scored 62.23 and educational channel videos scored 64.93.
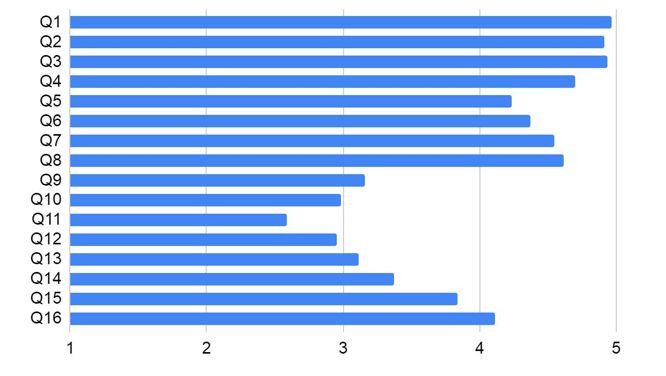
Figure 3 illustrates the mean score for each of the 16 questions of DISCERN. Questions 1 to
3 scored the highest ratings overall. They pose essential questions in regards to qualitative
video content: are the aims clear, does it achieve its aims, and is it relevant. Questions 4 to
8 all scored above 4, this is considered a “good” score. These five questions rate the
publication based on the publication’s clarity of sources of information, clarity of when the
information was reported or used, bias, inclusion of additional sources, and uncertainty.
The lowest scores were for questions 9 to 15. These questions are focused explicitly on
treatment or lack thereof: how it works, what are the benefits, what are the risks, how they
affect quality of life, and variety of treatments.
Video Quality Correlations:
Page 9/22Table 2 shows video quality in relation to the video content. Videos had a greater DISCERN
score when they included: the results of the treatment (P = 0.0001), the prognosis (P =
0.0001), the pathomechanisms (P = 0.0003), a doctor speaker (P = 0.0004) and diagrams
(P = 0.0098).
Page 10/22With information Without information
DISCERN
Results of treatment
Mean 70.563 52.578
95% Confidence 68.583 to 72.542 49.927 to 55.230
interval
Sample size 48 32
P value 0.0001
Prognosis
Mean 70.726 55.237
95% Confidence 68.462 to 72.990 52.218 to 58.255
interval
Sample size 42 38
P value 0.0001
Diagrams
Mean 69.028 61.726
95% Confidence 63.601 to 74.455 58.947 to 64.504
interval
Sample size 18 62
P value 0.0098
Pathomechanism
Mean 70.750 60.908
95% Confidence 66.577 to 74.923 58.073 to 63.744
interval
Sample size 20 60
P value 0.0003
Doctor speaker
Mean 67.395 59.726
95% Confidence 63.870 to 70.919 56.409 to 63.043
interval
Sample size 38 42
P value 0.0004
Table 2: Statistically significant relationships between the DISCERN score and selected
qualitative video content.
Page 11/22Optimization Analysis:
Table 3 shows that audience engagement in relation to the video content. Videos that
contained an animation (P = 0.034) or a doctor speaker (P = 0.0006) had a significantly
higher average daily views and a higher VPI. There was a statistically significant
relationship with a doctor speaker (P = 0.0005) in the video and a higher number of
comments. There were no statistically significant findings in regards to the like ratio.
Page 12/22With Without information
information
Average Daily Views
Animation
Mean 940.60 408.74
95% Confidence -123.84 to 150.66 to 666.82
interval 2005.00
Sample size 22 58
P value 0.034
Doctor speaker
Mean 218.29 859.64
95% Confidence 34.57 to 402.01 242.71 to 1476.60
interval
Sample size 38 42
P value 0.0006
Comments
Doctor speaker
Mean 263.49 1096.2
95% Confidence 98.331 to 591.16 to 1601.20
interval 428.64
Sample size 35 35
P value 0.0005
Video Power Index
Animation
Mean 914.33 402.77
95% Confidence -126.14 to 1954.80 151.29 to
interval 652.26
Sample size 22 57
P value 0.0489
Doctor
speaking
Mean 217.8 833.69
95% Confidence 32.061 to 403.53 234.71 to
interval 1432.70
Sample size 37 42
P value 0.0008
Page 13/22Table 3: Statistically significant relationships between the average daily views, comments
and the video power index against qualitative video content.
Top quality YouTube videos:
DISCERN Title Uploader YouTubeID
80 Bipolar Disorder: Aware LCeLKT2SFQo
Treatment and
Preventing Relapse |
Dr Patrick McKeon
80 Treatment of Bipolar NAMI SGV Q2KNgzVYQZo
Disorder
80 Treatment Choices: DBSAlliance gzgi9Sr7twY
Options for Bipolar
Disorder
79 Treating Bipolar Paul Merritt wpYlrJ_ild0
Disorder
79 Understanding and freeCE WfkgvBHPOYQ
Treating Bipolar
Disorder
79 Understanding Stanford Hospital b_ZxPOubM6A
Bipolar Depression
Table 4: The top six highest quality bipolar disorder videos based on the DISCERN criteria
Table 4 shows the highest scoring YouTube videos. The three top scoring videos were tied
with 80 points and the following 3 were tied with 79 points. The mean DISCERN score of
the top six videos is 79.5 (99.375%), which means patients may view them as a trusted
source of health content. Half of the videos were uploaded by an educational channel, two
were uploaded by hospitals and one was uploaded by a physician.
All these videos included the following five features: symptoms of BD, impact of the
disorder on everyday life, results of treatment, discussion of prognosis and a doctor
speaker. In general, these videos were 4 times longer in duration and (on average 4028
Page 14/22seconds in comparison to the average of all videos 1034) covered an entire gamut of
information.
Discussion
Quality Analysis:
The overall quality and reliability of the bipolar videos varied, but most were of good quality. Thus,
patients may gain the basic knowledge about BD on YouTube. Healthcare professionals have a duty to
provide their patients with reliable medical information. Since it is impractical to peer-review all videos
and other information on the internet, we have listed the top 6 highest quality videos on BD so that
physicians may share reliable educational YouTube content to their patients over online communications
(e.g. e-mail, social media, hospital websites). While there is research on other neuropsychiatric disorders
on the internet and on YouTube, our paper is the rst to cover an in-depth analysis on the quality and
reliability of BD.
Our study shows that YouTube contains adequate medical information concerning BD. However, there
were several factors which were often omitted, these included: the risks of each treatment, the
consequences of treatment, the bene ts of each treatment, how treatment would affect the overall quality
of life, how each treatment works, and possibility of more than one treatment option. Future video
creators may focus on these aspects as they are frequently omitted. Including this information would not
only increase the quality of the videos, but also the popularity. We suggest that medical institutions
tasked with publishing medical YouTube videos should consider our recommendations and use the
DISCERN tool as a checklist for what should be included in their videos to provide a valid information
package. We encourage hospitals to publish high quality and informative videos on BD and other medical
topics.
Optimization Analysis
Prior studies found that patients do not engage with the highest quality educational videos.(Desai et al.
2013) Our study has comparable ndings. Thus, it is critical for content creators (i.e. hospital staff and
medical professionals) to understand what makes a video attractive and engaging to the viewer. This
way, the most informative videos may be given attention instead of being ignored.
Our results show that videos containing an animation garnered the highest average daily views and VPI.
This demonstrates that visual aids may make videos more appealing to viewers. The presence of a
doctor speaker resulted in more comments, average daily views and VPI. This indicates that patients are
more inclined to watch and interact with videos uploaded from a credible medical professional. This is a
reassuring nding to know that patients appreciate or may be trying to reproduce the classical doctor-
patient interaction on a digital interface. The presence of a patient experience was another determinant of
high popularity indicating that patients value information coming from a relatable source.
Page 15/22Context
After deep analysis, the source of the videos with the highest popularity were more for entertainment
purposes, especially news channels or other educational channels rather than hospitals. Media has a
potent in uence on the public perception of any kind of illnesses.(Ross et al. 2019; Young et al. 2008)
Social media in uencers should be mentioned as they can often outshine medical authorities in terms of
tra c, views comments and popularity. Not to mention they pro t from YouTube with ads and
sponsorship deals.(Lindgren and Lundström 2019) There is no doubt that social media in uencers often
engage in mental health awareness as this is a popular topic among their viewers.(Belser Foster 2013)
With the majority of YouTube users being between 15-25 years old and 75% of mental health disorders
being manifested before the age of 24, it is understandable that mental health is a popular topic among
this demographic.(Aslam; [CSL STYLE ERROR: reference with no printed form.])
Taking all this into consideration, it is evident that the risk of misconception is high since media coverage
is bound to focus on details that create impact and interest. Therefore, it is of critical importance that
health care institutions use media as a type of communication to provide accurate and high-quality
information to the public. As noted previously, YouTube and other internet websites have gained more
active role in the life of patients and in their management of illness or disease. During epidemics such as
the recent novel corona pandemic, the role of telemedicine and online source of health information is
emphasized even more. Doctors need to be aware of this and provide reliable resources for their patients.
Previous YouTube quality studies found that physicians upload a relatively low number of educational or
medical videos on YouTube.(Madathil et al. 2015; Szmuda et al. 2020b) Our study matches this nding
as only 11.3% of the videos were published by physicians in our study. We encourage medical
professions to use our optimization analysis ndings to make their videos more appealing to the viewer.
Patients search the internet for medical information most often to learn about side effects from
prescription drugs or to obtain help from coping with their disease.(Conell et al. 2016) This is especially
important for patients with BD since the majority of them will inevitably turn to internet as a sources for
health information.(Conell et al. 2016) Our study showed that videos often lacked information regarding
how to cope with the disorder and what treatment they may undergo.
Patients and physicians may greatly bene t from empowering patients with un-biased and robust
medical information. It has shown to reduce diagnostic times, create online support communities and
encourage a more productive patient-doctor dialogue.(Madathil et al. 2015; Michalak et al. 2017; Naslund
et al. 2014; Nour et al. 2017; Sangeorzan et al. 2019)
Limitations:
One may argue that a physician with experience with BD, such as a psychiatrist, should be involved in the
video evaluation process. However, the DISCERN instrument was created for “patients and information
providers” and “was not dependent on specialist knowledge of a health condition or treatment”. In
addition, the two raters had an excellent intraclass correlation agreement indicating the quality analysis
Page 16/22study was reliable and conclusive. Moreover, the two independent raters were medical students both
having completed 90 hours of clinical rotations in psychiatry.
Future Directions:
Since this paper is a cross-sectional evaluation, we recommend that it be repeated within a few years to
monitor alterations of video content quality. Such studies may focus on how physician and hospital-
based health channels on YouTube provide medical content based and if it up to date with recent
evidence. Additional studies may be done to examine the extent to which patients with BD refer to
YouTube speci cally to gather information about their disease and whether they regard this information
as valuable.
Since only English videos were analyzed future studies may focus the differences in video quality in
various languages and geographical locations where there may be more stigmatization of mental
diseases.(Botha et al. 2006)
Conclusion
YouTube is often a good source of information on BD as it ful lls basic information required for patient
information. However, the quality of information may still improve particularly in regards to treatment
risks, consequences, bene ts and overall treatment options. The unregulated nature of YouTube means
that videos may fail to meet a higher standard in conveying medical information. Thus, care should be
taken by health professionals to provide reliable online information. We suggest that physicians reference
our list of the highest quality videos on BD. Since a doctor speaker and animation signi cantly optimized
a video for high audience engagement, we recommend that physicians create medical content on BD and
include animation in the video.
Declarations
ETHICS APPROVAL AND CONSENT TO PARTICIPATE: NOT APPLICABLE
CONSENT FOR PUBLICATION: NOT APPLICABLE
AVAILABILITY OF DATA AND MATERIAL: ALL DATA WAS AVAILABLE ONLINE
COMPETING INTERESTS: NOT APPLICABLE
FUNDING: NOT APPLICABLE
AUTHORS' CONTRIBUTIONS:
Szmuda, Tomasz- Methodology, Investigation, Formal analysis, Writing-original draft
Page 17/22Żydowicz, Weronika- Methodology, Investigation, Formal analysis, Writing-original draft
Ali, Shan- Methodology, Investigation, Formal analysis, Writing-original draft
Fedorow, Karolina- Methodology, Investigation, Formal analysis, Writing-original draft
Słoniewski, Paweł- Writing-original draft
ACKNOWLEDGEMENTS: NOT APPICABLE
AUTHORS' INFORMATION :
Szmuda Tomasz MD, PhD; Medical University of Gdansk, Neurosurgery Department
Żydowicz Weronika; Medical University of Gdansk
Ali Shan; Medical University of Gdansk
Fedorow Karolina; Medical University of Gdansk
Słoniewski Paweł MD, PhD, Professor; Medical University of Gdansk, Neurosurgery Department
References
Aslam S. YouTube by the Numbers (2020): Stats, Demographics & Fun Facts [Internet]. [cited 2020 Apr
13]. Available from: https://www.omnicoreagency.com/youtube-statistics/
Belser Foster C. Mental Health On Youtube: Exploring the Potential of Interactive Media to Change
Knowledge, Attitudes and Behaviors About Mental Health [Internet]. 2013. Available from:
https://scholarcommons.sc.edu/etd
Botha UA, Koen L, Niehaus DJH. Perceptions of a South African schizophrenia population with regards to
community attitudes towards their illness. Soc. Psychiatry Psychiatr. Epidemiol. [Internet]. 2006 Aug [cited
2020 Apr 13];41(8):619–23. Available from: http://www.ncbi.nlm.nih.gov/pubmed/16733630
Page 18/22Cassidy JT, Baker JF. Orthopaedic Patient Information on the World Wide Web. J. Bone Jt. Surg. [Internet].
Lippincott Williams and Wilkins; 2016 Feb 17 [cited 2020 Mar 1];98(4):325–38. Available from:
http://journals.lww.com/00004623-201602170-00012
Charnock D, Shepperd S, Needham G, Gann R. DISCERN: An instrument for judging the quality of written
consumer health information on treatment choices. J. Epidemiol. Community Health. BMJ Publishing
Group; 1999;53(2):105–11.
Cicchetti D V. Guidelines, Criteria, and Rules of Thumb for Evaluating Normed and Standardized
Assessment Instruments in Psychology. Psychol. Assess. 1994;6(4):284–90.
Conell J, Bauer R, Glenn T, Alda M, Ardau R, Baune BT, et al. Online information seeking by patients with
bipolar disorder: results from an international multisite survey. Int. J. Bipolar Disord. SpringerOpen; 2016
Dec 1;4(1).
Desai T, Shariff A, Dhingra V, Minhas D, Eure M, Kats M. Is content really king? An objective analysis of
the public’s response to medical videos on YouTube. PLoS One. 2013 Dec 18;8(12).
Koo TK, Li MY. A Guideline of Selecting and Reporting Intraclass Correlation Coe cients for Reliability
Research. J. Chiropr. Med. [Internet]. 2016 Jun [cited 2019 May 13];15(2):155–63. Available from:
http://www.ncbi.nlm.nih.gov/pubmed/27330520
Lam NHT, Tsiang JTH, Woo BKP. Exploring the Role of YouTube in Disseminating Psychoeducation. Acad.
Psychiatry. Springer International Publishing; 2017 Dec 1;41(6):819–22.
Lam NHT, Woo BKP. E cacy of Instagram in Promoting Psychoeducation in the Chinese-Speaking
Population. Heal. Equity [Internet]. 2020 Apr 1 [cited 2020 Apr 13];4(1):114–6. Available from:
https://www.liebertpub.com/doi/10.1089/heq.2019.0078
Lindgren S, Lundström R. Tube therapy: Dealing with mental health problems in social video comment
threads. First Monday [Internet]. 2019 May [cited 2020 Apr 13];24. Available from:
https:// rstmonday.org/ojs/index.php/fm/article/view/9569/7788
Madathil KC, Rivera-Rodriguez AJ, Greenstein JS, Gramopadhye AK. Healthcare information on YouTube:
A systematic review [Internet]. Health Informatics J. SAGE Publications Ltd; 2015 [cited 2020 Mar 8]. p.
173–94. Available from: http://www.ncbi.nlm.nih.gov/pubmed/24670899
Michalak EE, McBride S, Barnes SJ, Wood CS, Khatri N, Balram Elliott N, et al. Bipolar disorder research
2.0: Web technologies for research capacity and knowledge translation. J. Eval. Clin. Pract. Blackwell
Publishing Ltd; 2017 Dec 1;23(6):1144–52.
Mileva VR, Vázquez GH, Milev R. Effects, experiences, and impact of stigma on patients with bipolar
disorder. Neuropsychiatr. Dis. Treat. Dove Press; 2013 Jan 15;9(1):31–40.
Page 19/22Naslund JA, Grande SW, Aschbrenner KA, Elwyn G. Naturally occurring peer support through social media:
The experiences of individuals with severe mental illness using you tube. PLoS One [Internet]. Public
Library of Science; 2014 Oct 15 [cited 2020 Apr 13];9(10):e110171. Available from:
http://www.ncbi.nlm.nih.gov/pubmed/25333470
Nour MM, Nour MH, Tsatalou OM, Barrera A. Schizophrenia on youtube. Psychiatr. Serv. [Internet].
American Psychiatric Association; 2017 [cited 2020 Apr 13]. p. 70–4. Available from:
http://www.ncbi.nlm.nih.gov/pubmed/27524369
Rees CE, Ford JE, Sheard CE. Evaluating the reliability of DISCERN: a tool for assessing the quality of
written patient information on treatment choices. Patient Educ. Couns. [Internet]. 2002 Jul [cited 2019
May 13];47(3):273–5. Available from: http://www.ncbi.nlm.nih.gov/pubmed/12088606
Ross AM, Morgan AJ, Jorm AF, Reavley NJ. A systematic review of the impact of media reports of severe
mental illness on stigma and discrimination, and interventions that aim to mitigate any adverse impact
[Internet]. Soc. Psychiatry Psychiatr. Epidemiol. Dr. Dietrich Steinkopff Verlag GmbH and Co. KG; 2019
[cited 2020 Apr 13]. p. 11–31. Available from: http://www.ncbi.nlm.nih.gov/pubmed/30349962
Sangeorzan I, Andriopoulou P, Livanou M. Exploring the experiences of people vlogging about severe
mental illness on YouTube: An interpretative phenomenological analysis. J. Affect. Disord. [Internet].
Elsevier B.V.; 2019 Mar 1 [cited 2020 Apr 13];246:422–8. Available from:
http://www.ncbi.nlm.nih.gov/pubmed/30599364
Shen H, Zhang L, Xu C, Zhu J, Chen M, Fang Y. Analysis of Misdiagnosis of Bipolar Disorder in An
Outpatient Setting. Shanghai Arch. Psychiatry. Editorial Department of theShanghai Archives of
Psychiatry; 2018 Apr 1;30(2):93–101.
Szmuda T, Özdemir C, Fedorow K, Ali S, Słoniewski P. YouTube as a source of information for narcolepsy:
A content‐quality and optimization analysis. J. Sleep Res. [Internet]. 2020a Apr 21 [cited 2020 Apr
23];e13053. Available from: https://onlinelibrary.wiley.com/doi/abs/10.1111/jsr.13053
Szmuda T, Rosvall P, Hetzger TV, Ali S, Słoniewski P. YouTube as a Source of Patient Information for
Hydrocephalus: A Content-Quality and Optimization Analysis. World Neurosurg. [Internet]. Elsevier; 2020b
Mar 5 [cited 2020 Mar 7]; Available from: https://www.ncbi.nlm.nih.gov/pubmed/32147561
Weil AG, Bojanowski MW, Jamart J, Gustin T, Lévêque M. Evaluation of the Quality of Information on the
Internet Available to Patients Undergoing Cervical Spine Surgery. World Neurosurg. Elsevier Inc.;
2014;82(1–2):e31–9.
Young ME, Norman GR, Humphreys KR. Medicine in the popular press: The in uence of the media on
perceptions of disease. PLoS One. 2008 Oct 29;3(10).
Page 20/22Bipolar Disorder Statistics [Internet]. [cited 2020a Apr 15]. Available from:
https://www.dbsalliance.org/education/bipolar-disorder/bipolar-disorder-statistics/
Mental Health By the Numbers | NAMI: National Alliance on Mental Illness [Internet]. [cited 2020b Apr 13].
Available from: https://www.nami.org/learn-more/mental-health-by-the-numbers
iProspect Search Engine User Behaviour Study. 2006.
Social media “likes” healthcare [Internet]. 2012 Apr. Available from:
https://www.pwc.com/us/en/industries/health-industries/library/health-care-social-media.html
Erratum to “A Guideline of Selecting and Reporting Intraclass Correlation Coe cients for Reliability
Research” [J Chiropr Med 2016;15(2):155-163]. J. Chiropr. Med. [Internet]. 2017 Dec [cited 2019 May
13];16(4):346. Available from: http://www.ncbi.nlm.nih.gov/pubmed/29276468
Global digital population 2020 [Internet]. 2020 [cited 2020 Apr 13]. Available from:
https://www.statista.com/statistics/617136/digital-population-worldwide/
Figures
Figure 1
Qualitative content of videos about BD.
Page 21/22Figure 2
Source of the videos uploaded.
Figure 3
Mean score for each of the 16 questions of DISCERN.
Page 22/22You can also read