EU Building Stock Observatory - Workshop 2 31st January 2019 - ALDREN
←
→
Page content transcription
If your browser does not render page correctly, please read the page content below
EU Building Stock Observatory
Workshop 2

31st January 2019
Today’s event

The purpose of this second workshop is to:

►   Present the consortiums progress to date, against project objectives
►   Exhibit and demonstrate the revamped BSO website
►   Outline the consortiums proposals for the rationalisation of the BSO’s
    indicators and the data population plan
►   Introduce the Renovation/nZEB service contract
►   Present primary data collection progress to date
►   Outline a methodology to quantify the EU built stock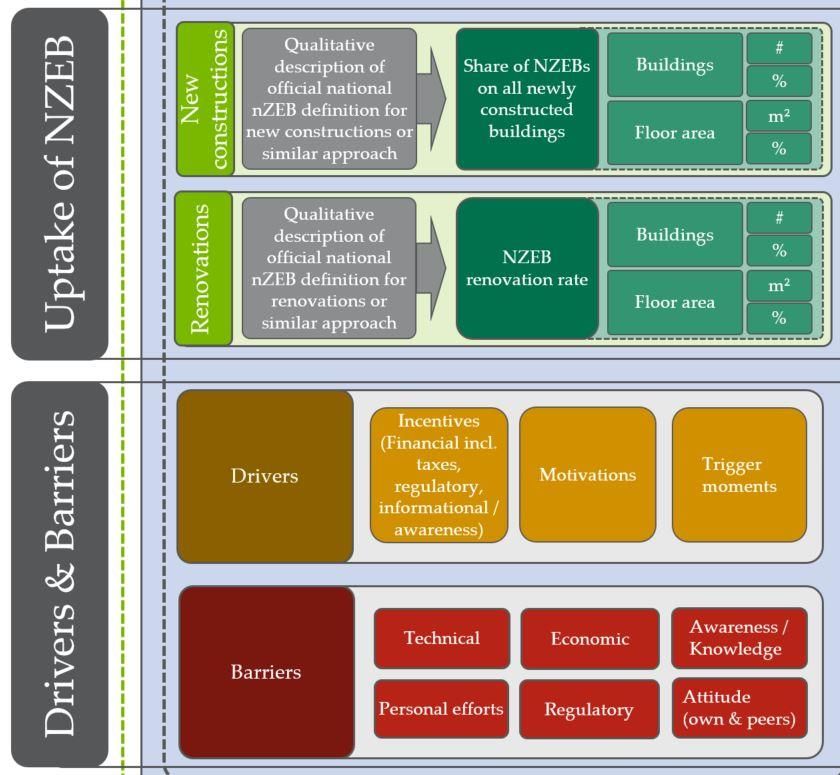
Agenda

►   13:30 – 14:00 Welcome and Registration
►   14:00 – 14:10 Introduction to the Workshop
►   14:10 – 14:25 Delivery and Progress Against Objectives
►   14:25 – 14:55 Presentation of the Revamped BSO Website
     ►  Demonstration
     ►  Feedback
►   14:55 – 15:15 BSO Data Rationalisation and Population
     ►  Original data position
     ►  Rationalisation of BSO indicators
     ►  Population of BSO indicators
     ►  Proposed data position
►   15:15 – 15:30 Coffee Break
►   15:30 – 15:50 Progress Update
     ►  Service contract – Comprehensive study of building energy renovation activities and the
        uptake of nZEBs in the EU
►   15:50 – 16:20 Data Collection Progress to Date
     ►  Survey response rates and coverage
     ►  Quantifying the built stock in MS
►   16:20 – 16:30 Questions, Next Steps and Closing Remarks
►   16:30 – 17:00 Close and Networking
Setting the Scene
Dimitrios Athanasiou (DG ENER)
An initiative of the European Commission’s
Directorate General for Energy (DG ENER)

  The Evaluation of the Energy Performance of Building Directive
  2010/31/EU stated that there is a lack of quality, reliable and
consistent data on the actual effect of energy efficiency policies on
          the building stock across EU Member States

 A better understanding of the effectiveness of policy measures and
      of market support mechanisms is necessary: to steer an
   improvement in the depth and rate of buildings’ renovation

 More transparent information on building stocks will: better inform
 policy makers, supporting the decisions of market players, in
                particular financial institutions
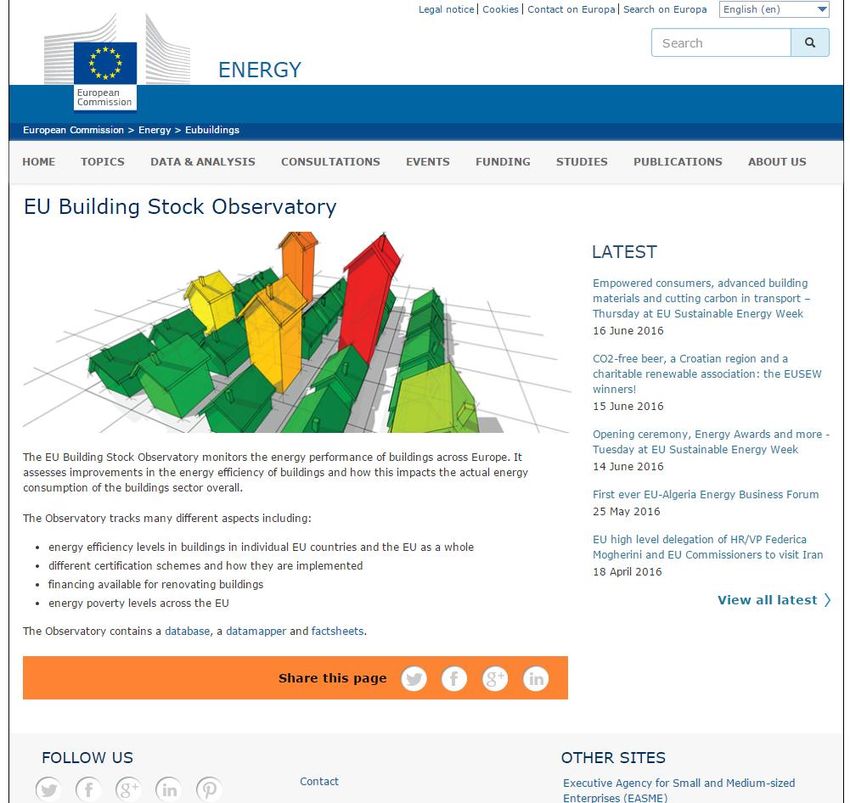
EU Building Stock Observatory
• development of a
list of relevant
indicators
• a methodology for
1st phase
data collection
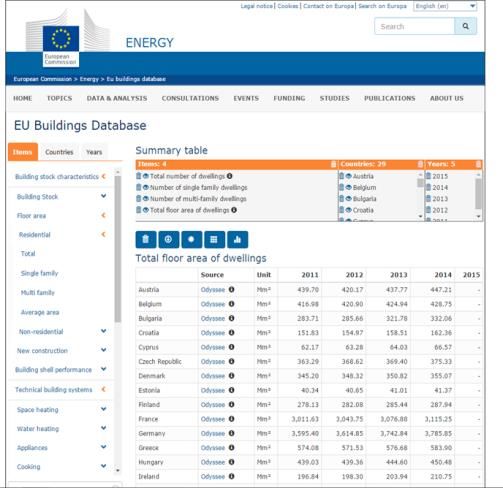
• a website which
contains a
database, a
datamapper and
factsheets
https://ec.europa.eu/energy/en/eubuildings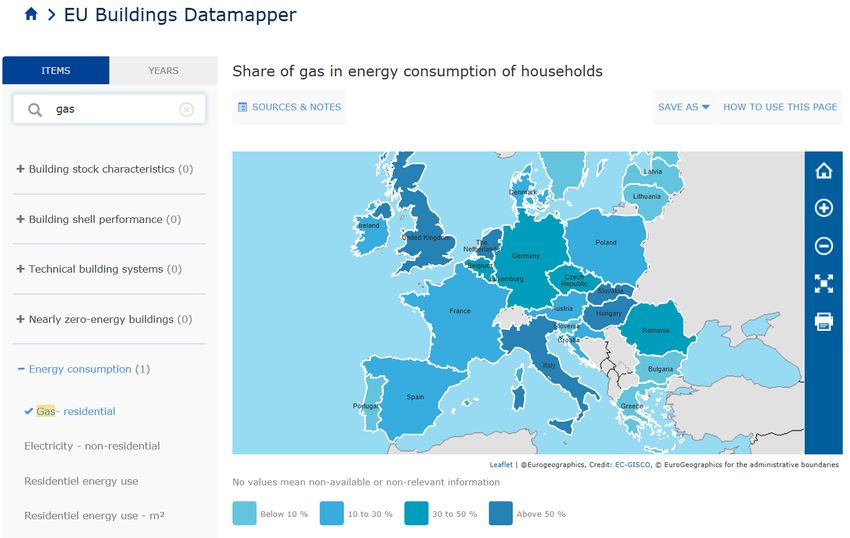
Rationale of the EU BSO

  The EU BSO is an “essential piece” of the EU’s building energy
  efficiency policies……….
Data provided in the Observatory will:

• contribute to the improvement of the way the building sector is being considered in
  economic modelling of energy efficiency policy options
• support monitoring the effect of the EPBD implementation, as well as of relevant
  articles of the EED (i.e. Art. 4-5) and of the RED (i.e. Art. 13-14) at national and
  regional levels
• contribute to future policy making and support the review process of EU directives

 Our intention is to provide a useful tool that supports decisions related to the
  energy performance of buildings, but also informs policy decision making,
   helps academics develop studies and research, financiers benchmark
               different scenarios, and assist other stakeholders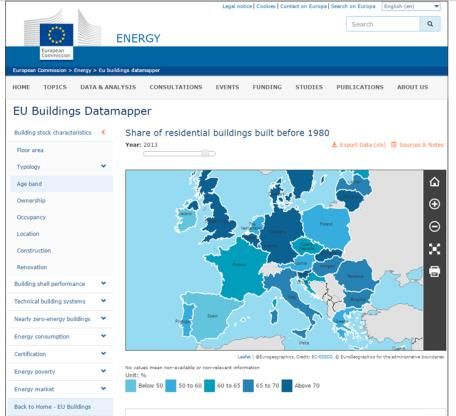
Phase 1 development

Launched in November 2016, following Phase 1 development by a consortium led
by BPIE, the BSO has two primary objectives:

       Provide a snapshot of the
         energy performance of
      the EU building stock, and
       provide high-quality data
       from all Member States in
            a consistent and
          comparable manner

         Set a framework /
        methodology for the
      continuous monitoring of
         the building stock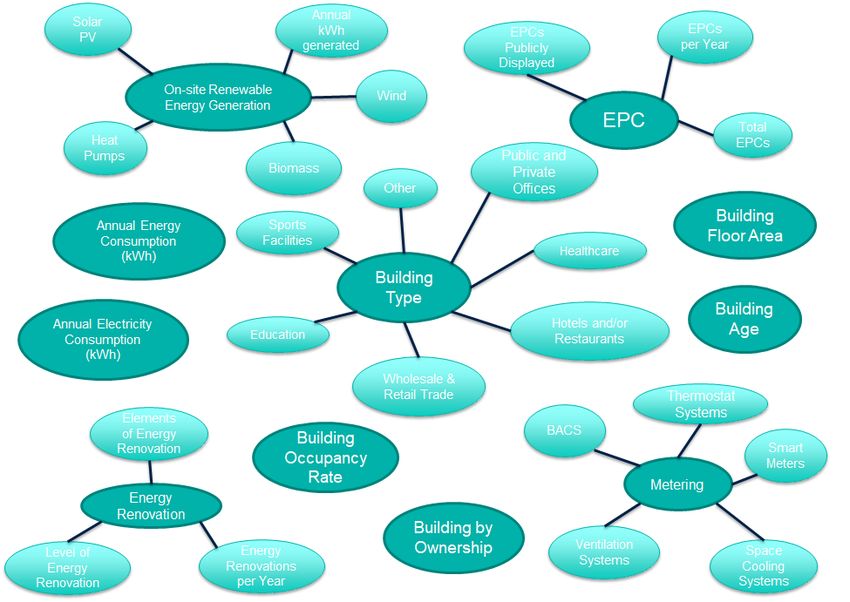
Continuation

In the 1st phase of the EU Building Stock Observatory, data gaps and
limitations to the data collection, aggregation and comparison across
EU Member States were identified

The BSO was online but some features did not work properly so are
being revamped

The intention of the 2nd phase is for the continuation of the EU BSO but
also to:
- Fill the data gaps,
- Provide better data and statistics to its users,
- Rationalize the indicators, and
- Revamp the website in order to make it more user friendly
Phase 2: Delivery and Progress Against
                            Objectives
                      David Crosthwaite (RICS)
Phase 2 delivery Three partner organisations with expertise in the built environment, energy efficiency and software development Three-year contract from mid 2017 through to mid 2020……
Phase 2 deliverables

The Consortium are set to deliver three remaining tasks over the next 18 months:

                                    Task 1:
                                  Maintenance
                                     of the
                                    website
                                   ONGOING

              Task 5: Big
                  data                                   Task 2: Data
               feasibility                                gap filling
                 study                                    ONGOING
              COMPLETE            Continuation
                                   of the EU
                                      BSO

                        Task 4:
                                                 Task 3: Data
                        Website
                                                  acquisition
                        revamp
                                                  ONGOING
                       COMPLETE
Progress to date Remaining tasks are focussed on improving the existing data position within the BSO Deliverable Status Task 1: Maintenance and update of the Ongoing BSO website Task 2: Data validation, quality control Ongoing and gap filling Task 3: Data acquisition via data To follow after data collection phase allocation budget completed Task 4: Revamping the existing website Completed Task 5: Big data feasibility study Completed
Task 1 Progressing

T1: Maintenance and update of the BSO website
Deliverable                            Status
Quarterly update                       Ongoing updates of open source data to
                                       populate BSO
Indicator review and recommendations   Completed, but likely to be ongoing
                                       process as data collection proceeds
Maintenance response                   To follow once revamped existing website
                                       goes live
Handover strategy                      To follow once revamped existing website
                                       goes live
Propose new indicators                 To follow once feedback has been
                                       received regarding the indicator review
Task 2 Progressing
T2: Data validation, quality control and gap filling
Deliverable Status
Review existing data strategy Reviewed existing data sources and
calculation methodologies and engaged
new EU projects to identify potential data
sources and gaps
Data validation and quality control Developed QA/validation process
Develop data gap closing method Primary data approaches developed and
launched, currently live
Close data gaps Ongoing activity/work in progress –
survey live until early 2020
Stakeholder workshops First workshop successfully delivered
Annual revision process To be delivered based on the aboveTask 3 Progressing
T3: Data acquisition via data allocation budget
Deliverable Status
Engage with National data partners Alternative approach to utilisation of data
allocation budget to be progressed
Target member states and topics that To progress once primary data collection
represent persistent data gaps phase complete
Achieve ENER sanction and procure data To follow once approach agreedTask 4 Completed T4: Revamping the existing website Deliverable Status Exploration documentation regarding Completed Sept 17 existing website and tools Ideation documentation regarding Completed Oct 17 potential solutions available to ENER Execution and delivery of revamped Completed Dec 18 website and tools
Task 5 Completed

T5: Big data feasibility study
Deliverable                               Status
Development of potential Big Data         Completed August 2018
options available to ENER

Provide a cost benefit analysis of each   Completed August 2018
option

Recommend long-term sustainable data      Completed August 2018
collection strategy
Presentation of the Revamped BSO
                          Website
                    Dave Jeavons (RICS)
Website revamp: what we have delivered
Achievements How we delivered
The website revamp has a new UI/layout that reflects user We reached out to our own pool of experts and delivered an online
expectations experience that was positively received by stakeholders/testers
Optimal view and interaction experience across a wide range of Support for desktop, laptop, tablet and smartphone has been
devices optimised
Responsive website design As measured during our interactive session at the first workshop
Improved navigation, user friendly UI Following comprehensive UX design we delivered tools that were
considered easy to use by stakeholders/testers
Flexibility for potential introduction of new tools Improvement to the code base has increased the stability and
performance of the BSO website thus facilitating the introduction of
new tools as required
Flexibility to allow for the introduction of new data and potential Ability to add regional and MS data is now feasible when new data
new indicators for regional data and new MS becomes available
Two new data visualisation tools for data and indicators in the form All graphs and tables now allow for the data to be downloaded in a
of graphs and related tables as well as the ability to download data number of formats
in different formats
The presentation and analysis of time series is now flexible. We have provided the ability to select multiple years and display
Permitting the display of current annual data and historical data the associated data
In addition, we have also delivered: Improved performance across all three data tools;
Datamapper and Factsheet tools now work correctlyWebsite revamp: what we have delivered
• Improved selection of
items Improved the display of selected
• Implemented a powerfulitems each of which are
search filter selectable to filter the results
further.
Intuitive download
options. CSV for
tabular data and
image formats for
graph viewsWebsite revamp: what we have delivered
Ability to change your view of
the data using the settings
functionalityWebsite revamp: what we have delivered
Consistent navigation
and search mechanism
across all BSO toolsWebsite revamp: what we have delivered
Factsheets now
display content for
all topics and
countries
• Ability to download each
individual graph and table
in appropriate formats
• Switch between tabular
and graph view for each
individual sectionBeta website Access to the beta version of the revamped website: ► http://euobs.ukwest.cloudapp.azure.com/en/eu-buildings-database ► http://euobs.ukwest.cloudapp.azure.com/en/eu-buildings-datamapper ► http://euobs.ukwest.cloudapp.azure.com/en/eu-buildings-factsheets ► user: preview ► pass: En6rTesT
Data Rationalisation and Population
                       Rosie Rich (RICS)
Data structure There are six data topics contained within the current structure of the BSO *Applicable only to residential built stock
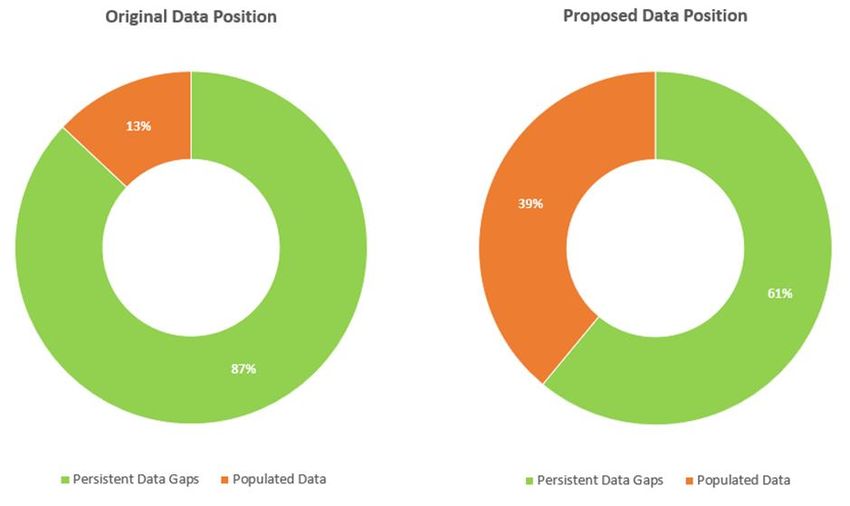
Original data position

Data population and persistent data gaps
►   The BSO database has historically had significantly low levels of data
    population
►   The BSO currently contains approximately 70,000 individual data points
    (2,400 per MS), of which 87% are not currently populated with data

                              ►   The most significant data gaps occur for Non-
                                  Residential buildings in:
                                   ► Topic 1 (Building Stock Characteristics); and

                                   ► Topic 2 (Technical Systems);

                              ►   These two topics are our current priority for data
                                  collection and population
Data position….continued
Residential
By Member State and building type
► Most MS have more than 80% of their data 22%
missing, or put another way less than 20% of
the current indicators are populated with data
► France has the highest level of data
population with 16% of filled data points
78%
► Croatia is at the lower end with 11% of data
points filled
Non-residential
► The Residential building sector is the most
populated with 22% of its data available 6%
► The Non-Residential building sector has
significantly less data, with only 6% of its
data points filled
► Collecting data for non-residential buildings
has therefore been highlighted as a priority
94%
Populated Data Points Persistent Data GapData position……continued
Data by source
► Of the 13% of data present in the BSO database, approximately:
► 8% is sourced from high quality, reliable data: National Statistics,
Eurostat and Odyssee-Mure
► 5% is sourced from completed EU Projects: Tabula, Entranze, Inspire
etc.
Frequency of data input
► Of the 13% of data present in the BSO database, approximately:
► 4% of the data entries are regularly inputted for each year and cover
each MS
► 9% of the data entries are temporally inputted yearly (1-5 entries) and
sporadically inputted across MSApproach to addressing data gaps
Primary and Secondary data collection is a necessity:
► To address the data gaps the consortium have developed a 3-stage plan:
1. Rationalise the original set of indicators within the BSO
2. Collect “real” non-residential building data through an online survey and
a series of focus interviews
i. Which will permit bottom up modelling, which can be benchmarked
against the top down data currently held in the BSO
ii. Assumptions used to model the quantity, type, size and age of the
built stock will be based on real building data where available
3. Collaborate with other “live” EU projects that are capturing useful and
relevant data (i.e. nZEB service contract)Rationalisation of indicators
Rationalisation to remove certain indicators from the public domain
► In order to address some of the persistent data gaps the consortium have
devised a rationalisation plan
► The rationalisation identifies indicators with certain characteristics which
we propose are removed from the public domain
► These indicators could be “mothballed” until data becomes available i.e.
from smart metering etc
► Some of the characteristics include:
► Duplication of indicators (e.g. Number of Dwellings)
► Data not available to the public (e.g. EPCs per year)
► Data not known or measured (e.g. EPCs per size of building)
► The proposed rationalisation recommends that 69% of the existing
indicators are hidden from the public domain
► Removal of the proposed indicators would improve the data population to
36% (an increase of 23%)BSO population plan
To further contribute towards data gap closures
► The consortium regularly source data from National Statistical Offices,
Eurostat and Odyssee-Mure databases
► The consortium have been investigating data synergies between other EC
funded projects (e.g. Renovation/nZEB project)
► The consortium have implemented two primary data collection
approaches:
► Non-residential online survey (RICS)
► A series of non-residential focus interviews (BSRIA)
► The primary data collection tools address approximately 18% of the entire
BSO database
► Potential synergies between data partners is anticipated to address a
further 10% of the BSO data populationProposed data position Data position following rationalisation and population ► The population of data points within the BSO would increase by 26%
Coffee Break
COMPREHENSIVE STUDY OF
                 BUILDING ENERGY
                 RENOVATION ACTIVITIES AND
                 THE UPTAKE OF NEARLY
                 ZERO ENERGY BUILDINGS

              • Dr. Andreas Hermelink,
                Sven Schimschar

36 / ©2019 NAVIGANT. ALL RIGHTS RESERVED
TABLE OF CONTENTS
1. PROJECT OVERVIEW
2. DESCRIPTION OF ACTIVITIES
- Task 1 – Development of a methodology and its application in different
countries
- Task 2 – Detailed study of building energy renovation and NZEB uptake
trends in EU-28
3. EXPECTED DELIVERABLES
37 / ©2019 NAVIGANT. ALL RIGHTS RESERVEDPROJECT OVERVIEW 38 / ©2019 NAVIGANT. ALL RIGHTS RESERVED
PROJECT OVERVIEW

• IPSOS (formerly GfK) & Navigant (formerly Ecofys)
• Statistical, comprehensive analysis of renovation and NZEB uptake in EU 28
• Complements Building Stock Observatory (BSO)
• 3 large scale surveys
  - Consumers
  - Architects
  - Installers
• Complex methodology => new set of indicators to measure & monitor
  - renovation rates per renovation depth,
  - investments per renovation depth,
  - energy savings per renovation depth and
  - uptake of NZEBs.
• Residential & and non-residential, all EU & each MS, 2012-2016.
• Duration: 11/2017 – 03/2019 (potential extension until 06/2019)

39 / ©2019 NAVIGANT. ALL RIGHTS RESERVED
2. DESCRIPTION OF
                                           ACTIVITIES

40 / ©2019 NAVIGANT. ALL RIGHTS RESERVED
PROJECT GOALS & STRUCTURE
OVERVIEW
Undertake a robust statistical and comprehensive analysis of the renovation
Overall
activities and NZEB uptake in the EU28 to complement the EU Building
Goal Stock Observatory
Task 1
Development of a methodology and
its application in the different countries
Task 2
Detailed study of building energy renovation and
uptake trends in EU-28
41 / ©2019 NAVIGANT. ALL RIGHTS RESERVEDPROJECT TASKS
TASK 1 – OVERVIEW AND INTERDEPENDENCIES
→ 1) Development of a set of indicators
→ 2) Methodology development
→ 3) Development of questionnaires
42 / ©2019 NAVIGANT. ALL RIGHTS RESERVEDPROJECT TASKS
WP1.1 & WP1.2: DEVELOPMENT OF A SET OF INDICATORS
• Evaluation and review of relevant existing building observatory indicators
- overlaps, inconsistencies, gaps , need for adaptations / deletions / new
indicators
- revision of indicators
• Updated set of relevant indicators
- Precise definitions
- Allows exact determination of data to be collected
- Optimized for data collection and processing
- Allows to measure and monitor renovation of EU building stock for EU
and all 28 MS
43 / ©2019 NAVIGANT. ALL RIGHTS RESERVEDPROJECT TASKS
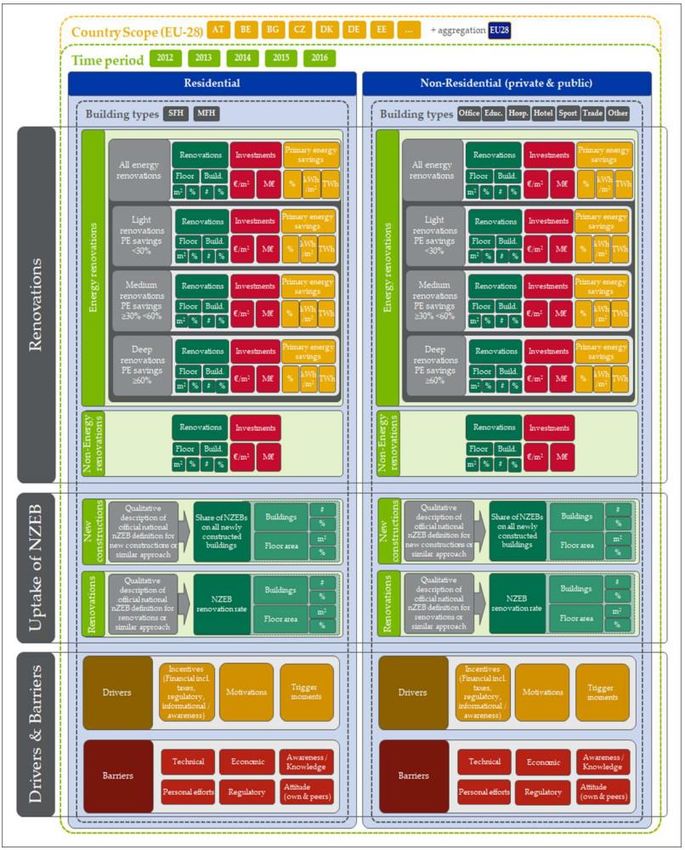
WP1.1 & WP1.2: DEVELOPMENT OF A SET OF INDICATORS
• Separation by residential
and non-residential
• Separation by different
building types
• Main indicator segments:
o Renovations
o Uptake of NZEB
o Drivers & Barriers
• Renovations: Information
separated by renovation
depth:
o Quantity of renovations
o Investments
o Energy savings
• Results presented in floor
area, buildings, absolute
and relative numbers
• Drivers and Barriers
separated into different
sub-categories
44 / ©2019 NAVIGANT. ALL RIGHTS RESERVEDPROJECT TASKS
WP1.3, WP1.4 & WP1.5: METHODOLOGY DEVELOPMENT
Component specific renovation rates:
Calculated
renovation rate
from boiler
retrofits: 0.8%
Calculated Calculated
renovation rate renovation rate
Information from from insulation from radiators:
measures: 0.5% 0.5%
surveys
Weighted energy
Calculated related renovation Calculated
renovation rate renovation rate
from window rate (considering from exterior
replacements: 1% overlaps between doors: 0.9%
measures)
Market
Calculated Calculated
extrapolation renovation rate
renovation rate
using market from PV systems: from air-
2.1% conditioning
data systems: 0.4%
Calculated
renovation rate
from ventilation
systems: 0.3%
45 / ©2019 NAVIGANT. ALL RIGHTS RESERVEDPROJECT TASKS WP1.6: DEVELOPMENT OF QUESTIONNAIRES • Iterative development process between Navigant and Ipsos for three questionnaires • Questionnaires designed for - getting all information needed for methodologies - Filling all indicators • Simultaneous development of three questionnaires - ensure consistency - allow cross linkages 46 / ©2019 NAVIGANT. ALL RIGHTS RESERVED
PROJECT TASKS
TASK 2 - WP2.1 – EXECUTION OF SURVEYS

                                                                                       Survey of main contractors
                             Consumer survey               Architects survey
                                                                                             and installers

        Coverage                                                 EU28

        Method            CAWI, GfK online panels                 CAWI                              CATI

        Sample size               n=16 800            n=1 500 (fieldwork ongoing)                 n=1 990

                                                                                          Construction companies
                                                          Architects involved in
        Target         Consumers having undertaken                                     involved in renovation activities
                                                       renovation activities and new
        group             residential renovations                                       and new constructions (NZEB
                                                      constructions (NZEB relevant)
                                                                                                   relevant)

                                                       Focus on non-residential
                                                                                        Collect data on the demand,
                        Collect data on residential   buildings but also aspects on
                                                                                       supply chain and quality of the
        Objective      building renovations and new      residential buildings are
                                                                                       works in residential and non-
                               constructions                     covered
                                                                                           residential buildings

47 / ©2019 NAVIGANT. ALL RIGHTS RESERVED
PROJECT TASKS
TASK 2 - WP2.1 – STRUCTURE OF THE CONSUMER SURVEY
Tier 1:
- Recruitment and screening of respondents
that have experience with energy renovation
- Calculation of incidence of renovations in
each EU Member State
Tier 2:
- Consumers that have engaged in energy-
related renovations during 2012-2016.
- Insights into:
• Depth of renovation
• Materials used
• Costs & benefits
• Drivers, barriers & incentives
48 / ©2019 NAVIGANT. ALL RIGHTS RESERVEDPROJECT TASKS
TASK 2 - WP2.1 – STRUCTURE OF THE ARCHITECT SURVEY
Information about
energy-renovations for
Non- reference project
residential
reference
project General market insights
or
NZEB uptake
Residential
reference
project
Drivers, barriers & incentives
49 / ©2019 NAVIGANT. ALL RIGHTS RESERVEDPROJECT TASKS
TASK 2 - WP2.1 – STRUCTURE OF THE CONSTRUCTION COMPANY SURVEY
Installers Insights
- Façade
- Windows • Understand the demand
- Heating systems and supply chain and the
- Photovoltaic systems, quality of the works
75% air-conditioning or related to energy
electric heating efficiency and NZEB
25% - Roof • Drivers, barriers &
- Mechanical ventilation incentives
Main
Contractors
50 / ©2019 NAVIGANT. ALL RIGHTS RESERVEDPROJECT TASKS
TASK 2 - WP2.2 – PREPARATION OF SURVEY RESULTS
Data cleaning and validation
• Screening Phase: systematically looking for problems with the data
• Diagnostic Phase: identifying the condition of any suspect data
• Treatment Phase: deleting or editing the data or leaving it as is as appropriate
Data weighting
Making results representative for the national
population in terms of socio-demographic
characteristics for each of the countries surveyed
In-depth analysis Data file
Analysing the results of the three surveys at EU and
cleaned and restructured
country level. Presenting results according to
microdata from all three
additional breaks (e.g. age, gender, other socio-
surveys in Excel and SPSS
demographic characteristics, country grouping etc.).
51 / ©2019 NAVIGANT. ALL RIGHTS RESERVEDPROJECT TASKS
TASK 2 - WP2.3 & WP2.4 – BUILDING STOCK & NEW CONSTRUCTION
Level of detail of information for EU28 building stock inventory and new constructions
Collect data by:
Building types
Building Stock data (WP 2.3)
Single family houses
- Update and revision of IA EPBD
Multi family houses
Offices inventory
Educational buildings
Hospitals → Needed to calculate the
Hotels and restaurants renovation rates
Sports facilities
Wholesale and retail trade services buildings
Other types of energy-consuming buildings New Construction data (WP 2.4)
- EUROCONSTRUCT and EECFA
data
Units - other literature (e.g. long-term
renovation strategies) and IPSOS
Building floor area (m²) local offices
Number of Buildings (#)
→ Needed to calculate the share of
Years NZEB buildings in new
constructions
2012 - 2016
52 / ©2019 NAVIGANT. ALL RIGHTS RESERVEDPROJECT TASKS
TASK 2 - WP2.5 – DATA PROCESSING
Indicators to be assessed per MS:
Building energy renovation
Applying approaches as • Renovation rates by renovation
developed in task 1: depth
• Investments
• Component specific renovation • Energy savings
rates • Context / determinants of
• Overall renovation rates (per renovation rates and depths
renovation depth) based on survey:
• Calculation of investment costs • Drivers Aggregation of
• Calculation of energy savings • Barriers country results
on EU scale
NZEB uptake new constructions
• Number of newly constructed
NZEB
• Share of newly constructed NZEB
53 / ©2019 NAVIGANT. ALL RIGHTS RESERVED3. EXPECTED
DELIVERABLES
54 / ©2019 NAVIGANT. ALL RIGHTS RESERVEDMAIN PROJECT DELIVERABLES
• Filled indicators
• Report
- comprehensive country chapters for each Member State
- will distinguish between renovation work and NZEB uptake trends
- renovation rate, depths and resulting savings on Member State level and EU28
level
- comprehensive descriptive analysis
- visualised data from all three surveys as graphs and charts.
55 / ©2019 NAVIGANT. ALL RIGHTS RESERVEDBSO Data Collection Progress to Date
David Crosthwaite (RICS)Survey instruments
On-line survey and focussed interviews
► We are collecting data from real buildings, asking respondents specifically
about the building they occupy
► “Real” building data will permit bottom up modelling which can be
benchmarked against the top down data currently held in the BSO,
thereby ensuring it’s continued relevance
► The primary data collection tools were designed to address persistent
data gaps in both priority topics:
► Topic 1 (Building Stock Characteristics); and
► Topic 2 (Technical Systems)Primary data collection
We are collecting data concerned with:
► Building stock by building type: Public and Private Offices, Wholesale &
Retail Trade, Healthcare, Hotels and/or Restaurants, Educational, Sports
Facilities, Other
► Building stock by age, and Building floor area
► Building ownership, Occupancy rates, and Operational hours
► EPC’s: Total, year, and whether its publicly displayed
► Energy renovations
► On-site renewable energy generation
► Metering systems: Smart meters, thermostats, cooling, ventilation, and
BACS
► Technical systems: Heating, cooling, hot water, lighting
► Annual total energy consumption, and electricity consumption (kWh)Topic 1: Gap filling
► Completed survey responses received: 202 (January 2019)
► Geographically: 27 of the EU 28 MS are covered, leaving 1 MS with no
representation
► The majority of the responses currently cover both private and public
offices (109 and 23 responses respectively)
MS Coverage of Survey ResponsesTopic 2: Gap filling
► Topic 2 Technical Systems
Non Residential Indicators
► 194 indicators
► BSRIA Primary data collection
► Focussed interviews (May – Dec 2018)
► BSRIA data (June – Sept 2018)
BSRIA
data
Online Targeted
survey Interviews
Topic 2 - EU
Observatory
IndicatorsFocussed interviews
► Questionnaire addresses ~60%
Focused Interview Data Coverage by Age of Building Stock
missing indicators
► Topics Addressed: >2010Focussed interviews - progress
► Total interviews – 58 (January 2019) Focused Interview Data Coverage by Building Type
► No. of countries addressed – 25
► Countries not addressed – HU, IE, SK Other
(Social Care,
Exhibition Centre) , Private Office, 15
9
Country Interviews Country Interviews
Warehouse, 3
AT 2 IE 0
BE 2 IT 2
BG 4 LV 2 Sports
Facilities, 5
HR 2 LT 2
CY 2 NL 2 Public Office, 5
CZ 3 PL 2
DE 2 PT 2 Wholesale
and Retail Trade, 2
DK 2 RO 2 Education, 11
Hotel and/or
EE 2 SK 0 restaurant, 4
Health Care, 4
ES 2 SL 3
FI 3 SE 2
FR 2 MT 2
GR 2 LU 2
HU 0 UK 2Primary data collection: moving forward
► GDPR legislation has hindered the survey process
► Not currently a representative distribution across all MS and building types
► Utilised organisational survey platform and “opted in” respondents list to
boost survey returns
► Moving forward, need to focus on respondents from MS where we have
no responses
► Followed by focus on the 8 MS that have 1-4 responses
► Then the 4 MS with 5 responses
► Further focus on Wholesale and Retail buildings (6 responses),
Healthcare (4 responses), and Sports Facilities (4 responses) as a first
priority
► Second priority Hotels and/or Restaurants (10 responses), and
Educational buildings (16 responses)
► We are currently in the process of looking at where the Task 3 data
allocation budget could be utilised to boost survey coverageIndicators addressed by the surveys
Utilising primary data

Application of primary data
►   Once there has been a sufficient amount of primary data collected
    indicators with missing data can be populated with modelled data
►   The survey data is expected to close around 18% of the persistent data
    gaps within the BSO database
►   The need to model the data to be representative of each individual MS is
    due to several factors:
     ► Even with the anticipated survey returns this only equates to data for

        around 10 buildings per MS
     ► 280 buildings representing the entire EU non-residential built stock (10

        per MS), is simply not representative
►   There is therefore a need to estimate the quantum of the EU built
    stock
Quantifying the EU built stock
Modelling the EU non-residential sector
► Measurement of the quantum of the built stock is fundamental to
understanding the implications of future energy efficiency adaptation
► However, a census of the built stock is not achievable within the
constraints of this research
► The amount of data anticipated to be collected from the primary data tools
could never be representative of the position in individual EU MS
► Baseline estimates are therefore being prepared quantifying the volume of
the built stock across 28 MS via:
► Synthesised/imputed approach for the non-residential stock
► Census returns for the residential stock, adjusted using demolition/
construction ratesQuantifying the EU built stock
Modelling the built stock: Raw data
► The consortium contacted the National Statistical Office in each MS to try
to obtain:
► Total non-residential buildings stock (k),
► Total non-residential building floor area (m2),
► Stratified by the seven non-residential building types
► 18 MS responded that they had no available data
► Main response being that these data simply don’t exist
► 4 MS didn’t respond to our request
► 6 MS provided absolute data on the non-residential built stock
► 2 MS gave data from the 2011 census
► Austria and Greece
► 4 MS gave data correct from 01.01.2018
► Estonia, Finland, Netherlands and SloveniaQuantifying the EU built stock
Methodology
1. The average number of non-residential buildings was calculated from the
six absolute values provided
2. The average land area (km2) of these 6 MS was also estimated
3. The average number of non-residential buildings, was divided by the
average land area of the 6 MS. To give the average number of non-
residential buildings per km2
4. The average number of non-residential buildings per km2, was then
multiplied by land area per MS (km2) to give the estimated non-
residential building stock per MSQuantification of the non-residential built stock Estimated total non-residential built stock numbers Highlighted cells indicate MS which provided absolute NR built stock numbers
Application of stock data

►   By quantifying the total number of non-residential buildings, by MS and
    also by building type, further assumptions and calculations can be carried
    out to address a substantial number of persistent data gaps
►   Numerous indicators present in the database have sub-indicators by total
    number of buildings and then by type (e.g. EPC’s per year by building
    type, total energy consumption by building type, etc.)
►   It would be useful to compare our estimates to those prepared by others
    i.e. KIDs data
►   Once the scale and nature of the EU built stock is defined, the energy
    performance and energy efficiency factors can then be further understood
Next steps
► Focus on data collection and closing data
Enhanced gaps
cooperation with
Concerted Action ► Surveys designed to capture built stock
EPBD, Member characteristics across 28 MS
States and industry ► Focused interviews relating to the
technical systems of buildings
► Work with other EU projects to capture all
Enhanced available data
cooperation with ► Quantify EU building stock
Eurostat ► Procure data sets that appropriately
supplement the EU BSO
► 3rd BSO workshop Spring 2020
Further development • Regional breakdown of EU buildings data
and potential • Modelling of building stock
additional features: • Big data and artificial intelligenceSpecial plea We’d be very grateful to receive additional data from you, the more we can collect the more robust any estimates contained within the BSO will be. To complete the survey follow the link: ► EU BSO Non-residential Building Stock Survey
Workshop feedback

If you have a moment please fill out the feedback form for the
conference

►   https://www.surveymonkey.co.uk/r/EUBSO
Questions, Closing Remarks and Networking
                          David Crosthwaite (RICS)
You can also read