Moisture Performance of Façade Elements Made of Thermally Modified Norway Spruce Wood
←
→
Page content transcription
If your browser does not render page correctly, please read the page content below
Article
Moisture Performance of Façade Elements Made of
Thermally Modified Norway Spruce Wood
Miha Humar * , Boštjan Lesar                   and Davor Kržišnik
 University of Ljubljana, Biotechnical Faculty, Department for Wood Science and Technology, Ljubljana SI1000,
 Slovenia; bostjan.lesar@bf.uni-lj.si (B.L.); davor.krzisnik@bf.uni-lj.si (D.K.)
 * Correspondence: miha.humar@bf.uni-lj.si

 Received: 25 February 2020; Accepted: 19 March 2020; Published: 20 March 2020

 Abstract: Wooden façades are gaining in importance. Thermally modified wood is becoming one of
 the preferred materials for claddings. In spite of the fact that façades made of thermally modified
 wood have been in use for more than two decades, reports about long-term monitoring have been
 sparse. The results of three-year monitoring of a façade made of thermally modified wood in Ljubljana
 are reported. Moisture content measurements of thermally modified façades were taken at 22 locations
 and compared to the moisture content of untreated Norway spruce wood. Temperature and relative
 humidity were recorded in parallel. The moisture content of the wood was compared to the average
 relative humidity before the measurements. The results confirm the lower moisture content of
 thermally modified wood in comparison to reference Norway spruce. The moisture content of the
 wooden façade could be best correlated with the average relative humidity and temperature 48 h
 before the wood moisture content measurement was taken.

 Keywords: thermally modified wood; cladding; performance; sorption properties; water
 exclusion efficacy

1. Introduction
      The construction sector consumes 40% of materials, 17% of freshwater and is responsible for
40%–50% of global greenhouse gas emissions [1]. One of the attempts to improve the environmental
performance of this sector is to use more renewable materials. Wood is one of the most important
renewable materials in construction applications due to its excellent mechanical properties and pleasing
visual appearance. In addition to construction applications, wood in exterior applications also has
to fulfil aesthetic requirements [2]. This is predominately important for façades. Low maintenance
costs, broad accessibility and relatively simple production and mounting contribute to the increasing
popularity of wooden façades. Furthermore, [3] showed that a wooden façade is favourable in terms
of greenhouse gas emissions, compared to other materials such as brick, fibre cement and steel.
Wooden façades can be made of untreated wood (predominately softwoods), wood treated with
biocides or modified wood [4].
      In recent decades, there has been a considerable increase in the use of thermally modified wood for
cladding [5]. Modification of wood is defined as the persistent change of wood with the aim of increasing
its inherent durability, as well as for enhancing its dimensional stability and other relevant properties [6].
The key benefit of thermally modified wood is to make abundant, non-durable wood species, such as
pine, spruce, poplar or aspen, more durable and dimensionally stable. They thus perform more like
durable wood species, at least in above-ground applications [4,7]. Thermal modification of wood can
be considered as partial pyrolysis in a chamber with a low-oxygen concentration. The process results in
a modified chemical composition of the wood. The first prominent degradation of hemicellulose starts
at 140 ◦ C and α-cellulose at 150 ◦ C [7]. Degradation and/or modification of lignin begins at higher

Forests 2020, 11, 348; doi:10.3390/f11030348                                      www.mdpi.com/journal/forests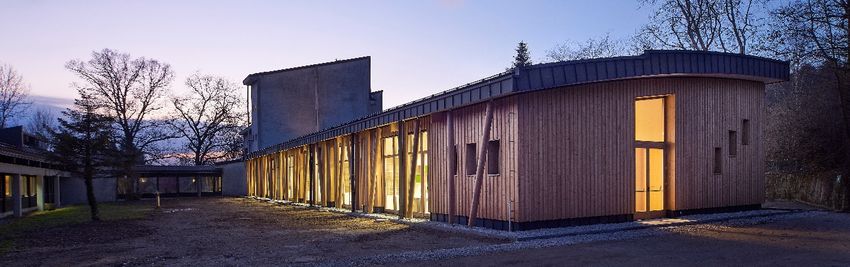
Forests 2020, 11, 348 2 of 13
temperatures. One of the most crucial consequences of thermal modification is the reduction of readily
available hydroxyl groups [8,9]. The equilibrium moisture content of the thermally modified wood is
thus much lower than in non-modified wood when determined under the same climatic conditions [10].
The effect of the modification depends on the modification temperature and modification duration.
Fungi can degrade wood if the MC is above a specific limit. There are versatile data available
in the literature. In the first set of the data, MC limits are stated to depend predominantly on the
fungal species. Namely, Schmidt [11] reported that the minimum MC of wood varied between (30%)
(Fibriporia vaillantii and Gloeophyllum trabeum) and 25% (Coniophora puteana and Serpula lacrymans).
However, novel data indicate that that MC limits for fungal growth depend on the fungal species and
wood species investigated as well. For example, limit MC for C. puteana growth on thermally modified
Scots pine sapwood is 12.1%. Limit MC for fungal decay of thermally modified wood is 24.4% for
thermally modified pine wood [12].
When wood is used in outdoor applications, it is essential to differentiate between the technical
(functional) and the aesthetic service life. The technical service life of a façade is defined by the
ability to withstand climatic impacts (wind-driven rain, other rain events, high relative humidity,
potential condensation) and accounts for the ability of the wood to dry out [13]. The technical service
life of a façade is greatly influenced by both the initial design and the material used. One of the most
significant challenges is to assess the long-term performance of the various materials in less exposed
applications, such as cladding. The decay under use class 3.1 conditions [14] is considerably slower
than in frequently used above ground tests (e.g., lap-joint, double-layer tests) and in-ground tests [15].
Laboratory tests are a faster alternative to field testing, but which are often too severe and not all
parameters influencing the degradation can be treated adequately. It is therefore of great importance
to develop a methodology for the fastest assessment of the performance of wood and wood-based
materials in less exposed applications. Published studies have indicated that moisture performance field
tests may serve as a time-saving alternative to long-term decay tests in the field [4,16,17]. This approach
is supported by a model approach that defines material resistance based on the combined effect of
wetting ability and durability [18]. The idea of this study was to assess the performance of a façade made
of thermally modified Norway spruce wood with three-year moisture monitoring. Although modified
wood has been on the market for two decades, comprehensive moisture monitoring studies of the
modified wood in use are rare. To the best of our knowledge, this is the first study in which the moisture
content of wood has been monitored for several years at multiple locations within a representative
façade.
2. Material and Methods
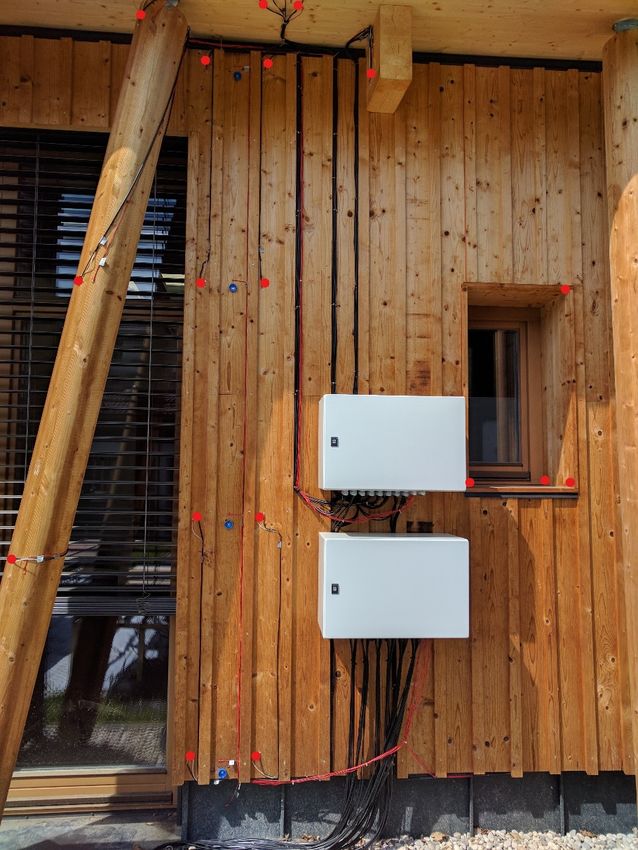
Figure 1 shows the wooden Annex to the existing building of the Department of Wood Science and
Technology in Ljubljana, Slovenia (46◦ 020 55.7”N 14◦ 280 47.3”E, elevation above mean sea level 293 m)
finished in December 2015. In Ljubljana, the average temperature is 10.4 ◦ C, annual precipitation
1290 mm and Scheffer Climate Index 55.3. The Annex has a rectangular shape with dimensions
40 m × 13.5 m. As the most important educational and research institution in the field of wood
in Slovenia, this also serves learning and demonstration purposes. The construction is made of
cross-laminated timber (CLT) boards, while the façade is made of thermally modified spruce wood
(Thermowood, Thermo D). The sloping non-structural outer columns are also made of thermally
modified spruce, giving the sense of a forest through the extensive glazing on the longitudinal southern
and northern façades.Forests 2020, 11, 348 3 of 13
Forests 2020, 11, x FOR PEER REVIEW 3 of 14
Figure1.1. Annex
Figure Annex to
to the
the existing building of
existing building of the
the Department
DepartmentofofWood
WoodScience
Scienceand
andTechnology
Technologyinin
Ljubljana
Ljubljana(photo:
(photo:Damjan
DamjanŠvarc).
Švarc).
ToTodetermine
determinethe therelationship
relationship between
between relative humidity (RH)
relative humidity (RH) andandmoisture
moisturecontent
content(MC) (MC)ofof
thermally modified wood, dynamic water vapour sorption (DVS)
thermally modified wood, dynamic water vapour sorption (DVS) was measured. Samples for DVS was measured. Samples for DVS
analysis were isolated from the façade, to have a representative sample.
analysis were isolated from the façade, to have a representative sample. Wood was milled on an IKA Wood was milled on an IKA
mill
mill(A(A1111basic
basicAnalytical
Analyticalmill, mill, Staufen,
Staufen, Germany).
Germany). Before Before the
theexperiment,
experiment,the thewood
woodchips chipswerewere
◦ C. Sorption analysis of the thermally wood samples
conditioned
conditionedfor for48 48hhatat11±±1%1% RH RH and 20 ±
and 20 ± 0.2 °C. Sorption analysis of the thermally wood samples
was
wasperformed
performedusing usingaaDynamic
Dynamic Vapour Sorption (DVS (DVS Intrinsic,
Intrinsic,Surface
SurfaceMeasurement
MeasurementSystems Systems Ltd.,
Ltd.,
London,
London,UK). UK).Pre-conditioned
Pre-conditioned wood wood chips (approximately
(approximately40 40mg)
mg)werewereplaced
placedononthe thesample
sample holder.
holder.
Theholder
The holderwas was suspended
suspended in inaamicrobalance
microbalancewithinwithin a sealed thermostatically
a sealed thermostatically controlled
controlled chamber.
chamber.In
Inthe
thechamber,
chamber,a aconstant
constantflow flowofofdry drycompressed
compressedair airwas
waspassed
passedover overthethesample
sample(200 (200cm cm/s)/s)atat
3 3
constanttemperature
constant temperature (25 ±±0.2 ◦ C).The
0.2°C). Themethod
method forfor
DVS DVSwaswas
set set
to 20tosteps between
20 steps 0% and
between 0%95%
andRH 95%
RHforfor
sorption
sorptionandand desorption.
desorption. DVSDVS maintained
maintaineda target RH until
a target the weight
RH until change
the weight of theof
change sample was
the sample
lessless
was thanthan0.002%/min
0.002%/min forfor10 10min.min.Relevant
Relevantparameters
parameters were
wererecorded
recorded every
every 6060s sthroughout
throughoutthe the
isothermrun.
isotherm run.Sorption
Sorption and and desorption
desorption isotherms
isotherms were were produced
producedby byplotting
plottingequilibrium
equilibriummoisture
moisture
content(EMC)
content (EMC)change
changeagainst
againstrelative
relative humidity
humidity (RH).
(RH).
The relation between wood MC and climate was
The relation between wood MC and climate was also
also determined
determinedunder underreal realconditions.
conditions.
Monitoring of the material-climate conditions began on the 13th of July 2016. Two typesofofcontinuous
Monitoring of the material-climate conditions began on the 13th of July 2016. Two types continuous
monitoringwere
monitoring were performed
performed on onthe the building.
building. (1) Scanntronik’s
(1) Scanntronik’s (Mugrauer
(Mugrauer GmbH) GmbH) temperature
temperature sensors
sensors were positioned close to the wood moisture measurement
were positioned close to the wood moisture measurement sensors to obtain exact values sensors to obtain exact valuesforforthe
conversion of electrical conductivity into wood moisture content (MC) [19]. Temperature (T)was
the conversion of electrical conductivity into wood moisture content (MC) [19]. Temperature (T) was
monitored on the surface, not to interfere with MC measurements. (2) MC was determined through
monitored on the surface, not to interfere with MC measurements. (2) MC was determined through
measurements of electrical resistance (Table 1). Insulated electrodes (stainless steel screws) were
measurements of electrical resistance (Table 1). Insulated electrodes (stainless steel screws) were
applied 5 mm below the surface of the wooden planks at various positions and linked to electrical
applied 5 mm below the surface of the wooden planks at various positions and linked to electrical
resistance measuring devices Gigamodule (Scanntronik Mugrauer GmbH, Germany) (Figure 2) [17].
resistance measuring devices Gigamodule (Scanntronik Mugrauer GmbH, Germany) (Figure 2) [17].
All measurements were performed on the south-facing façade, as this façade is more exposed to
All measurements were performed on the south-facing façade, as this façade is more exposed to
weathering. The majority of the wind-driven rain is coming from the south-east. This part of the
weathering. The majority of the wind-driven rain is coming from the south-east. This part of the
building is more exposed, thus it was chosen for monitoring. The equipment used enables wood MC
building is more exposed, thus it was chosen for monitoring. The equipment used enables wood
measurements in the range between 6% and 60%. MC was logged twice per day, at noon and
MC measurements in the range between 6% and 60%. MC was logged twice per day, at noon and
midnight. To transfer electrical resistance measured inside the wood, wood species-specific resistance
midnight. To transfer
characteristics electrical resistance
were developed. measuredofinside
For determination the wood, wood
the characteristics species-specific
for electrical resistance
resistance-based
characteristics were developed. For determination of the characteristics
MC measurements, five replicates of wood samples made of Norway spruce and Thermally modified for electrical resistance-based
MC measurements,
Scots pine (150 × 50five × 25replicates
mm3) were of wood samples
prepared. made
In each of Norway
respective spruce
sample, twoand Thermally modified
stainless-steel screws
Scots pine (150 × 50 × 25 mm 3 ) were prepared. In each respective sample, two stainless-steel screws
were positioned the same way as described for MC monitoring. In the beginning, wood samples were
were positioned
oven-dried (24 the
h; 103same
± 2 way
°C) andas described
afterwards,for their
MC monitoring. In the beginning,
mass was determined. Samples wood
weresamples
placed in werea
oven-dried (24 h; 103 ± 2 C)◦ and afterwards, their parameters
mass was determined.
climatic chamber (Kambič, Slovenia) with variable (temperatureSamplesand relativewerehumidity
placed in
a (RH))
climatic to chamber
condition(Kambič,
samples to Slovenia)
constantwith variable
weight parameters
for three (temperature
weeks. After and relative
conditioning, humidity
their mass and
(RH)) to condition samples to constant weight for three weeks. After
electrical resistance were measured. Measurements were performed the same way as MC monitoring conditioning, their mass and
electrical resistance
of the façade. The were
authorsmeasured.
are aware Measurements
that there is were performed
a limited moisture the gradient
same way as MCwithin
formed monitoring
the
ofsamples,
the façade.but Thelong authors are aware
conditioning timesthat there
limit the isgradients
a limitedtomoisture gradientfor
a level suitable formed within of
preparation theForests 2020, 11, 348 4 of 13
samples, but long conditioning times limit the gradients to a level suitable for preparation of calibration
curves. Samples were weighed eight times (at 25%, 40%, 60%, 80%, 90%, 100%, after impregnation with
distilled water and after drying at 100% RH) and at four temperatures (30 ◦ C, 25 ◦ C, 20 ◦ C, and 15 ◦ C)
except for the final drying at 100% RH. Calibration curves were prepared based on the published
methodology [19–21]. Use classes of wood were determined. Use Class is a term taken from EN
335 [14]. This European Standard defines five use classes that represent different service situations to
which wood and wood-based products can be exposed:
- Use Class 1—Situations in which the wood or wood-based product is inside a construction,
not exposed to the weather and wetting.
- Use Class 2—Situations in which the wood or wood-based product is undercover and not
exposed to the weather (mainly rain and driven rain) but were occasional, but not persistent,
wetting can occur.
- Use Class 3 Situations in which the wood or wood-based product is above ground and exposed
to the weather (mainly rain). UC 3.1 is less exposed than 3.2.
- Use Class 4—A situation in which the wood or wood-based product is in direct contact with the
ground and/or freshwater.
- Use Class 5—A situation in which the wood or wood-based product is permanently or regularly
submerged in saltwater [14].
Table 1. Descriptions of the moisture content monitoring locations on the façade of the Annex of the
Wood Science and Technology building in Ljubljana. Use classes are defined according to EN 335 [14].
Abbr. Material Description Use Class No. of Meas.
PaTM 1a Spruce TM Plank 3.25 m above ground UC2 2373
PaTM 1b Spruce TM Plank 3.25 m above ground UC2 2146
PaTM 2a Spruce TM Plank 2.2 m above ground UC2 2146
PaTM 2b Spruce TM Plank 2.2 m above ground UC2 2146
PaTM 3a Spruce TM Plank 1.15 m above ground UC2 2146
PaTM 3b Spruce TM Plank 1.15 m above ground UC2 2146
PaTM 4a Spruce TM Plank 0.4 m above ground UC2 2146
PaTM 4b Spruce TM Plank 0.4 m above ground UC2 2146
PaTM 5 Spruce TM Pillar 3.25 m above ground front side UC3.1 2232
PaTM 6 Spruce TM Pillar 3.25 m above ground back side UC3.1 2232
PaTM 7 Spruce TM Pillar 2.2 m above ground front side UC3.1 2232
PaTM 8 Spruce TM Pillar 2.2 m above ground back side UC3.1 2232
PaTM 9 Spruce TM Pillar 1.15 m above ground front side UC3.1 2232
PaTM 10 Spruce TM Pillar 1.15 m above ground back side UC3.1 2232
PaTM 11 Spruce TM Pillar 0.2 m above ground front side UC3.1 2232
PaTM 12 Spruce TM Pillar 0.2 m above ground back side UC3.1 2232
PaTM 13a Spruce TM Window sill top UC2 2186
PaTM 13b Spruce TM Window sill side UC2 2186
PaTM 13c Spruce TM Window sill side UC2 2186
PaTM 13d Spruce TM Window sill UC3.1 2186
PaTM 13e Spruce TM Window sill UC3.1 2186
PaTM 13f Spruce TM Window sill UC2 2186
Pa 1a Spruce Roof beam, surface UC2 2086
Pa 1b Spruce Roof beam, surface UC2 2086
Pa 2a Spruce Roof beam, 2 cm deep UC2 2086
Pa 2b Spruce Roof beam, 5 cm deep UC2 2086
Pa 3 Spruce Celling surface UC2 2086
Pa 4a Spruce Celling 2 cm deep UC2 2086
Pa 4b Spruce Celling 2 cm deep UC2 2186
Pa 5 Spruce Celling 4 cm deep UC2 2086
Pa 6a Spruce Celling 5 cm deep UC2 2086
Pa 6b Spruce Celling 5 cm deep UC2 2185wetting can occur.
- Use Class 3 Situations in which the wood or wood-based product is above ground and
exposed to the weather (mainly rain). UC 3.1 is less exposed than 3.2.
- Use Class 4—A situation in which the wood or wood-based product is in direct contact with
the ground and/or freshwater.
Forests 2020, 11, 348 5 of 13
- Use Class 5—A situation in which the wood or wood-based product is permanently or
regularly submerged in saltwater [14].
Figure 2. Position of wood moisture and temperature sensors on the façade of the Annex. The red dots
Figure 2. Position of wood moisture and temperature sensors on the façade of the Annex. The red
indicate locations of the measurements.
dots indicate locations of the measurements.
Climatic conditions were determined at a nearby (distance 20 m) weather station (Vantage Pro,
Climatic conditions were determined at a nearby (distance 20 m) weather station (Vantage Pro,
Davis Instruments, USA). Temperature (T) and relative humidity (RH) were logged every 15 minutes in
Davis Instruments, USA). Temperature (T) and relative humidity (RH) were logged every 15 minutes
the monitoring period between 13th of July 2016 and 15th of July 2019. Based on these data, average T
and RH were calculated for periods between MC measurements (12 h period). Wood moisture
content is predominately influenced by RH; a correlation between RH and wood MC was, therefore,
determined, namely: average RH (average RH 12 h before MC measurements), two days’ average
RH (average RH 48 h before MC measurements) and three days’ average RH (average RH 72 h before
MC measurements). These periods were selected based on a preliminary analysis. In addition to RH,
wood MC is also influenced by temperature. An additional indicator that corresponds to the theoretical
MC of untreated wood was therefore calculated (f(RH; T)) (Eq. 1) [22]. The average RH 48 h and
average temperature 48 h before MC was calculated for this indicator. It provides an overestimated
MC of thermally modified wood; we therefore consider it as an indicator and not as actual wood
moisture content.
2.43 !0.0577T0.430
T
f (RH; T ) = −0.000612T 1 − ln(1 − RH ) (1)
647.1
T—temperature in ◦ K; RH—relative humidityForests
Forests 2020,
2020, 11, x348
FOR PEER REVIEW 6 6of
of 14
13
Pearson correlation coefficients (r) were calculated to determine the level of the strength of the
linearPearson correlation
relationship betweencoefficients
wood MC(r) were
and calculated
calculated to determine
indicators the RH,
(Average level48
ofhthe strength
average RH,of72the
h
linear relationship between wood MC and calculated indicators (Average RH, 48 h average
average RH and f(RH;T)) using GraphPad Prism, version 8.3.1. (GraphPad Software, San Diego, RH, CA,
72 h
average
US). The RH and f(RH;T)) using
multiple-variable GraphPad
analysis procedurePrism,
was version
used to 8.3.1. (GraphPad
calculate Software,
the correlation San Diego,
coefficients to
CA, US). The multiple-variable analysis procedure was used to calculate the correlation coefficients
measure the strength of the linear relationship between all the variables. The significance of the
to measure the
correlations wasstrength of the
calculated linear relationship between all the variables. The significance of the
as well.
correlations was calculated as well.
3. Results and Discussion
3. Results and Discussion
Temperature, together with moisture content, is one of the critical factors affecting wood’s
Temperature, together with moisture content, is one of the critical factors affecting wood’s service
service life. Too high or too low temperatures can affect fungal vitality and thus degradation of wood.
life. Too high or too low temperatures can affect fungal vitality and thus degradation of wood.
The minimum temperature for fungal growth and degradation is usually around 3 °C. Below freezing
The minimum temperature for fungal growth and degradation is usually around 3 ◦ C. Below freezing
point, there is no liquid water available for fungal metabolism. The optimal temperatures for
point, there is no liquid water available for fungal metabolism. The optimal temperatures for
development of decay fungi are between 20 and 30 °C. The maximal temperature for mycelial growth
development of decay fungi are between 20 and 30 ◦ C. The maximal temperature for mycelial growth
and wood degradation is generally between 40 and 50 °C. At higher temperatures, proteins
and wood degradation is generally between 40 and 50 ◦ C. At higher temperatures, proteins (enzymes)
(enzymes) start denaturing [11]. However, when interpreting the temperature data, it should be
start denaturing [11]. However, when interpreting the temperature data, it should be noted that
noted that temperatures at micro-locations can differ significantly, for instance, indicated by
temperatures at micro-locations can differ significantly, for instance, indicated by Gobakken et al. [23],
Gobakken et al. [23], who monitored wooden hunting huts in Svalbard, Norway.
who monitored wooden hunting huts in Svalbard, Norway.
As can be seen from Figure 3, air temperature varied between −14.8 °C (Januar 2017) and 36.6 °C
As can be seen from Figure 3, air temperature varied between −14.8 ◦ C (Januar 2017) and
(August 2017). Average temperatures (11.2 °C) were comparable in the three years. In the monitoring
36.6 ◦ C (August 2017). Average temperatures (11.2 ◦ C) were comparable in the three years. In the
period, the air temperature was suitable for decay for 77.0% of the time. In general, the air
monitoring period, the air temperature was suitable for decay for 77.0% of the time. In general, the air
temperature was below 3 °C for 21.8% of the time and above 30 °C for 1.3% of the time. However, air
temperature was below 3 ◦ C for 21.8% of the time and above 30 ◦ C for 1.3% of the time. However, air
temperature cannot be directly transferred to the material temperature. As can be seen from Figure
temperature cannot be directly transferred to the material temperature. As can be seen from Figure 4,
4, temperatures on the façade were considerably higher than air temperatures. This phenomenon has
temperatures on the façade were considerably higher than air temperatures. This phenomenon has
already been reported [23]. The highest measured temperature on the façade was◦ 58.6 °C, on the
already been reported [23]. The highest measured temperature on the façade was 58.6 C, on the lowest
lowest part of the façade. This part is most exposed to solar radiation. However, it should be noted
part of the façade. This part is most exposed to solar radiation. However, it should be noted that this
that this was the surface temperature only; the actual material temperatures in the central part of the
was the surface temperature only; the actual material temperatures in the central part of the planks
planks might be slightly different.
might be slightly different.
T RH
100
80
60
40
20
0
13-Jul-2017 13-Jul-2018 13-Jul-2019
Date
-20
Figure 3. Temperature (T) and relative humidity (RH) in the nearby weather station between 13th of
Figure 3. Temperature (T) and relative humidity (RH) in the nearby weather station between 13th of
July 2016 and 15th of July 2019. Each curve represents 105,000 measurements.
July 2016 and 15th of July 2019. Each curve represents 105,000 measurements.Forests 2020, 11, x FOR PEER REVIEW 7 of 14
Forests 2020, 11, 348 7 of 13
80
3.25 m 0.4 m
60
Temperature (°C)
40
20
0
14-Apr-2018 14-Apr-2019
-20 Date
Figure 4. Influence of distance from the ground on the temperature dynamics on the façade in the
period between
Figure 13th ofof
4. Influence July 2016 and
distance 15th
from theofground
July 2019.
on Each curve represents
the temperature 22,300onmeasurements.
dynamics the façade in the
period between 13th of July 2016 and 15th of July 2019. Each curve represents 22,300 measurements.
The temperatures at actual micro-locations varied. Differences on the object originate
predominately from exposure
The temperatures to solarmicro-locations
at actual radiation. Thevaried. percentage of days in
Differences on the
theperiod
objectbetween
originate
13th of July 2016 and 15th of July 2019 (1098 days) with a façade temperature below 3 ◦ C was 15.1%,
predominately from exposure to solar radiation. The percentage of days in the period between 13th
which
of Julyis 2016
a much andlower
15th ofpercentage
July 2019 (1098 than days)
presumedwith afrom
façadethetemperature
air temperaturebelow(21.8%).
3 °C wasThe 15.1%,higher
which
temperature of the façade results from solar radiation and temperature
is a much lower percentage than presumed from the air temperature (21.8%). The higher temperature losses through the walls
(inof
winter).
the façadeFrom Figure
results 4, the
from influence
solar radiationof the
anddistance of thelosses
temperature measurement
throughlocation
the wallsfrom the ground
(in winter). From
canFigure
be seen. Measurements were performed on the same vertical
4, the influence of the distance of the measurement location from the ground can plank, under the roof andbeclose
seen.
to Measurements
the ground. The upper
were part wason
performed shaded
the sameat noon, while
vertical the under
plank, lower the partroof
of the
andplank
closewas exposed
to the ground.
to The
sunlight
upper for an was
part extended
shaded period
at noon,of time
whileduring
the lowerthe day.
part ofThere is not,was
the plank therefore,
exposed much difference
to sunlight for an
between the temperature dynamic during the coldest periods. On
extended period of time during the day. There is not, therefore, much difference between the other hand, differences betweenthe
airtemperature
temperature dynamicand the temperature
during theofcoldest the façade became
periods. Onprominent
the otherduringhand, the summer. between air
differences
Relative air humidity is another important factor that influences
temperature and the temperature of the façade became prominent during the summer. the performance of wood. If the
RH is high,
Relativewood air absorbs
humiditywater vapour
is another from thefactor
important air. The
that importance
influences the of performance
air humidityof increases
wood. Ififthe
airRH
temperature falls below or close to the dew point. On wood located
is high, wood absorbs water vapour from the air. The importance of air humidity increases in conditions with high RH,if air
thetemperature
first staining fungi will occur at an RH above 80%, while higher RH, above
falls below or close to the dew point. On wood located in conditions with high RH, 90%, is required forthe
degradation
first staining [24]. However,
fungi will occurfor severe
at an degradation,
RH above 80%, waterwhiletraps and/or
higher RH,a condensing
above 90%, environment
is required for
aredegradation
necessary. RH in front of the Annex varied between 16.0% (April 2018)
[24]. However, for severe degradation, water traps and/or a condensing environment and 99.0% (Figure 3).
There were fairly marked differences determined daily.
are necessary. RH in front of the Annex varied between 16.0% (April 2018) and 99.0% (Figure 3).
The were
There relation
fairlybetween
markedwood MC and
differences RH can bedaily.
determined seen from Figure 5. Wood MC increases with
increasing RH. If the MC of Norway spruce
The relation between wood MC and RH can be seen is compared to the
fromMCFigure
of thermally
5. Woodmodified Norway
MC increases with
spruce, it can RH.
increasing clearly be MC
If the seenof that the MCspruce
Norway of thermally modified
is compared wood
to the MC atofathermally
given RHmodified
is considerably
Norway
lower.
spruce,Foritexample,
can clearlythebeMC of Norway
seen that the spruce at 95% RHmodified
MC of thermally was 23.79%. wood Onatthe other RH
a given hand, the MC of
is considerably
thermally modified wood at the given RH was only 11.86% (Figure
lower. For example, the MC of Norway spruce at 95% RH was 23.79%. On the other hand, 5). This can be ascribed to a reduced
the MC of
number
thermally of hydroxyl
modified groups
woodwith at thethermally
given RH modified
was only wood [8,9].(Figure
11.86% However,5). it should
This can bebe considered
ascribed to a
that DVS analysis
reduced number could result in groups
of hydroxyl errors inwiththe prediction
thermally of EMC [25,26].
modified woodHowever, the differences
[8,9]. However, it should in be
EMC between TM wood and untreated wood are higher than respective
considered that DVS analysis could result in errors in the prediction of EMC [25,26]. However, theerror.
differences in EMC between TM wood and untreated wood are higher than respective error.Forests
Forests 2020,
2020, 11,11,
348x FOR PEER REVIEW 88ofof1314
25
PiAb-Des PiAb-Sor
TM-Des TM-Sor
20
15
10
5
0
0 20 40 60 80 100
Relative humidity (%)
Figure 5. Relationship between relative humidity and wood moisture content, as determined with
Figure 5. Relationship between relative humidity and wood moisture content, as determined with
DVS for Norway spruce (PiAb) and thermally modified Norway spruce (TM) in sorption (Sor) and
DVS for Norway spruce (PiAb) and thermally modified Norway spruce (TM) in sorption (Sor) and
desorption (Des) cycles.
desorption (Des) cycles.
Aggregated wood MC data are presented in Table 2 and Figure 6. As expected, the wood MC
reflected the micro-climate in the environment. Moreover, the MC of thermally modified wood was
significantly lower than the MC of non-modified Norway spruce (Table 2). The average MC of spruce
was 13.8%, while MC of thermally modified wood was considerably lower (8.2%), even though the
thermally modified wood was more exposed to wind-driven rain than the spruce. This is a consequence
of the reduction of readily available hydroxyl groups during thermal modification [8] and it is in line
with DVS observations (Figure 5). The MC of Norway spruce wood at 60% RH in desorption was
12.83%, while that of thermally modified wood was 7.61%. The ratio between the MC of TM wood and
Norway spruce wood at 60% RH (1.685) is comparable to the ratio between the average MC on the
façade (1.682) between spruce and TM spruce on the respective façade. This clearly indicates that the
sorption properties of materials and RH have a prevalent influence on the MC of wood.Forests 2020, 11, 348 9 of 13
Table 2. Wood moisture content data in the locations of the building at which monitoring was performed
between 13th of July 2016 and 15th of July 2019. Abbreviations are the same as in Table 1.
Moisture Content (%) No. of Meas. Above Threshold MC
Abbr.
Average Median Max 20% 25%
PaTM 1a 6.8 6.6 11.9 0 0
PaTM 1b 7.6 7.4 12.0 0 0
PaTM 2a 6.8 6.4 16.9 0 0
PaTM 2b 7.7 7.2 20.1 1 0
PaTM 3a 6.5 6.4 19.5 0 0
PaTM 3b 7.9 7.3 24.6 3 0
PaTM 4a 7.2 6.8 27.3 2 1
PaTM 4b 8.0 7.3 24.7 3 0
PaTM 5 8.4 8.3 14.5 0 0
PaTM 6 8.1 8.0 14.5 0 0
PaTM 7 7.0 6.6 30.8 5 1
PaTM 8 8.1 8.2 15.8 0 0
PaTM 9 8.4 8.0 29.7 13 7
PaTM 10 9.0 8.7 18.0 0 0
PaTM 11 8.5 7.2 34.9 65 35
PaTM 12 7.2 6.8 21.5 1 0
PaTM 13a 9.3 8.5 30.4 18 1
PaTM 13b 8.1 7.8 15.3 0 0
Forests 2020,
PaTM 11,13c
x FOR PEER REVIEW
7.7 7.5 18.2 0 0 10 of 14
PaTM 13d 11.6 9.3 47.5 230 67
PaTM 13e 13.1 11.6 36.0 315 117
The MC of thermally
PaTM 13f 8.2
modified was wood
7.7
fairly18.9
uniform.
average The lowest
0
was 6.8% MC0
(PaTM 1a and PaTM 2a). Those values were determined on the same plank, 3.25 m and 2.2 m above
Pa 1a 16.0 16.2 23.3 123 0
ground (Table
Pa 1b 1). These13.1
parts were protected
13.8 from wind-driven
20.7 rain 1with a roof overhang.
0 On the
Pa 2a 14.5 14.6 17.6 0
other hand, the highest average MC was determined on horizontal planks of a window sill (PaTM 0
Pa 2b 14.4 14.5 17.7 0 0
13e; 13.1%).
Pa 3
The primary14.2
reason for the 14.4
high MC is horizontally
17.6
positioned
0
planks, with a0 water trap.
The water thus stays on14.1
Pa 4a the surface of 14.4
the plank, which
17.4 results in the0 highest average and
0 median
Pa 4b 13.8 13.9 17.6 0 0
values. In addition to the window sill, a higher MC was also determined on the pillars. They were
Pa 5 12.8 13.2 16.1 0 0
positioned at the edge of12.8
Pa 6a the roof (Figure
13.21). However,17.3
it should be noted0 that all MC measurements
0
on thermally
Pa 6b modified wood
11.9 were performed
12.2 5 mm below
15.5 the wood surface.
0 Surface wood 0 MC might
have been even higher.
Moisture content (%)
PaTM 1a
PaTM 1b
PaTM 2a
PaTM 2b
PaTM 3a
PaTM 3b
Pa M 4a
PaTM b
PaTM 10
Pa TM 11
PaTM 12
Pa13f
PaTM 13c
PaTM 5
PaTM 6
P TM 7
PaaTM 8
PaTM 9
PaTM 13a
Pa TM 13b
Pa M 3d
e
Pa 3
P aa 5
Pa 1a
Pa 1b
Pa 2a
Pa b
Pa 4a
P b
Pa 6a
6b
T 4
TM13
2
4
T 1
PaTM
Pa
Woodmoisture
Figure6.6.Wood
Figure moisturecontent
contentatatdifferent
differentmonitoring
monitoringpositions
positionson
onthe
thefaçade
façadeofofthe
theAnnex
Annexofofthe
the
WoodSci.
Wood Sci.and
andTech.
Tech.building.
building.The
Thebox
boxdisplays
displaysthe
themean
meanvalues
values(25th
(25thand
and75th
75thpercentile),
percentile),while
whilethe
the
whiskersstretch
whiskers stretchtotothe
thehighest
highestand
andlowest
lowestvalue.
value.The
Theabbreviations
abbreviationsare
arethe
thesame
sameasasininTable
Table1.
1.
Theinfluence
The MC of thermally modifiedon
of micro-location wood
woodwasMCfairly uniform.
can be seen fromThe lowest
Figure average MC
7. Moisture was was
content 6.8%
(PaTM 1aon
measured andthePaTM
same2a). Those
plank values were
on different determined
heights. on the
As expected, same
the plank,
lowest MC3.25
was m and 2.2 m at
determined above
the
top location, 3.25 m above ground. MC determined at the other places seldom exceeded 20%. MC
increased above the average value depending on the direction of wind-driven rain. Due to the roof-
overhang and sheltering of the columns, the façade was not frequently exposed to rain events.Moisture co
Forests 2020, 11, 348 10 of 13
ground (Table 1). These parts were protected from wind-driven rain with a roof overhang. On the
PaTM 1a
PaTM 1b
PaTM 2a
PaTM 2b
PaTM 3a
PaTM 3b
Pa M 4a
PaTM b
P TM 10
PaaTM 11
PaTM 12
Pa13f
PaTM 13c
PaTM 5
PaTM 6
P TM 7
PaaTM 8
PaTM 9
PaTM 13a
Pa TM 13b
Pa M 3d
e
Pa 3
P aa 5
Pa 1a
Pa 1b
Pa 2a
Pa b
Pa 4a
P b
Pa 6a
6b
other hand, the highest average MC was determined on horizontal planks of a window sill (PaTM
T 4
TM13
2
4
T 1
PaTM
13e; 13.1%). The primary reason for the high MC is horizontally positioned planks, with a water trap.
Pa
The water thus stays on the surface of the plank, which results in the highest average and median
values. In addition
Figure 6. Woodto the window
moisture contentsill, a highermonitoring
at different MC was also determined
positions on the
on the façade pillars.
of the AnnexThey were
of the
positioned
Woodat the
Sci. edge
and ofbuilding.
Tech. the roof The
(Figure 1). However,
box displays it should
the mean be noted
values (25th thatpercentile),
and 75th all MC measurements
while the
on thermally
whiskers stretch to the highest and lowest value. The abbreviations are the same as in Table 1.MC might
modified wood were performed 5 mm below the wood surface. Surface wood
have been even higher.
Theinfluence
The influenceofofmicro-location
micro-locationon onwood
woodMC MCcan canbebeseen
seenfrom
fromFigure
Figure7.7.Moisture
Moisturecontent
contentwas
was
measuredon
measured onthethe same
same plank on different
different heights.
heights. As
Asexpected,
expected,the thelowest
lowestMCMC waswasdetermined
determined at the
at
toptop
the location,
location,3.253.25
m above
m aboveground.
ground.MCMC determined
determinedat the other
at the places
other seldom
places seldom exceeded 20%.20%.
exceeded MC
increased
MC above
increased the the
above average
averagevalue depending
value dependingon the
on direction of wind-driven
the direction of wind-drivenrain.rain.
Due Due
to the
toroof-
the
overhang andand
roof-overhang sheltering of the
sheltering columns,
of the columns,the the
façade waswas
façade not not
frequently exposed
frequently exposed to rain events.
to rain events.
Moisture content (%)
Figure7.7.Influence
Figure Influenceofofthe
the distance
distance from
from thethe ground
ground on on
thethe wood
wood moisture
moisture content
content offaçade
of the the façade on
on the
the monitored Annex of the Wood Science and Technology building in Ljubljana
monitored Annex of the Wood Science and Technology building in Ljubljana in the period between in the period
between
13th of July13th ofand
2016 July15th
2016ofand
July15th of July 2019.
2019.
In addition to average, median and extreme data, the percentage of wet days, i.e., days when
wood MC exceeded a particular threshold, are reported in Table 2. Different thresholds were taken
into account. In general, the 25% MC threshold is considered to be the minimum MC required for
fungal decay of untreated wood. This generally represents a conservative fibre saturation value.
However, lower values are possible if the fungi can transport water from a neighbouring moisture source
to the wood [12]. The threshold values for thermally modified wood correspond to the hygroscopic
properties and corresponding fibre saturation. Fibre saturation of thermally modified wood is lower
than reported for untreated wood, as seen in Figure 7 [4,7]; the MC threshold is thus also lower [12].
A fairy high number of measurements exceeding the limit of 20% for modified wood were determined
on the front side of the wooden pillars, which were the most exposed to rain events (PaTm 7, PaTm 9,
and PaTm 11). Even higher values were determined with horizontally oriented elements of the window
sill (PaTm 13d and PaTm 13e). Water was not able to run off from the sill; it therefore accumulated in
the wood, which resulted in increased wood MC levels. However, although these values were higher
than determined on the rest of the façade, it should be noted that thermally modified wood has much
better inherent durability; it can thus withstand a higher number of “wet-days” compared to less
durable Norway spruce or Scots pine sapwood [4,18].
One of the objectives of this study was to address the influence of climatic conditions on wood
MC. Since the majority of the façade is designed in a way that it is not exposed to rain, except for
wind-driven rain, we decided to focus on the correlation between RH and wood MC. This relationForests 2020, 11, 348 11 of 13
is fairly straightforward in the laboratory, with stable, controlled conditions. As can be seen from
Figure 3, under real conditions, relative humidity varied significantly through the day. The average
difference between the daily highest and the daily lowest RH was 26%. The highest daily difference
in RH of 69% was recorded in January 2017 and February 2018. To consider daily variations fully,
we compared the average RH in the previous 12 h, 48 h and 72 h with wood MC. Pearson’s correlations
are calculated in Table 3. MC of non-modified Norway spruce correlated best with average RH during
the previous 12 h. On the other hand, MC of thermally modified wood correlated best with the 48 h
average RH before the specific moisture measurements. This suggests that thermally modified wood
takes a longer time to react to changes in RH [9].
Table 3. Coefficient of correlation between wood MC and selected indicators: Average RH (average
RH 12 h before MC measurements), 48 h average RH (average RH 48 h before MC measurements), 72
h average RH (average RH 72 h before MC measurements), f(RH; T) (value calculated according to
Equation (1), considering average RH 48 h and average temperature 48 h before MC measurements).
All corelations are statisticaly significant (p < 0.0001).
Correlation Factors
Abbr.
Average RH 48 h Average RH 72 h Average RH f(RH;T)
PaTM 1a 0.56 0.71 0.72 0.76
PaTM 1b 0.57 0.64 0.70 0.70
PaTM 2a 0.44 0.65 0.63 0.73
PaTM 2b 0.48 0.61 0.59 0.65
PaTM 3a 0.42 0.64 0.63 0.70
PaTM 3b 0.44 0.59 0.58 0.65
PaTM 4a 0.43 0.63 0.63 0.72
PaTM 4b 0.45 0.65 0.66 0.73
PaTM 5 0.51 0.65 0.64 0.69
PaTM 6 0.59 0.71 0.71 0.76
PaTM 7 0.24 0.56 0.49 0.59
PaTM 8 0.56 0.69 0.66 0.71
PaTM 9 0.37 0.50 0.47 0.52
PaTM 10 0.50 0.68 0.64 0.72
PaTM 11 0.36 0.55 0.49 0.59
PaTM 12 0.41 0.67 0.63 0.73
PaTM 13a 0.49 0.68 0.64 0.74
PaTM 13b 0.54 0.80 0.79 0.84
PaTM 13c 0.51 0.58 0.62 0.61
PaTM 13d 0.48 0.62 0.60 0.66
PaTM 13e 0.56 0.71 0.68 0.77
PaTM 13f 0.55 0.79 0.77 0.84
Pa 1a 0.73 0.60 0.68 0.71
Pa 1b 0.73 0.63 0.72 0.30
Pa 2a 0.61 0.21 0.29 0.32
Pa 2b 0.64 0.24 0.31 0.70
Pa 3 0.71 0.61 0.70 0.46
Pa 4a 0.70 0.38 0.48 0.62
Pa 4b 0.53 0.58 0.58 0.59
Pa 5 0.75 0.53 0.59 0.23
Pa 6a 0.67 0.20 0.28 0.61
Pa 6b 0.46 0.56 0.59 0.61
The best correlation between the average RH and thermally modified wood was determined with
elements that were sheltered and not exposed to wind-driven rain, such as the upper parts of the
façade (PaTm 1a) and the sheltered part of a window sill (PaTm 13b, and 13f), where correlations of
0.71, 0.79 and 0.80 were determined, respectively (Table 3). Since the wood MC is a factor of RH and
T, the indicator calculated based on Equation (1) [27] was also considered. This indicator correlates
on average with the MC of thermally modified wood better than RH alone. The highest correlation
of 0.82 was determined at the sheltered part of the window sill (PaTm 13b) (Figure 8). This result
indicates that this indicator can be used for evaluation of MC of thermally modified wood in outdoor,
sheltered conditions (UC 2; EN 335 [14]). It should be noted that the correlation between non-modifiedForests 2020, 11, 348 12 of 13
spruce wood and the respective indicators is much more challenging to perform in the present study,
since
Foreststhe MC
2020, 11,with
x FORthe spruce
PEER wood was determined at various depths. In addition, there could13even
REVIEW of 14
be an adhesive line between the layers in CLT, which also influences vapour diffusion.
48 h average RH (%)
A B
Figure 8. Correlation between MC of thermally modified wood (window sill, PaTM 13b) and selected
Figure 8. Correlation
indicators: between MC
(A) Value calculated of thermally
according modified
to Equation (1), wood (window
considering sill, PaTM
average RH 4813b) andaverage
h and selected
indicators: (A)
temperature 48 hValue
beforecalculated according(f(RH;
MC measurements to equation
T)) (R 1,= 0.84; p < 0.0001);
considering average RH 48 h average
(B) Two-day and average
RH
temperature
(48 48 h (R
h average RH) = 0.80;
before MC p<
measurements (f(RH;line
0.0001). The trend T))is(Rred.
= 0.84; pForests 2020, 11, 348 13 of 13
5. Goli, G.; Todaro, L. Wood Modification in Europe: Processes, Products, Applications.; GESAAF—University of
Florence: Florence, Italy, 2018; p. 41.
6. Lohmann, U. Modifizierung. Holz-Lexikon 2008.
7. Esteves, B.M.; Pereira, H.M. Wood modification by heat treatment: A review. BioResources 2009, 4, 370–404.
8. Altgen, M.; Hofmann, T.; Militz, H. Wood moisture content during the thermal modification process affects
the improvement in hygroscopicity of Scots pine sapwood. Wood Sci. Technol. 2016, 50, 1181–1195. [CrossRef]
9. Lillqvist, K.; Källbom, S.; Altgen, M.; Belt, T.; Rautkari, L. Water vapour sorption properties of thermally
modified and pressurised hot-water-extracted wood powder. Holzforschung 2019, 47, 3191–3197. [CrossRef]
10. Li, T.; Cheng, D.L.; Avramidis, S.; Wålinder, M.E.P.; Zhou, D. Response of hygroscopicity to heat treatment
and its relation to durability of thermally modified wood. Constr. Build. Mater. 2017, 144, 671–676. [CrossRef]
11. Schmidt, O. Wood and Tree Fungi: Biology, Damage, Protection, and Use; Springer: Berlin/Heidelberg, Germany,
2006; ISBN 9783540321392.
12. Meyer, L.; Brischke, C.; Treu, A.; Larsson-Brelid, P. Critical moisture conditions for fungal decay of modified
wood by basidiomycetes as detected by pile tests. Holzforschung 2016, 70, 331–339. [CrossRef]
13. Rüther, P.; Time, B. External wood claddings—Performance criteria, driving rain and large-scale water
penetration methods. Wood Mater. Sci. Eng. 2015, 10, 287–299. [CrossRef]
14. European Committee for Standardization. CEN EN 335, Durability of Wood and Wood-Based Products—Use
Classes: Definitions, Application to Solid Wood and Wood-Based Products; European Committee for
Standardization: Brussels, Belgium, 2013.
15. Meyer, L.; Brischke, C.; Preston, A. Testing the durability of timber above ground: A review on methodology.
Wood Mater. Sci. Eng. 2016, 11, 283–304. [CrossRef]
16. Brischke, C.; Meyer, L.; Bornemann, T. The potential of moisture content measurements for testing the
durability of timber products. Wood Sci. Technol. 2013, 47, 869–886. [CrossRef]
17. Žlahtič-Zupanc, M.; Lesar, B.; Humar, M. Changes in moisture performance of wood after weathering.
Constr. Build. Mater. 2018, 193, 529–538. [CrossRef]
18. Meyer-Veltrup, L.; Brischke, C.; Alfredsen, G.; Humar, M.; Flæte, P.-O.; Isaksson, T.; Brelid, P.L.; Westin, M.;
Jermer, J. The combined effect of wetting ability and durability on outdoor performance of wood: Development
and verification of a new prediction approach. Wood Sci. Technol. 2017, 51, 615–637. [CrossRef]
19. Otten, K.A.; Brischke, C.; Meyer, C. Material moisture content of wood and cement mortars—Electrical
resistance-based measurements in the high ohmic range. Constr. Build. Mater. 2017, 153, 640–646. [CrossRef]
20. Brischke, C.; Lampen, S.C. Resistance based moisture content measurements on native, modified and
preservative treated wood. Eur. J. Wood Wood Prod. 2014, 72, 289–292. [CrossRef]
21. Brischke, C.; Sachse, K.A.; Welzbacher, C.R. Modeling the influence of thermal modification on the electrical
conductivity of wood. Holzforschung 2014, 72, 289–292. [CrossRef]
22. Glass, S.V.; Zelinka, S.L.; Johnson, J.A. Investigation of Historic Equilibrium Moisture Content Data from the
Forest Products Laboratory. For. Prod. Lab. 2014, 1–37. [CrossRef]
23. Gobakken, L.R.; Mattsson, J.; Alfredsen, G. In-service performance of wood depends upon the critical in-situ
conditions. Case studies. Proc. IRG Annu. Meet. 2008, 13.
24. Gradeci, K.; Labonnote, N.; Time, B.; Köhler, J. Mould growth criteria and design avoidance approaches in
wood-based materials—A systematic review. Constr. Build. Mater. 2017, 150, 77–88. [CrossRef]
25. Zelinka, S.L.; Glass, S.V.; Thybring, E.E. Myth versus reality: Do parabolic sorption isotherm models reflect
actual wood-water thermodynamics? Sci. Technol. 2018, 52, 1701–1706. [CrossRef]
26. Glass, S.V.; Boardman, C.R.; Thybring, E.E.; Zelinka, S.L. Quantifying and reducing errors in equilibrium moisture
content measurements with dynamic vapor sorption (DVS) experiments. Wood Sci. Technol. 2018, 52, 909–927.
[CrossRef]
27. Simpson, W. Predicting equilibrium moisture content of wood by mathematical models. Wood Fiber 1973, 5, 41–49.
© 2020 by the authors. Licensee MDPI, Basel, Switzerland. This article is an open access
article distributed under the terms and conditions of the Creative Commons Attribution
(CC BY) license (http://creativecommons.org/licenses/by/4.0/).You can also read