Ndsintxn: An R Package for Extracting Information from Naturalistic Driving Data to Support Driver Behavior Analyses at Intersections - arXiv
←
→
Page content transcription
If your browser does not render page correctly, please read the page content below
ndsintxn: An R Package for Extracting Information from Naturalistic Driving
                                                   Data to Support Driver Behavior Analyses at Intersections

                                          Ashirwad Barnwala,∗, Jennifer Merickelb , Matthew Rizzob , Luis Riera-Garciac , Soumik Sarkarc , Anuj
                                                                                        Sharmaa
                                                             a
                                                             Department of Civil, Construction and Environmental Engineering, Iowa State
                                                                              University, Ames, 50011, Iowa, United States
                                          b
                                            Department of Neurological Sciences, University of Nebraska Medical Center, Omaha, 68198, Nebraska, United States
                                                   c
                                                     Department of Mechanical Engineering, Iowa State University, Ames, 50010, Iowa, United States
arXiv:2108.04346v1 [stat.CO] 9 Aug 2021

                                          Abstract
                                          The use of naturalistic driving studies (NDSs) for driver behavior research has skyrocketed over the
                                          past two decades. Intersections are a key target for traffic safety, with up to 25-percent of fatalities
                                          and 50-percent injuries from traffic crashes in the United States occurring at intersections. NDSs are
                                          increasingly being used to assess driver behavior at intersections and devise strategies to improve
                                          intersection safety. A common challenge in NDS intersection research is the need for to combine
                                          spatial locations of driver-visited intersections with concurrent video clips of driver trajectories at
                                          intersections to extract analysis variables. The intersection identification and driver trajectory video
                                          clip extraction process are generally complex and repetitive. We developed a novel R package called
                                          ndsintxn to streamline this process and automate best practices to minimize computational time,
                                          cost, and manual labor. This paper provides details on the methods and illustrative examples used
                                          in the ndsintxn R package.
                                          Keywords: R package, naturalistic driving study, driver behavior, stop-controlled intersection,
                                          signalized intersection

                                          1. Introduction

                                              In today’s data-driven world, naturalistic driving studies (NDSs) have become the gold standard
                                          for studying driver behavior under real-world traffic scenarios (Singh and Kathuria, 2021). The
                                          NDS research method was first pioneered by the Virginia Tech Transportation Institute (VTTI) in
                                          the early 2000s as a way to overcome the limitations of retrospective and prospective studies (e.g.,
                                          simulator and test track) that are traditionally used to gain insights into driver behavior (Neale et al.,
                                          2005). NDSs make use of unobtrusive instrumentation (e.g., cameras, sensors) that are typically
                                          attached to the primary vehicle of study participants to collect data on driving parameters, such as
                                          speed, acceleration, and global positioning system (GPS) location, from on to off ignition (Dingus
                                          et al., 2014, 2006). This aspect of NDSs coupled with the reduced observer effects and lack of special
                                          driving instructions enable researchers to study driver behavior with high precision and validity
                                          (Neale et al., 2005; Foss and Goodwin, 2014). Additionally, rapid advancements in cloud storage
                                          and cloud computing technologies have made it considerably easier and cheaper to store and process
                                          vast amounts of data (Byrne et al., 2018; Krumm and Hoffman, 2020). This has propelled the use

                                             ∗
                                                 Corresponding author
                                                 Email address: ashirwad@iastate.edu (Ashirwad Barnwal)

                                          Preprint submitted to International Journal of Automotive Engineering (IJAE)                       August 11, 2021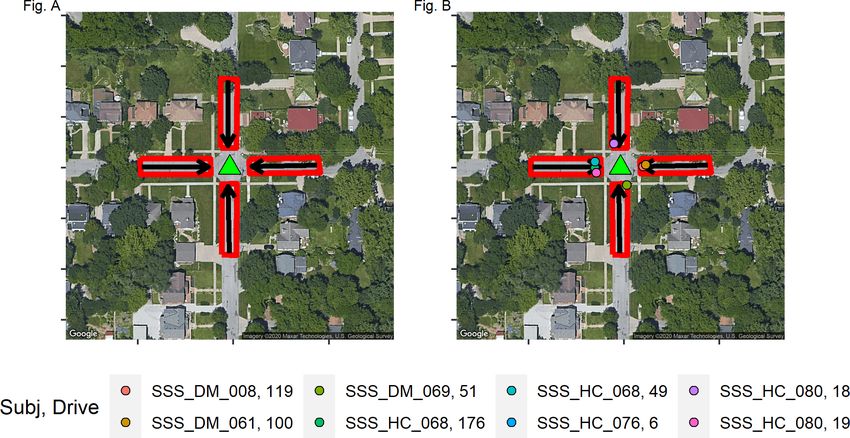
of NDSs for driver behavior research even further over the past two decades. Reflecting this, the
number of search results with the phrase “naturalistic driving study” in articles indexed in Google
Scholar has increased 600-percent from 678 during 2000–2010 to 4,930 during 2011–2020 (Google,
2021).
    One of the many applications of NDSs has been the assessment of typical driver behavior at
intersections at a higher level of real-world context than was possible earlier to look for ways to
improve safety (Wu and Xu, 2017; Xiong et al., 2015). Identifying strategies to address intersection
safety is an active area of research because nearly 25-percent fatalities and about 50-percent injuries
in traffic crashes reported each year across the United States are attributed to intersections (National
Highway Traffic Safety Administration, 2020). These statistics highlight that the use of NDSs for
intersection safety research is only going to grow in the coming future. One common thing among
all NDS-based intersection safety research is that they often require specific geographic information
on intersection locations as well as video clips of driver trajectories passing through intersections to
extract safety-related driver behavior (e.g., driver stopping or turning decision, presence/absence of a
lead vehicle or a crossing vehicle, etc.). Intersection identification and trajectory video extraction are
complex processes that require merging and processing of data from multiple sources, including video,
geographic information system (GIS), street map, and vehicle sensor data. Typically, this process is
done with labor-intensive, repetitive, human annotation, constraining data analysis scope due to time,
effort, and funding limitations. To address these limitations and improve the data analytic ability
of NDSs to comprehensively address driver behavior across geographically diverse intersections, we
created a novel R software package called ndsintxn (https://github.com/ashirwad/ndsintxn) that
focuses on partially automated extraction of traffic-controlled intersections (e.g., stop signs, traffic
signals) to partially automate and streamline this process. The image shown in Figure 1 provides a
high-level overview of the ndsintxn package.

                         Figure 1: High-level overview of the ndsintxn R package

    To use this package, users need to simply install the package and the additional software tools
that include R, RStudio, Google Earth, and FFmpeg. These software tools are open source and are
available to download for free. Once all the tools are successfully installed, the package includes
functions to extract driver video trajectories at geolocated intersections from inputted data (sensor,
video, computer vision detections, and linear referencing systems [LRS]).

                                                    2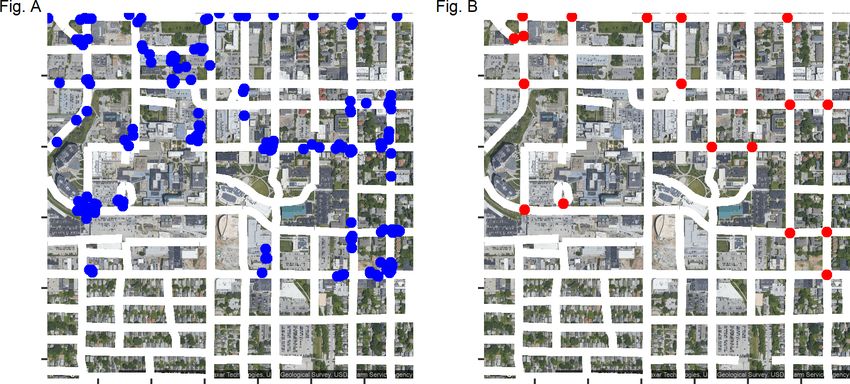
2. Software Description

   The following sections provide a brief description of different components of the ndsintxn R
package, and the inner workings and overall goal of major functions included in the package.

2.1. Software architecture
   The ndsintxn R package leverages the following services and software tools to generate files that
support driver behavior analyses at intersections in NDSs:

  1. Cloud storage: NDSs often generate huge amounts of data. The first large-scale NDS called
     the 100-Car Naturalistic Driving Study generated 6.4 terabytes of data (Dingus et al., 2006).
     The recently completed Second Strategic Highway Research Program Naturalistic Driving Study
     collected 2 petabytes of data (Dingus et al., 2014). Given the large size of the data, it is often
     stored on cloud-based storage services such as Box, Google Drive, or Amazon Simple Storage
     Service. Storing data on cloud has many advantages such as scalability, sharing, concurrent
     data access, data versioning (for optimum reproducibility), etc. Consequently, functions in the
     ndsintxn package are designed to allow fetching data and pushing results from/to cloud storage
     services using the respective application programming interfaces.
  2. R and RStudio: R is a widely used statistical computing software language that facilitates
     data analysis and visualization. RStudio is an integrated development environment that
     provides additional features to enhance user experience when working with R as well as provides
     support for other languages such as Python and C++. The ndsintxn package uses R as the
     primary computation tool and users are encouraged to use RStudio for an enhanced experience.
  3. Google Earth: Google Earth is a free software program from Google that allows users to view
     aerial imagery and street view (if available) for almost any location on Earth. Additionally, the
     software includes tools for adding placemarks, polygons, paths, etc. for geocoding features of
     interest. A function in the ndsintxn package exports the list of algorithm-identified intersec-
     tions to a keyhole markup language (KML) file for manually verifying the correctness of the
     intersection locations and marking intersection approach legs and entering traffic directions for
     true intersections. This information is later used for extracting driver trajectories of interest.
  4. Python and FFmpeg: Python is a general-purpose programing language that is extensively
     used to support data analysis pipelines, and FFmpeg is an open-source tool for processing
     video and audio files. The use of command-line interface provided by FFmpeg gets trickier for
     complex operations, and consequently the ndsintxn package uses FFmpeg via ffmpeg-python
     (Kroening, 2021), a Python package that provides bindings for FFmpeg, to extract driver video
     clips for the trajectories of interest.
  5. Excel workbook: A function in the ndsintxn package creates a data entry excel workbook
     for recording information on pertinent variables to be extracted manually by reviewing driver
     video clips. To minimize data entry errors, data validation is applied on the cells of the fields
     to be extracted.

   The image shown in Figure 2 provides an overview of how different components that support the
ndsintxn package interact with one another.

2.2. Software functionalities
2.2.1. Data inputs
    In order to use the ndsintxn package, users need the following data inputs: (a) driving GPS
coordinates (latitude, longitude), vehicle heading, and vehicle speed collected via sensor systems

                                                  3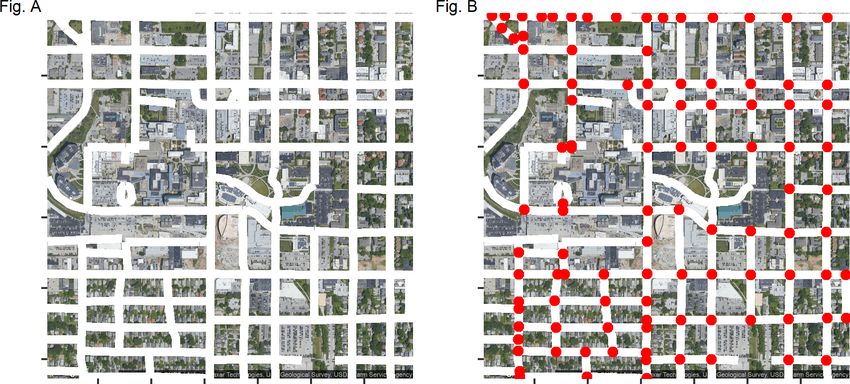
Figure 2: Overview of the interactions among software tools and services that support the ndsintxn package

installed on primary vehicles of study participants (hereafter referred to as “sensor” data), (b)
timestamps marking when in each driver’s data traffic control devices were detected typically
obtained from computer vision outputs (hereafter referred to as “computer vision” data). This
information is obtained by applying computer vision models capable of detecting and localizing traffic
element classes to driving video feeds, and (c) LRS file(s) for state(s) where the user wants to locate
intersections. This file is generally available on each state’s open geographic information system data
portal.

2.2.2. Package functions
    There are six functions included in the current version of the ndsintxn package:
(a) nds_geocomp_xytables(): This function processes sensor and computer vision data to
create merged data files for geoprocessing operations; (b) nds_lrs_intxns(): This function extracts
the geographic locations of intersection candidates from an LRS file; (c) nds_subj_intxns(): This
function extracts the geographic locations of intersection candidates visited by study participants;
(d) nds_traj(): This function extracts study participants’ driving trajectories passing through
intersections; (e) nds_traj_videos(): This function extracts video clips associated with study
participants’ driving trajectories that need to be manually reviewed to extract pertinent analysis
variables; and (f) nds_review_template(): This function creates a data entry workbook that a
human reviewer will use to record the results of manual video review. All function names are prefixed
with the word “nds” to avoid namespace ambiguity with functions from other R packages. The image
shown in Figure 3 provides an overview of the input and output files for the functions included in
the ndsintxn package.

2.2.3. Implementation details
    The following paragraphs provide details on the implementation of each of the six functions
included in the current version of the ndsintxn package.
   1. nds_geocomp_xytables(): This function processes sensor data and computer vision data for
      multiple participants to generate two clean files (hereafter referred to as “clean sensor” and

                                                    4
Figure 3: Overview of the input and output files for each function in the ndsintxn package
“clean computer vision” files) for the entire study period. The clean files only contain pertinent
variables needed for geoprocessing operations. This step reduces the input file size for functions
that perform geoprocessing operations and thus allow for better memory management and
reduced computation time.
2. nds_lrs_intxns(): To identify the geographic locations of potential intersection candidates
using an LRS file, this function first extracts vertices from the input LRS line features to a
point feature class. Next, geometries of the vertices are compared to identify vertices that
are spatially coincident with two or more vertices. These vertices are treated as potential
intersection candidates using a rule of thumb that three or more spatially coincident points,
one point for the end vertex of each approach leg, define an intersection. Finally, the point
features corresponding to these vertices are exported to a point feature class representing the
geographic locations of potential intersection candidates.
3. nds_subj_intxns(): To identify the geographic locations of potential intersection candidates
visited by study participants, this function makes use of the clean computer vision data
generated by the nds_geocomp_xytables() function and the intersection list generated by the
nds_lrs_intxns() function. The clean computer vision data with information on stop sign or
signal state detections, depending on the desired intersection type, is first filtered to keep only
5the last object detection in a sequence of consecutive object detections for each participant-drive
combination (stop signs or signal states start getting detected even when a driver is far away
from an intersection). Next, the data with information on last object detections is converted to
a point feature class to enable geospatial operations. Next, the defined distance (DBSCAN)
clustering method with a minimum features per cluster value of two and a search distance
value of 100 feet is used to extract clusters from last object detections based on their spatial
distribution. The search distance controls two parameters: (a) cluster membership–the specified
number of minimum features per cluster must be found within the search distance for cluster
membership, and (b) inter-cluster distance–the minimum distance between two individual
clusters is set to be equal to the search distance. Next, the centers of the identified clusters
are computed and points in the nds_lrs_intxns() function-generated intersection list that are
closest to the cluster centers are filtered out. These filtered points are then exported to a point
feature class where each feature represents a potential driver-visited intersection candidate
location. Lastly, this point feature class is exported to a KML file for a manual review of
the intersection candidates in Google Earth to separate true and false detections and mark
approach legs controlled by a stop sign or a traffic signal for true intersections.
4. nds_traj(): To extract the list of potential driver trajectory candidates passing through the
verified intersections, this function makes use of the reviewed data from Google Earth and
clean sensor data. The bearings of the lines that mark the directions of entering traffic in
the reviewed Google Earth file are first computed and are then transferred to the polygons in
the Google Earth file that mark the approach legs of the intersections controlled by a traffic
control device (stop sign or a traffic signal) through a spatial join. Next, driver trajectory
points that fall within the approach leg polygons are identified and the GPS headings of the
trajectory points are compared against the bearings of the entering traffic direction to separate
entering and exiting driver trajectories. Next, values in the cumulative distance field of the
entering trajectory points are used to identify trajectory points 300 feet upstream and 200 feet
downstream of the trajectory point within the intersection approach leg polygons that is closest
to the intersection. Lastly, the start and end timings of the entering trajectory candidates are
also extracted.
5. nds_traj_videos(): To extract video clips associated with driver trajectories passing through
intersections, this function makes use of driving video feeds and driver trajectory information
generated by the nds_traj() function. The list of dashcam videos that include footage associated
with driver trajectories is first extracted by comparing the start and end timings of the videos
and trajectories. Next, the identified videos are processed using FFmpeg to create one video clip
per trajectory. Additionally, to alert human video reviewers of the approaching intersections at
which driver behavior can be captured, a red-colored bounding box is overlaid on top of the
video clips. This helps remove ambiguities in what situations to are of interest where multiple
stop signs or signals are present in a video clip. The bounding box starts showing up when the
driver is 150 feet upstream of the intersection and stops showing when the driver is 50 feet
downstream.
6. nds_review_template(): This function uses information on video clips generated by the
nds_traj_videos() function and the data on driver trajectory information generated by the
nds_traj() function to create an excel data entry workbook. The workbook contains three kinds
of variables: (a) join variables: these variables are pre-populated and are used for merging data
sets; (b) helper variables: these variables are also pre-populated and assist human reviewers in
locating video clips and facilitate the overall review process; and (c) review variables: these
variables are filled out after reviewing video clips and can be customized by a user. Table 1
provides a list of variables that are already populated in the standard annotation template.
6Table 1: List of standard variables available in the review template
ID variables: These variables are used for joining variables from other data sets
stop_traj_id Stop trajectory ID
subj Participant ID
drive Trip number
intxn_id Intersection ID
ref_time_utc Driver arrival time at the stop bar
Primary participant information: These variables help reviewers in verifying
if the study participant is driving the vehicle
primary_sub_age Age of the primary participant
primary_subj_gender Gender of the primary participant
Helper information: These variables help facilitate the review process
jump_to_ref Number of seconds into the clip at which a driver is 150
feet away from the intersection
video_url Video URL
3. Illustrative Example
In this section, we illustrate the use of the ndsintxn package functions to identify participant-
visited stop-controlled intersections and extract video clips for stopping trajectories using data
from the NDS conducted at the University of Nebraska Medical Center (UNMC) to examine the
influence of type 1 diabetes on stopping behavior at such intersections (Barnwal et al., 2021). All
participants were consented according to institutional policy under UNMC Institutional Review
Board # 462-16-FB. The whole process of identifying intersections and extracting driver trajectory
video clips is broken down into five steps: (a) data preparation, (b) automated intersection extraction,
(c) human verification of intersection locations, (d) automated driver trajectory video extraction,
and (e) manual annotation of driver behavior at intersections. Details on each step are provided in
the following paragraphs.
3.1. Step 1: Data preparation
The naturalistic driving data was structured such that one sensor and one computer vision file
was available for each participant and the data was stored on the Box cloud. As the first step, the
nds_geocomp_xytables() function was used to process sensor and computer vision files and generate
two clean files for the entire study that included information on driving trajectory and stop sign
detections for all participants.
3.2. Step 2: Automated intersection extraction
UNMC study participants were recruited from Omaha, Nebraska, and surrounding areas, and
consequently a vast majority of the travel took place within the state of Nebraska. So, Nebraska’s
LRS file was used as an input in the nds_lrs_intxns() function to extract the geographic locations
of intersection candidates in Nebraska. The plots in Figure 4 show the input LRS file with road
network highlighted in white color (Fig. A) and the geographic locations of intersection candidates
highlighted in red color (Fig. B).
Next, the list of intersection candidates in Nebraska and the computer vision file generated in
the data preparation step were used as inputs in the nds_subj_intxns() function to identify the
7Figure 4: Extraction of intersection candidate locations in Nebraska from the LRS file
geographic locations of stop-controlled intersections visited by the study participants. The plots in
Figure 5 show the locations of last stop signs detected during drives undertaken by participants in
blue color (Fig. A) and the locations of participant-visited stop-controlled intersection candidates in
red color (Fig. B).
Figure 5: Extraction of participant-visited stop-controlled intersection candidate locations in Nebraska using
the computer vision data
3.3. Step 3: Human verification of intersection locations
To further verify data accuracy, automatically extracted stop-controlled intersection candidates
were manually reviewed in Google Earth to discard false detections. The accuracy rate of the manual
review process was about 79-percent. Additionally, for each true intersection, polygons and polylines
were drawn to geocode intersection approach legs controlled by stop signs and the direction of
entering traffic, respectively. The manual review process took approximately two hours for every 100
candidate locations in the list.
83.4. Step 4: Automated driver trajectory video extraction
The reviewed intersection file and the clean sensor data were then used as inputs to the
nds_subj_traj() function to extract stop trajectory candidates. A unique combination of par-
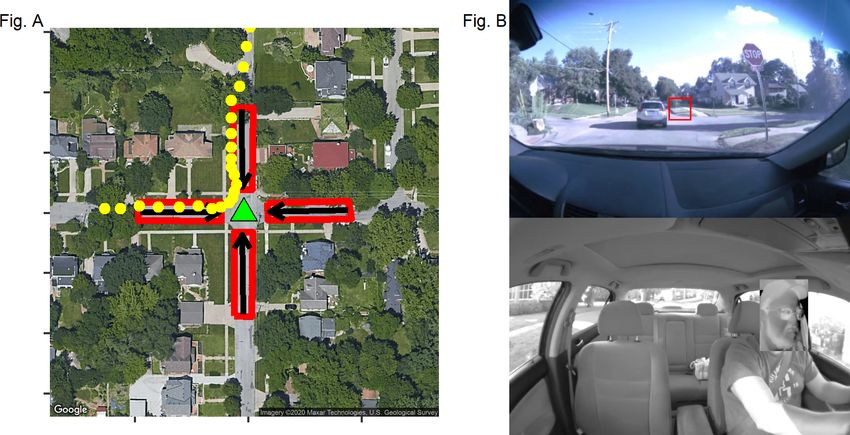
ticipant ID, trip number, and stop intersection ID defined a stop trajectory candidate. Fig. A in
plots shown in Figure 6 show a sample true intersection location (green triangle), stop-controlled
approach legs (red rectangles), and the entering traffic direction (black arrows). Stop trajectory
candidates passing through this intersection is highlighted with circles colored by trajectory ID in
Fig. B.
Figure 6: Extraction of stop trajectory candidates passing through a stop-controlled intersection
Next, the identified list of stop trajectory candidates and the list of video files were used as inputs
to nds_traj_videos() function to extract video clips associated with driving trajectories 300 feet
upstream and 200 feet downstream of the stop bars. These distances were chosen to ensure that
trajectory video clips are long enough to allow for the extraction of all analysis variables. The plots
in Figure 7 show sample trajectory points 300 feet upstream and 200 feet downstream in yellow color
(Fig. A) and the video clip associated with the trajectory (Fig. B). The video clip includes footage
of both the driving environment and the driver cabin. Additionally, a red square (see the top half of
Fig. B) is overlaid in front of the video to alert a human reviewer of an upcoming stop intersection.
3.5. Step 5: Manual annotation of driver behavior at intersections
Lastly, the cloud storage information of the extracted video clips and the driver trajectory
information were used as inputs to the nds_review_template() function to generate a data entry
annotation workbook that a human reviewer can use to extract pertinent analysis variables through
manual video review. Since we were interested in this analysis if the driver made a safe stop, so the
workbook contained custom fields such as type of stop behavior, presence or absence of a lead or a
crossing vehicle, etc. in addition to the standard fields shown in Table 1. On average, it took about
three hours for a single person to review 100 videos to extract and annotate driver behavior (e.g.,
driver stopped at stop sign or did not stop).
9Figure 7: Extraction of video clips associated with stop trajectories for manual review
4. Software Benefits
In NDSs, the time it takes to collect the entire driving data is dependent on two things: (a)
the pace of participant recruitment, which often happens in phases, and (b) the duration of data
collection for each participant. This process generally takes many months, and in some cases can even
go up to a several years. So, it is not feasible for researchers to wait for the entire data collection to
be over before they can begin driver behavior analyses. Additionally, object detection using computer
vision models for the entire driving video feeds require extensive computational power and time. In
one of our in-house naturalistic driving projects, we used Fast R-CNN (Girshick, 2015) on a server
with 2 Intel(R) Xeon(R) CPU E5-2630 v4 and 4 GPU: NVIDIA Tesla P-100 with 16 MB computer
memory (RAM) each for detecting 32 traffic elements such as vehicles, pedestrians, and traffic signs.
The video data for 183,964 driving miles that were collected over a period of one year was 6 terabytes
in size and it took about 28 days of continuous running of 4 GPUs to complete the computer vision
object detection task. This process was executed using Bash scripts and did not require any human
intervention.
To address the issues discussed above, the ndsintxn package allows users to work with whatever
driving data have been collected so far in the study. Additionally, users only need to generate computer
vision data from the driving video feeds that have been collected so far. The available sensor and
computer vision data can then be used with the ndsintxn package to generate a representative sample
of geographically dispersed intersections. If more intersections are desired, computer vision data
for additional participants can be generated and the process can be repeated to expand the list of
intersections. Furthermore, as more driving data become available, the script can be rerun to extract
additional driver trajectories to increase sample size. Another major benefit is that for subsequent
NDSs, users will already have a list of intersections available. So, they can run the script and check
if there are enough trajectories passing through the intersections. If the sample size is enough, users
do not need the computer vision data. This cuts down the time significantly and users can focus
on extracting analysis variables from the driver video clips. In the illustrative example, all the
participants were recruited from Omaha, Nebraska, and surrounding areas, so the list of intersections
prepared for this project could also be used in other projects with a similar geographic recruitment
area. This strategy can significantly reduce computational needs and data analysis time for newly
10collected data.
5. Conclusion
NDSs are critical for understanding driver behavior in real-world contexts, which are not always
well predicted in controlled on-road or simulation environments. We address the large data analytic
needs of NDSs to comprehensively address driver behavior across diverse geographic environments via
our partially automated algorithm capable of merging rich driver behavior and environmental context
information. This lays the platform for developing detailed and informative driver behavior/safety
models to inform road safety, roadway design, public policy, etc.
6. Acknowledgement
We thank the Mind & Brain Health Labs at UNMC’s Department of Neurological Sciences and
Toyota Collaborative Safety Research Center for research and funding resources. We also thank
Michelle Nutting for her help annotating and verifying this paper’s illustrative data.
11References
Barnwal, A., Chakraborty, P., Sharma, A., Riera-Garcia, L., Ozcan, K., Davami, S., Sarkar, S., Rizzo,
M., Merickel, J., 2021. Sugar and Stops in Drivers with Insulin-Dependent Type 1 Diabetes URL:
https://arxiv.org/abs/2104.03735v1.
Byrne, D., Corrado, C., Sichel, D., 2018. The Rise of Cloud Computing: Minding Your P’s, Q’s and
K’s. Technical Report w25188. National Bureau of Economic Research. Cambridge, MA. URL:
http://www.nber.org/papers/w25188.pdf, doi:10.3386/w25188.
Dingus, T.A., Hankey, J.M., Antin, J.F., Lee, S.E., Eichelberger, L., Stulce, K., McGraw, D., Loren,
M.a.S.P., Strategic Highway Research Program Safety Focus Area, Transportation Research Board,
National Academies of Sciences, Engineering, and Medicine, 2014. Naturalistic Driving Study:
Technical Coordination and Quality Control. Transportation Research Board, Washington, D.C.
URL: https://www.nap.edu/catalog/22362, doi:10.17226/22362. pages: 22362.
Dingus, T.A., Klauer, S.G., Neale, V.L., Petersen, A., Lee, S.E., Sudweeks, J., Perez, M.A., Hankey,
J., Ramsey, D., Gupta, S., Bucher, C., Doerzaph, Z.R., Jermeland, J., Knipling, R.R., 2006. The
100-Car Naturalistic Driving Study: Phase II - Results of the 100-Car Field Experiment: (624282011-
001). Technical Report. American Psychological Association. URL: http://doi.apa.org/get-pe-
doi.cfm?doi=10.1037/e624282011-001, doi:10.1037/e624282011-001. type: dataset.
Foss, R.D., Goodwin, A.H., 2014. Distracted Driver Behaviors and Distracting Conditions Among
Adolescent Drivers: Findings From a Naturalistic Driving Study. Journal of Adolescent Health 54,
S50–S60. URL: https://linkinghub.elsevier.com/retrieve/pii/S1054139X14000093, doi:10.1016/j.
jadohealth.2014.01.005.
Girshick, R., 2015. Fast R-CNN, in: 2015 IEEE International Conference on Computer Vision (ICCV),
IEEE, Santiago, Chile. pp. 1440–1448. URL: http://ieeexplore.ieee.org/document/7410526/,
doi:10.1109/ICCV.2015.169.
Google, 2021. Google Scholar. URL: https://scholar.google.com/.
Kroening, K., 2021. ffmpeg-python. URL: https://github.com/kkroening/ffmpeg-python. original-
date: 2017-05-14T05:25:44Z.
Krumm, N., Hoffman, N., 2020. Practical estimation of cloud storage costs for clinical genomic data.
Practical Laboratory Medicine 21, e00168. URL: https://linkinghub.elsevier.com/retrieve/pii/
S2352551719301052, doi:10.1016/j.plabm.2020.e00168.
National Highway Traffic Safety Administration, 2020. FARS Encyclopedia. URL: https://www-
fars.nhtsa.dot.gov/Main/index.aspx.
Neale, V.L., Dingus, T.A., Klauer, S.G., Sudweeks, J., Goodman, M., 2005. An overview of the 100-
car naturalistic study and findings, in: Proceedings of the 19th International Technical Conference
on the Enhanced Safety of Vehicles (ESV), Washington, DC.
Singh, H., Kathuria, A., 2021. Analyzing driver behavior under naturalistic driving conditions: A
review. Accident Analysis & Prevention 150, 105908. URL: https://linkinghub.elsevier.com/
retrieve/pii/S0001457520317280, doi:10.1016/j.aap.2020.105908.
12Wu, J., Xu, H., 2017. Driver behavior analysis for right-turn drivers at signalized intersections using
SHRP 2 naturalistic driving study data. Journal of Safety Research 63, 177–185. URL: https:
//linkinghub.elsevier.com/retrieve/pii/S0022437516303358, doi:10.1016/j.jsr.2017.10.010.
Xiong, H., Bao, S., Sayer, J., Kato, K., 2015. Examination of drivers’ cell phone use behavior at
intersections by using naturalistic driving data. Journal of Safety Research 54, 89.e29–93. URL:
https://linkinghub.elsevier.com/retrieve/pii/S0022437515000444, doi:10.1016/j.jsr.2015.06.
012.
13You can also read