New Zealand Government Debt Market Outlook - January 2019 - New Zealand Debt Management
←
→
Page content transcription
If your browser does not render page correctly, please read the page content below

New Zealand Government
Debt Market Outlook
January 2019

Overview

           New Zealand Economic Outlook

           New Zealand Government: Fiscal Outlook

           Debt Management: Funding Strategy and Announcements

                                                                 2
Economic Outlook

Summary of forecasts

Executive summary table
                                                                     2018      2019     2020     2021     2022     2023
  Year ended 30 June
                                                                    Actual Forecast Forecast Forecast Forecast Forecast
  Economic
  Real GDP (production basis, annual average % change)                 2.7      2.9      3.1      2.7      2.5       2.3
  Real GDP per capita (production basis, annual average % change)      0.7      1.1      1.5      1.4      1.2       1.2
  Unemployment rate (annual average, %)                                4.5      4.1      4.0      4.0      4.0       4.1
  CPI inflation (annual average % change)                              1.5      2.0      1.8      2.0      2.0       2.0
  Current account balance (% of GDP)                                  -3.4     -3.5     -3.6     -3.6     -3.6      -3.7
  Fiscal (% of GDP)
  Core Crown tax revenue                                              27.9     28.1     28.2     28.5     28.8     28.9
  Core Crown expenses                                                 28.0     29.5     28.7     28.8     28.4     28.3
  Total Crown Operating balance before gains and losses                1.9      0.6      1.3      1.5      2.2      2.3
  Core Crown residual cash                                             0.5     -1.7     -0.8     -0.3      0.3      0.8
  Net core Crown debt                                                 20.0     20.9     20.7     20.1     19.0     17.4
  Net worth attributable to the Crown                                 45.1     44.5     44.5     45.0     46.3     48.0

Source: The Treasury, HYEFU 2018

                                                                                                                           4
Growth remains solid

                           Real GDP growth
                            %
                           5.0

                                                                                    Forecast

                           2.5

                           0.0

                          -2.5
                             Jun-05   Jun-08      Jun-11       Jun-14     Jun-17      Jun-20    Jun-23
                                                              Quarterly
                                      Quarterly % change (RHS)          Annual average % change

 Source: The Treasury, HYEFU 2018
                                                                                                         5
Terms of trade supportive

                            Index (2009/10=1000)
                          1300
                                                                                   Forecast

                          1200

                          1100

                          1000

                            900
                              Jun-05      Jun-08   Jun-11     Jun-14    Jun-17   Jun-20       Jun-23
                                                            Quarterly

Source: The Treasury, HYEFU 2018
                                                                                                       6
House prices and net migration

                        Annual average % change                                         Number (000)
                         20                                                                             80

                                                                                                              Thousands
                                                                                       Forecast
                         15                                                                             60

                         10                                                                             40

                           5                                                                            20

                           0                                                                            0

                          -5                                                                            -20

                        -10                                                                             -40
                          Jun-05    Jun-08        Jun-11    Jun-14      Jun-17      Jun-20        Jun-23
                                                           Quarterly
                                        House prices                   Net migration (RHS)

 Source: The Treasury, HYEFU 2018
                                                                                                                          7
Business confidence a risk

         Net %                                                                                         Index
         60                                                                                              140

         40                                                                                             130

                                                                                                        120
         20
                                                                                                        110
           0
                                                                                                        100
        -20
                                                                                                        90
        -40
                                                                                                        80
        -60                                                                                             70

        -80                                                                                             60
          Dec-04               Dec-06    Dec-08      Dec-10     Dec-12        Dec-14   Dec-16      Dec-18

                          General business outlook     Own activity outlook      Consumer confidence

Source: The Treasury, HYEFU 2018                                                                               8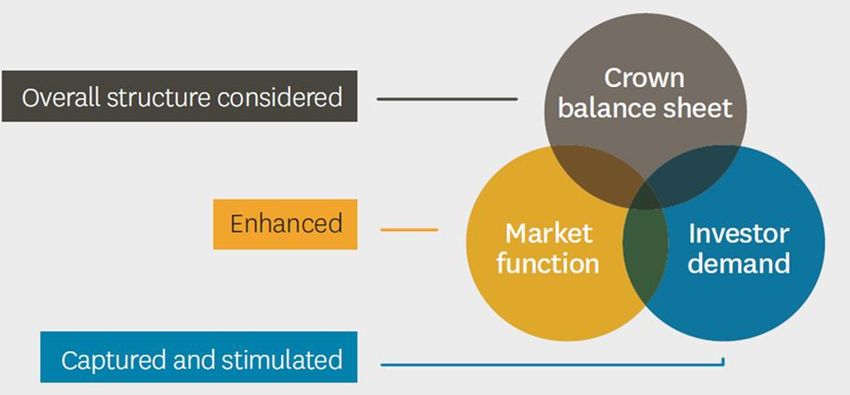
A positive output gap

                         % of labour force                                         % of potential GDP
                         8                                                                               4

                                                                                         Forecast
                         6                                                                               2

                         4                                                                               0

                         2                                                                               -2

                         0                                                                               -4
                         Jun-05      Jun-08     Jun-11      Jun-14       Jun-17      Jun-20         Jun-23
                                                          Quarterly
                                              Unemployment rate       Output gap (RHS)

Source: The Treasury, HYEFU 2018
                                                                                                              9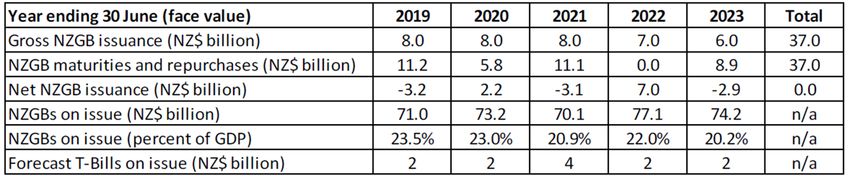
No urgency to raise OCR

                        Annual % Change                                                                              %
                             6                                                                                       9

                                                                                                                     8
                                   5
                                                                                                      Forecast       7

                                   4                                                                                 6

                                                                                                                     5
                                   3
                                                                                                                     4

                                   2                                                                                 3

                                                                                                                     2
                                   1
                                                                                                                     1

                                   0                                                                                  0
                                   Jun-02   Jun-05     Jun-08        Jun-11   Jun-14     Jun-17       Jun-20     Jun-23
                                                     CPI inflation       90-day interest rate (RHS)

Source: The Treasury, HYEFU 2018

                                                                                                                          10
Fiscal Outlook
Budget Responsibility Rules

Current Government is committed to prudent fiscal strategy with 5 Budget
Responsibility Rules:

•     Deliver a sustainable operating surplus across an economic cycle.

•     Reduce the level of net core Crown debt to 20 per cent of GDP within five years of taking office.

•     Prioritise investments to address the long-term financial and sustainability challenges facing
      New Zealand.

•     Take a prudent approach to ensure expenditure is phased, controlled and directed to maximise its benefits. The Government
      will maintain its expenditure to within the recent historical range of spending to GDP ratio.

•     Ensure a progressive taxation system that is fair, balanced and promotes the long-term sustainability and productivity of the
      economy.

Source: Budget Policy Statement, HYEFU 2018

                                                                                                                                  12
Operating surpluses sustained
$billions
15
Forecast
10
5
0
-5
-10
-15
-20
-25
2009 2011 2013 2015 2017 2019 2021 2023
Year ending 30 June
OBEGAL (after inter-segment eliminations)
Source: The Treasury, HYEFU 2018
13Capital spending impacts residual cash
$billions
15
10
5
0
-5
-10
2018 2019 2020 2021 2022 2023
Year ending 30 June
Operating Capital Residual cash
Source: The Treasury, HYEFU 2018
14Net core Crown debt contained
$billions % of GDP
80 32
Forecast
70 28
60 24
50 20
40 16
30 12
20 8
10 4
0 0
2009 2011 2013 2015 2017 2019 2021 2023
Year ending 30 June
Net core Crown debt % of nominal GDP (RHS)
Source: The Treasury, HYEFU 2018
15Funding Strategy and Announcements
Announcements at HYEFU

              Forecasts – New Zealand Government Bonds and Treasury Bills

             •     Inflation-indexed bond issuance is expected to be around NZ$1 billion of the NZ$8 billion
                   2018/19 bond programme.

             •     There are plans to commence a repurchase programme of the 15 April 2020 nominal bond
                   before the 30 June 2019. Repurchase activities will be dependent on portfolio requirements
                   and market conditions.

             •     Forecast NZGBs on issue are consistent with the Government’s commitment to maintain
                   levels of NZGBs on issue at not less than 20 percent of GDP over time. This commitment
                   was taken into consideration when setting the forecast annual bond programme for the
                   2022/23 year.
Source: The Treasury
                                                                                                                17
NZGBs – not less than 20% of GDP
NZ$b
25 30%
25%
20
20%
15
15%
10
10%
5
5%
0 0%
1998
1999
2000
2001
2002
2003
2004
2005
2006
2007
2008
2009
2010
2011
2012
2013
2014
2015
2016
2017
2018
2019
2020
2021
2022
2023
Annual bond issuance NZGBs as % GDP (rhs)
Source: The Treasury
18IIBs remain important part of funding portfolio
NZ$b NZ$b
70 18
Forecast
16
60
14
50
12
40 10
30 8
6
20
4
10
2
0 0
2013 2014 2015 2016 2017 2018 2019
Nominal Bonds Inflation-Indexed Bonds (RH) T-Bills (RH)
Source: The Treasury
19A strategic approach to IIB issuance
% NZ$b
3.5 3.0
3.0 2.5
2.5
2.0
2.0
1.5
1.5
1.0
1.0
0.5 0.5
0.0 0.0
2012 2013 2014 2015 2016 2017 2018
Inflation-Indexed Bonds Issuance (RH)
Inflation Breakeven for IIB 20 Sep 2025
Source: The Treasury
20Syndication preferred for new bonds
NZ$b
5.0
4.5
4.0
3.5 IIB
Sep
3.0 2030
IIB
Sep NZGB
2035
2.5 Apr
2037
2.0
1.5 IIB
Sep NZGB NZGB NZGB NZGB
2025
1.0 Apr Apr Apr NZGB IIB Apr
2020 2027 2033 Apr Sep 2029
2025 2040
0.5
0.0
2012 2013 2014 2015 2016 2017 2018
Syndication volumes (calendar years)
Nominal Bonds Inflation-Indexed Bonds
Source: The Treasury
21Funding strategy priorities
The debt funding strategy aims to minimise the Crown’s borrowing costs over the
long-term, while keeping risk at an appropriate level.
Implemented in a transparent, even-handed and consistent manner.
Source: The Treasury
22Changing funding needs
NZ$b NZ$b
20 90
Forecast
18 80
16 70
14
60
12
50
10
40
8
30
6
4 20
2 10
0 0
2001
2002
2003
2004
2005
2006
2007
2008
2009
2010
2011
2012
2013
2014
2015
2016
2017
2018
2019
2020
2021
2022
2023
Annual bond issuance - year ended June
Total Market Bonds on Issue (RHS)
Source: The Treasury
23Structure of NZGB portfolio
NZ$b
12.0
10.0
8.0
6.0
4.0
2.0
0.0
Mar Apr May Apr Apr Sep Apr Apr Sep Apr Sep Apr Sep
19 20 21 23 25 25 27 29 30 33 35 37 40
Source: The Treasury
24Evolution of portfolio structure
Source: The Treasury
25Maintaining diverse investor base
NZ$b %
80 90
70 80
60 70
60
50
50
40
40
30
30
20 20
10 10
0 0
Dec 94 Dec 97 Dec 00 Dec 03 Dec 06 Dec 09 Dec 12 Dec 15 Dec 18
Resident holdings of NZGBs (NZ$b)
Non-resident holdings of NZGBs (NZ$b)
Non-resident holdings of NZGBs (%) (RH)
Source: Bloomberg, RBNZ
26Increase in proportion of resident holdings
Non-resident proportional holdings of NZGS
% %
50 75
48
46 70
44
42 65
40
38 60
36
34 55
32
30 50
Jul 2015 Jan 2016 Jul 2016 Jan 2017 Jul 2017 Jan 2018 Jul 2018
Inflation-Indexed Bonds Total (incl. T-Bills) (RH) Nominal Bonds (RH)
Source: RBNZ
27Current snapshot: Holdings of NZGBs
Holdings of New Zealand Government Bonds
NZ$b
December 2018
12.0
10.0
8.0
6.0
4.0
2.0
0.0
2019 2020 2021 2023 2025 2025 2027 2029 2030 2033 2035 2037 2040
NB NB NB NB NB IIB NB NB IIB NB IIB NB IIB
Source: RBNZ
28Disclaimer
This presentation has been prepared by the Treasury on behalf of the New Zealand Government and is for general
information purposes only. By listening to the presentation, or reading the presentation materials, you acknowledge and
agree to the contents of this disclaimer.
To the maximum extent permitted by law, neither the Treasury nor the New Zealand Government makes any representation,
recommendation or warranty, express or implied as to the accuracy, completeness or currency of any of the information in
this presentation and accept no responsibility or liability therefore. Data are indicative and approximate only, and all
information is subject to change. This presentation is intended as a snapshot view of New Zealand only, and the Treasury and
the New Zealand Government have no obligation, and do not undertake or accept any responsibility or obligation, to update,
expand or correct anything in this presentation or inform you of any matter arising or coming to their notice, after the date of
this presentation, which may affect any matter referred to in this presentation.
This presentation contains forward-looking statements including information regarding the Treasury’s future bond issuances
and the New Zealand Government’s forecast fiscal and economic performance based on current information, estimates and
forecasts. Those statements are subject to risks, uncertainties, and assumptions which are hard to predict or anticipate, and
therefore actual outcomes and performance may differ materially from the statements. Any opinions expressed in this
presentation reflect the judgement of the Treasury as the date hereof, and do not bind the Treasury nor the New Zealand
Government.
This presentation is not a product disclosure statement, disclosure document or other offer document under New Zealand law
or any other law. This presentation is not, and does not constitute financial advice. All reasonable care has been taken in
relation to the preparation and collation of this presentation. Except for statutory liability which may not be excluded, no
person, including the Treasury or any person mentioned in this presentation accepts responsibility for any loss or damage
howsoever occurring resulting from the use or reliance on this presentation by any person. Past performance is not indicative
of future performance and no guarantee or future rights are implied or given.
Nothing in this presentation is an offer to sell, or solicitation of an offer to purchase, any securities. This presentation must
not be relied upon by any person for making any investment decision and will not form part of any investment contract. The
information provided in this presentation is not investment advice and does not take into account the investment objectives,
financial situation or particular needs (including financial and taxation issues) of any particular investor. Any person
considering in investing in New Zealand Government securities must refer to any relevant offer documents and disclosures
provided expressly in connection with those securities and should take their own independent financial and legal advice on
their proposed investment. New Zealand Government securities have not been and will not be registered under the United
States Securities Act of 1933 (U.S Securities Act) or the securities laws of any state or other jurisdiction of the United States.
New Zealand Government securities may not be offered or sold, directly or indirectly, in the United States or to, or for the
account or benefit of, any person in the United States except in transactions exempt from, or not subject to, the registration
requirements of the U.S. Securities Act and any other applicable U.S. state securities laws.
This presentation may not be copied, distributed, disclosed or used without the Treasury’s express written consent.
29You can also read