Nordea Eiendomskreditt Covered Bonds
          Investor presentation Q3 2017
←
→
Page content transcription
If your browser does not render page correctly, please read the page content below

Nordea Eiendomskreditt Covered Bonds
Investor presentation Q3 2017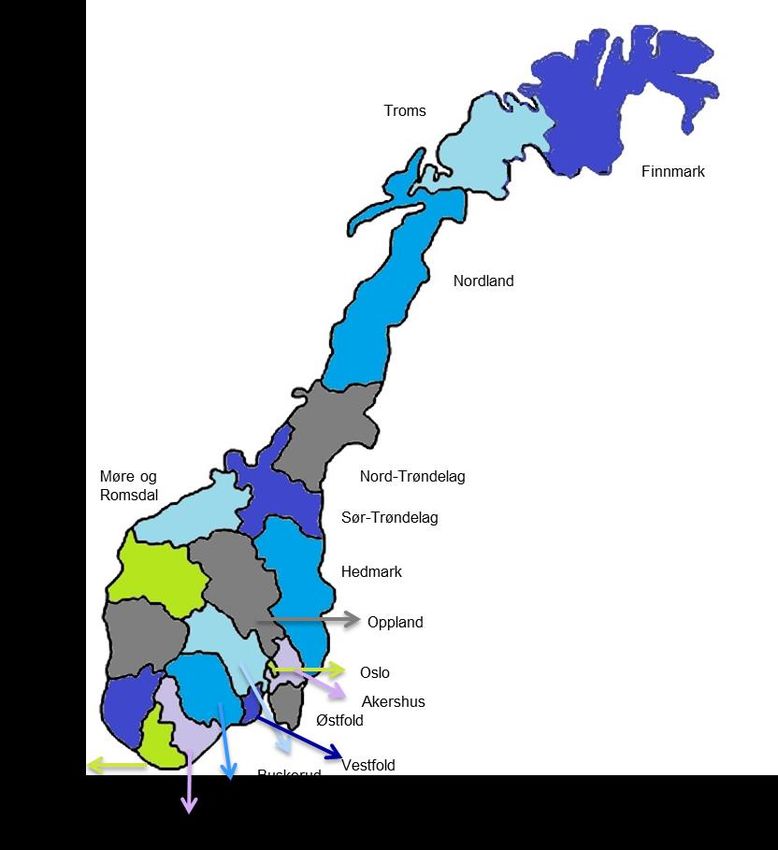
Nordea Eiendomskreditt – overview
Q3 2017

•   A 100% owned subsidiary of Nordea Bank AB
•   The purpose of the Issuer is to acquire and provide residential mortgage loans and finance its activities mainly
    through issuance of covered bonds
•   Loans in Nordea Eiendomskreditt (NE) are originated by Nordea Bank AB, Norwegian branch and subsequently
    transferred to NE
      • Collateral must be in the form of mortgages in residential real estate or in shares in housing cooperatives
      • At the time of transfer, the loans are not in default, i.e. payments of installments and interest are not overdue at
        the time of transfer
•   Covered bonds rated Aaa by Moody’s
•   16% market share of outstanding covered issuance in Norwegian market
•   Cost-effective loan origination and service through Nordea Bank’s nationwide Norwegian branch network and internet

2
Cover pool key characteristics
Q3 2017
Pool notional NOK 116.4bn
Outstanding Covered Bonds NOK 76.7bn
Cover pool content Mortgage loans secured by Norwegian residential collateral
Geographic distribution Throughout Norway with concentration to urban areas
Asset distribution 100% residential
Weighted average LTV 49.5% (indexed, calculated per property)
Average loan size NOK 1.45m
Over Collateralisation (OC) 51.9%, (2% legal requirement)
Rate type Floating 98.3%, Fixed 1.7%
Amortisation Bullet/ interest only 35.2%, Amortizing 64.8%
Substitute assets None
Pool type Dynamic
Loans originated by Nordea Bank AB, Norway Branch
3Cover pool key characteristics (2)
Q3 2017
Cover pool balance by loan category Weighted Average LTV - Indexed
100%
90%
Summer houses 80% Legal limit 75%
3%
70%
Tenant owner units
23% Legal limit 60%
60%
50,3%
50% 47,7%
45,6%
40%
Single family
houses 30%
74%
20%
10%
0%
Single-family houses Tenant owner units Summer houses
4Loan to Value (LTV) Each loan is reported in the highest bucket Q3 2017 Weighted Average LTV – Unindexed 50.4% LTV buckets Nominal (NOKm) % Residential Loans >0 - 40 - 50 - 60 - 70 - 0 - 40 - 50 - 60 - 70 -
Cover pool – geographic distribution
Q3 2017

                                       Fylke              Loan balance   Region
                                       Akershus             16,88 %       East
                                       Aust-Agder            1,65 %      South
                                       Buskerud              3,94 %       East
                                       Finnmark              0,49 %      North
                                       Hedmark               1,88 %       East
                                       Hordland             11,59 %      West
                                       Møre og Romsdal       7,76 %      West
                                       Nordland              2,11 %      North
                                       Nord-Trøndelag        0,28 %       Mid
                                       Oppland               3,69 %       East
                                       Oslo                 22,04 %       East
                                       Rogaland              4,49 %      West
                                       Sogn og Fjordane      1,19 %      West
                                       Svalbard              0,00 %      North
                                       Sør-Trøndelag         3,26 %       Mid
                                       Telemark              1,18 %       East
                                       Troms                 2,31 %      North
                                       Vest-Agder            4,37 %      South
                                       Vestfold              3,51 %       East
                                       Østfold               7,36 %       East

6
Nordea Eiendomskreditt relative to market
Q3 2017
• Average amount outstanding covered bonds at • Market turnover was 76% of total outstanding in 2016
Oslo Børs and ABM Nordic was NOK 493bn, and
NEK’s share was 16% • Nordea Eiendomskreditt covered bonds turnover was
103% of total outstanding in 2016
Market share NOK Covered 2017-Q3 Current maturities
NOK Billions
20,0
16 %
15,0
10,0
5,0
84 %
-
2018 2019 2020 2021 2022 2025 2031
Nordea Eiendomskreditt Other Fixed FRN
7Nordea Eiendomskreditt bonds offer a pick-up
Q3 2017
2,5
2
1,5
1
0,5
0
NGB 2019 Norges Bank depo rate Nordea Eiendomskreditt 2019
8Covered bonds – outstanding volumes
Q3 2017
Breakdown by ISIN
ISIN Currency Amount (NOKm) Maturity Coupon (%)
NO0010674971 NOK 10 277 2018-06-20 FRN
NO0010647241 NOK 12 195 2019-06-19 FRN
NO0010692767 NOK 2 380 2019-06-19 3,05
NO0010703531 NOK 12 115 2020-06-17 FRN
NO0010741903 NOK 1 000 2020-06-17 1,75
NO0010729817 NOK 10 955 2021-06-16 FRN
NO0010584345 NOK 9 383 2021-06-16 4,25
NO0010758931 NOK 2 615 2022-06-15 1,08
NO0010759632 NOK 5 590 2022-06-15 FRN
NO0010593064 NOK 550 2025-06-18 4,8
NO0010766827 NOK 550 2031-06-18 1,75
XS1210746134 GBP 1 526 2020-03-30 FRN
XS1342698047 GBP 6 518 2019-01-14 FRN
XS1487838291 GBP 133 2021-09-09 FRN
XS1451306036 EUR 938 2031-07-15 0,74
Total 76 675
9Underwriting criteria – common Nordea policy
Q3 2017
• Affordability
• Customers ability to service its commitment out of its cash flow/income is critical
• Repayment ability of borrowers is calculated using stressed scenarios. Customers must manage 5 percentage points increase on interest rate on all debt
• Scoring of retail customers
• Payment history
• Credit bureau check is always conducted. Potential external payment remarks are revealed
• Collateral
• Information from Norwegian official property register in order to secure correct real estate ownership and priority
• Nordea accepts four sources of real estate valuations:
• Written statement from external authorized valuer
• Last sales price (within 6 months)
• Use of external evaluating system “Eiendomsverdi” (used by most banks and real estate agents in Norway)
• Written statement from (external) real estate agent
10DISCLAIMER – IMPORTANT NOTICE This presentation and any information contained in this presentation or supplied in connection therewith, whether in writing or not, are provided for information purposes only. Nordea is not acting as your financial adviser or in any other fiduciary capacity and this presentation should not be treated as giving investment advice. This presentation and any information contained in this presentation or supplied in connection therewith, whether in writing or not, do not constitute or form a part of, and should not be construed as, an offer, recommendation, advertisement of an offer or invitation to subscribe for or purchase covered bonds or any securities of any Nordea Group company anywhere in the world or a solicitation of any such offer, and shall neither form the basis of, or be relied on in connection with, any offer or commitment whatsoever. This presentation is a very brief summary of some of the characteristics and data concerning Nordea Eiendomskreditt AS’ covered bonds. Further information regarding Nordea Eiendomskreditt AS and its covered bonds, including risk factors, can, in particular, be found in the prospectuses relating to its covered bond programmes. Some of the information contained in this presentation is derived from publicly available sources which Nordea believes are reliable, and includes market information based on data provided by third party sources identified herein and estimates, assessments, adjustments and judgments that are based on Nordea's experience and familiarity with the sectors in which it operates. There is no assurance that such estimates, assessments and judgments are the most appropriate for making determinations relating to market information or that market information prepared by other sources will not differ materially from the market information included herein. This presentation may contain forward-looking statements that reflect management's current views with respect to certain future events and potential financial performance. Although Nordea believes that the expectations reflected in such forward-looking statements are reasonable, no assurance can be given that such expectations will prove to have been correct. Accordingly, results could differ materially from those set out in the forward-looking statements as a result of various factors. Important factors that may cause such a difference for Nordea include, but are not limited to: (i) the macroeconomic development, (ii) change in the competitive climate and (iii) change in interest rate and foreign exchange rate levels. This presentation does not imply that Nordea has undertaken to revise any forward-looking statements, beyond what is required by applicable law or applicable stock exchange regulations if and when circumstances arise that will lead to changes compared to the date when these statements were provided. Neither Nordea, Nordea Eiendomskreditt AS nor any of its directors, officers, employees or advisors nor any other person makes any representation or warranty, express or implied, as to the accuracy or completeness of the information contained in this presentation. Among other things, this presentation contains data and figures derived from reports that may include further information, such as definitions, explanations and references, which are necessary for understanding the data and figures in question. Neither Nordea nor any its directors, officers, employees or advisors nor any other person shall have any liability whatsoever for loss howsoever arising, directly or indirectly, from any use of this presentation. You may not distribute this presentation, in whole or part, without our prior ex-press written permission. This presentation is not for release, directly or indirectly, in or into the United States of America, Australia or Japan. 11
You can also read